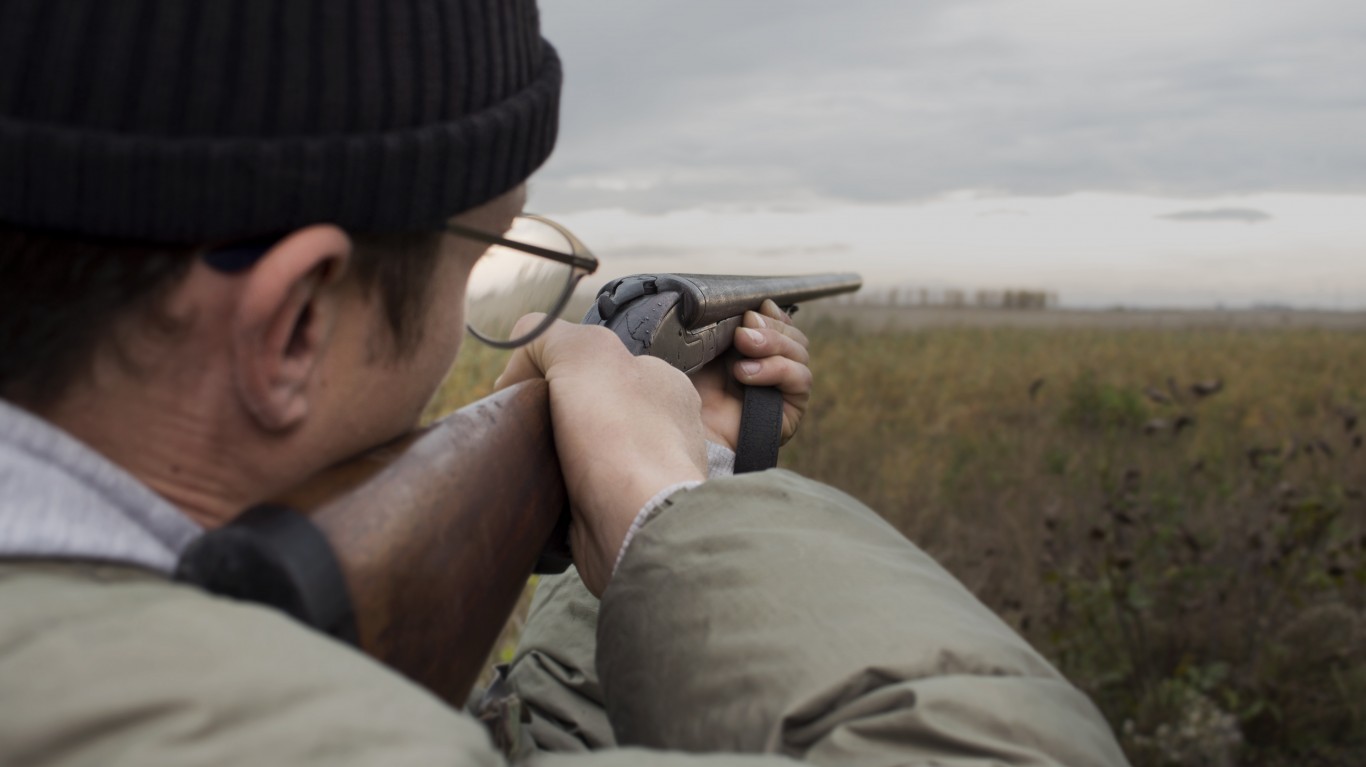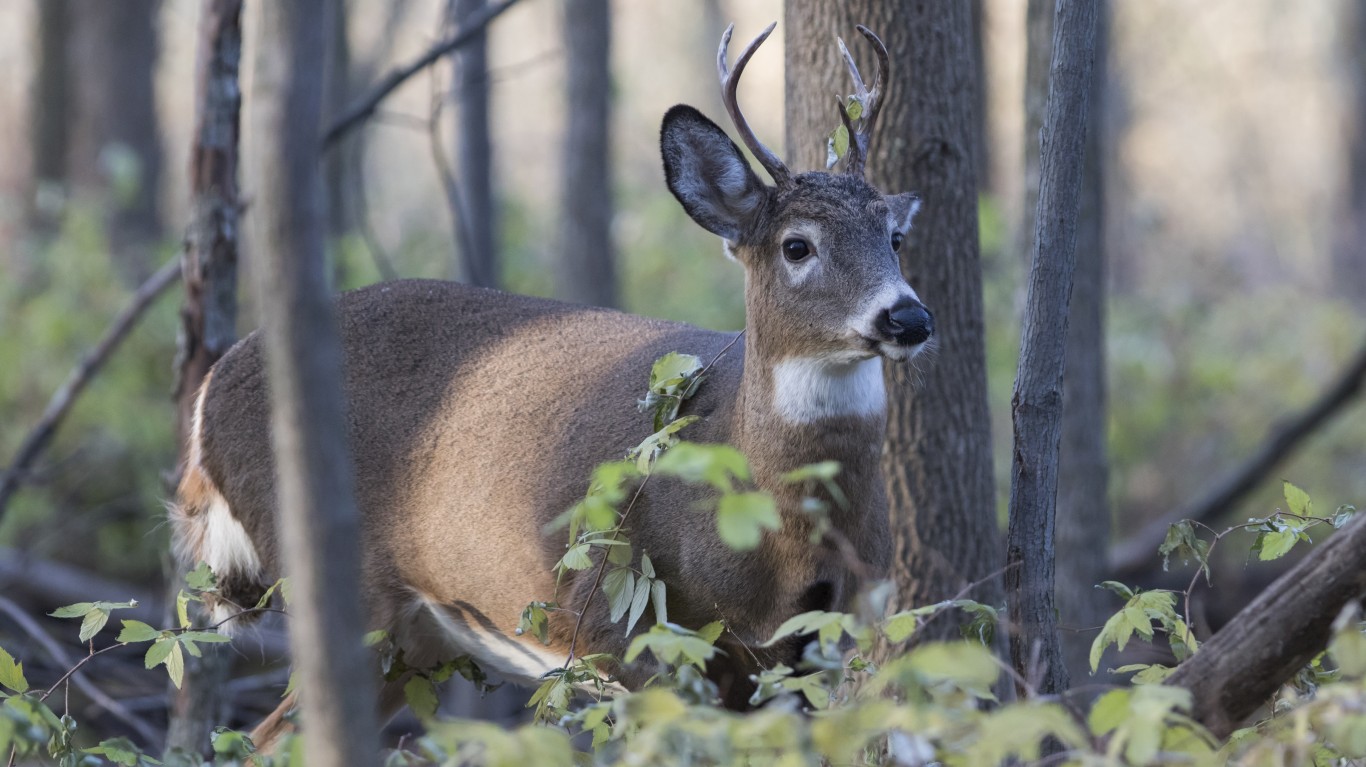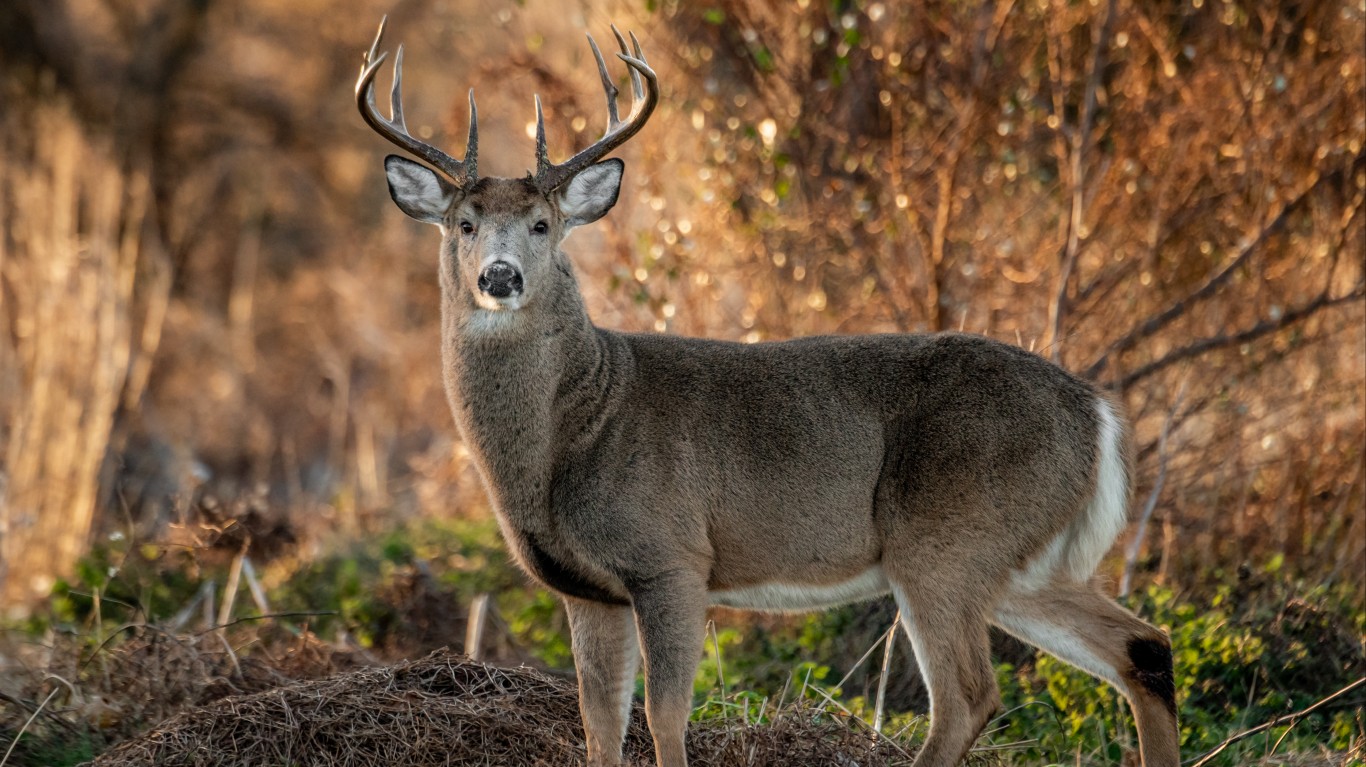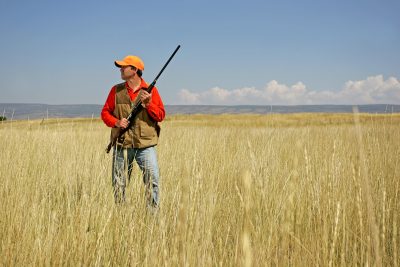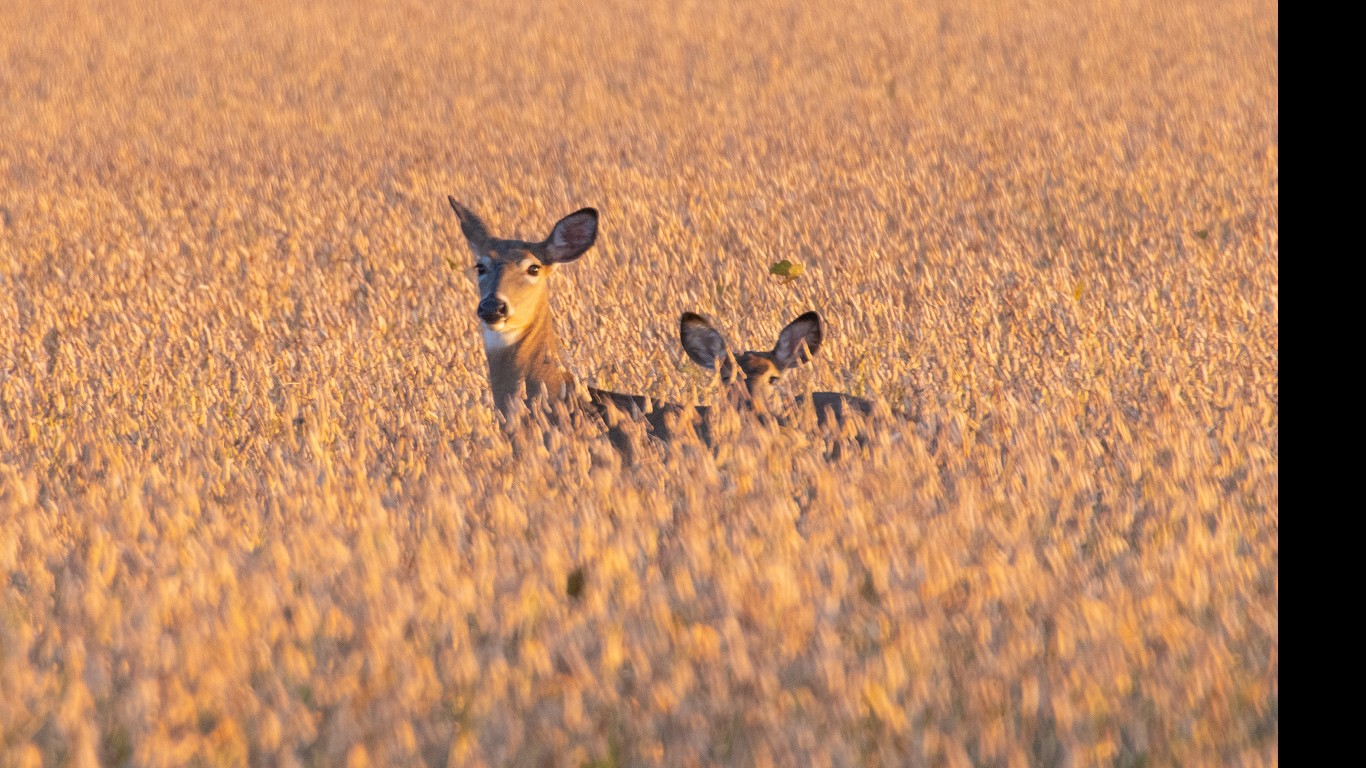
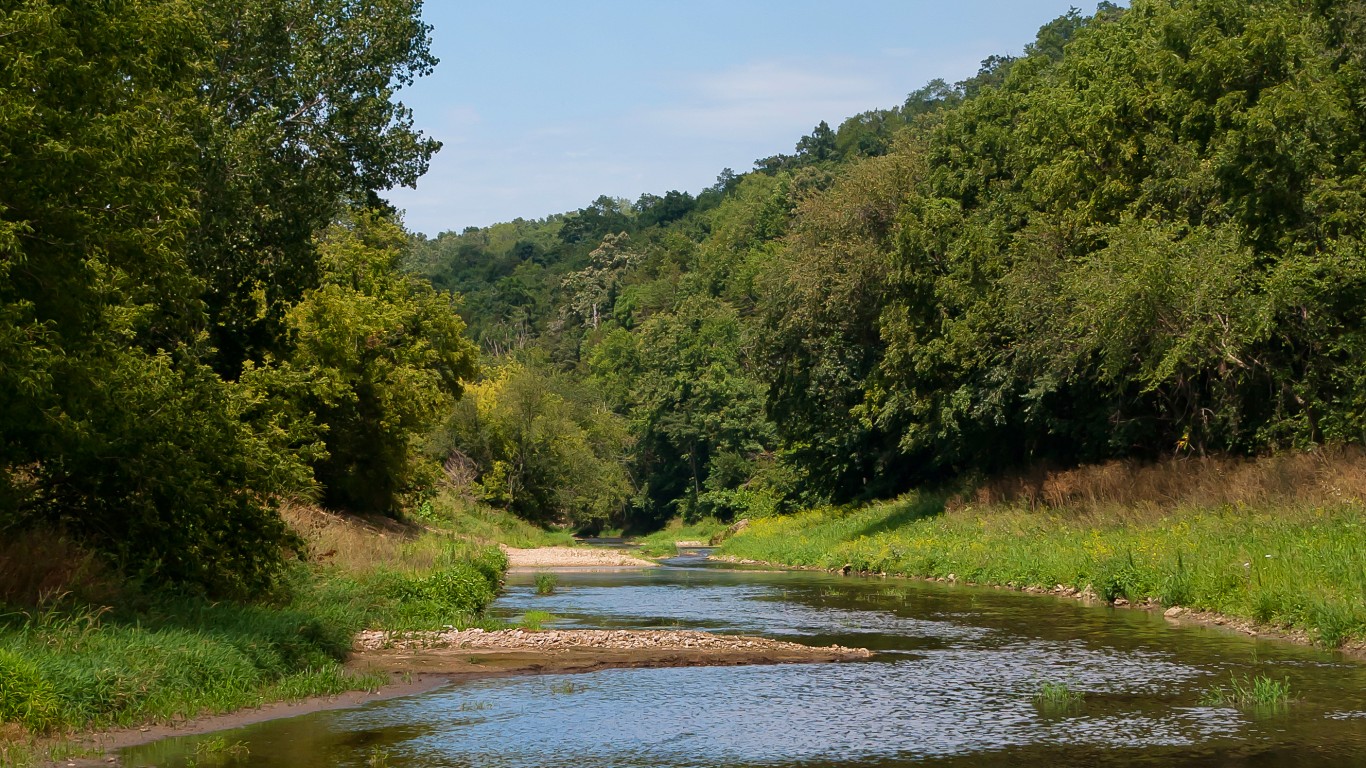
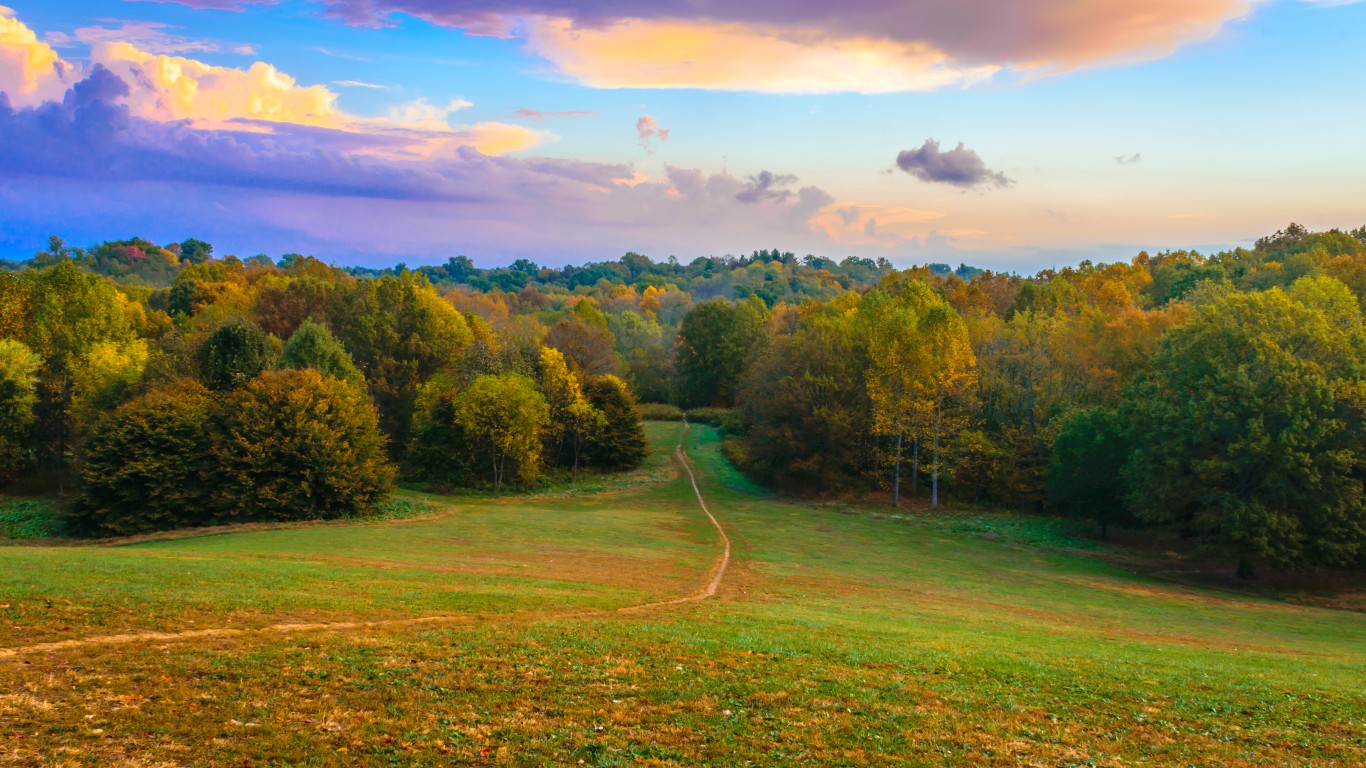
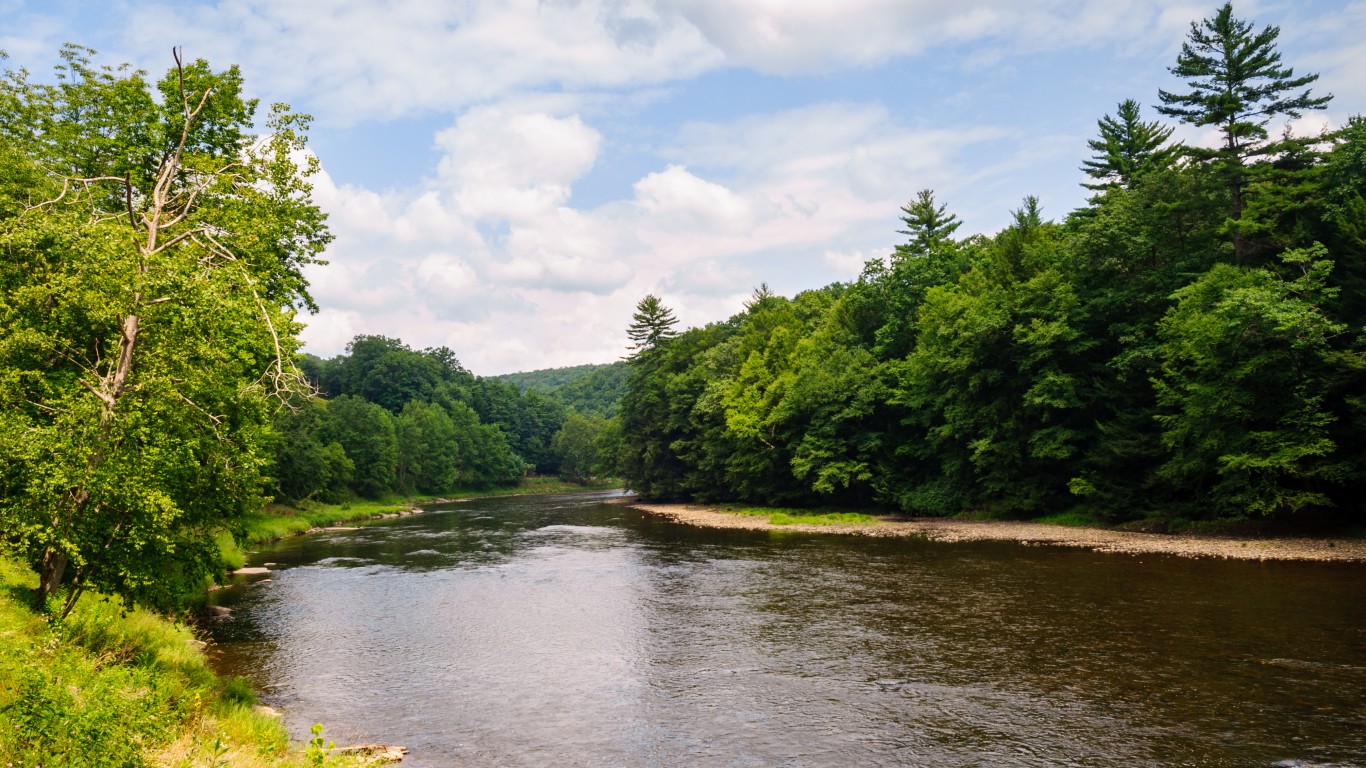
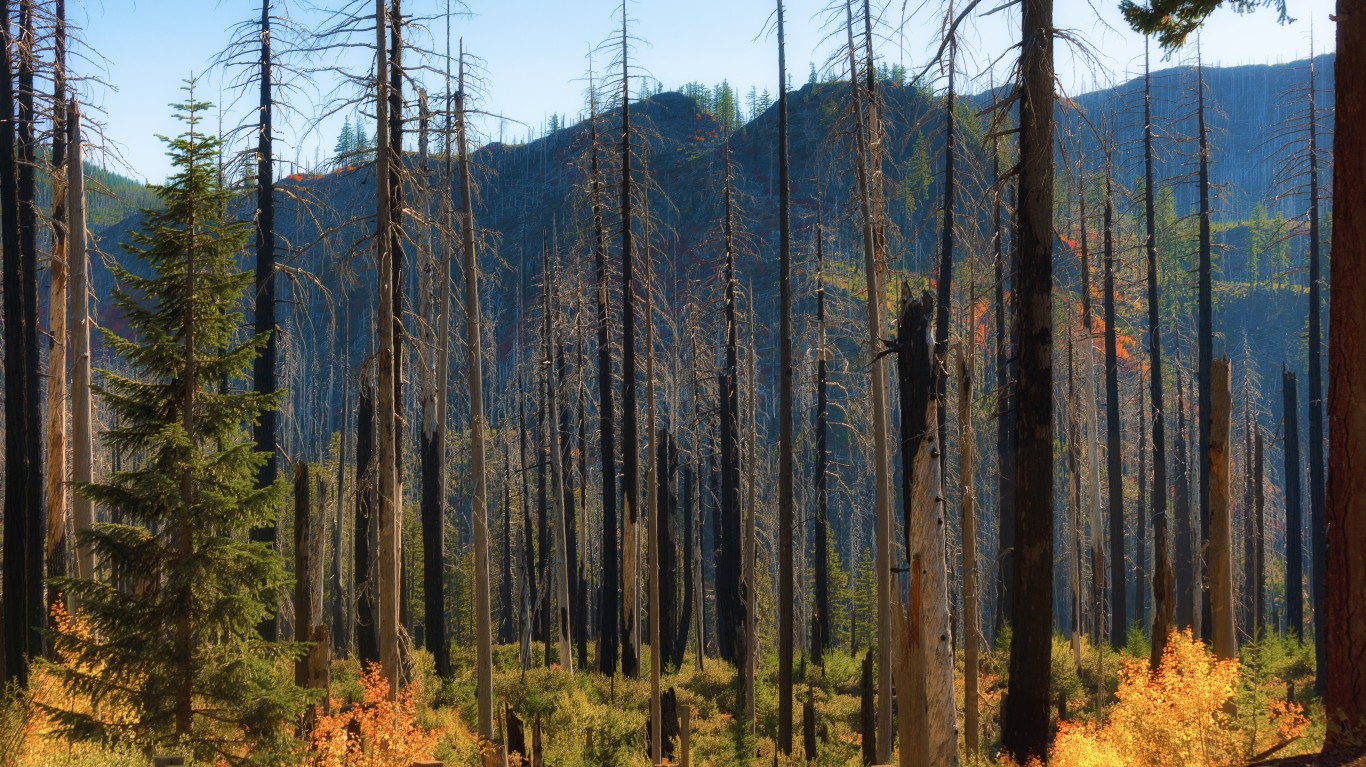
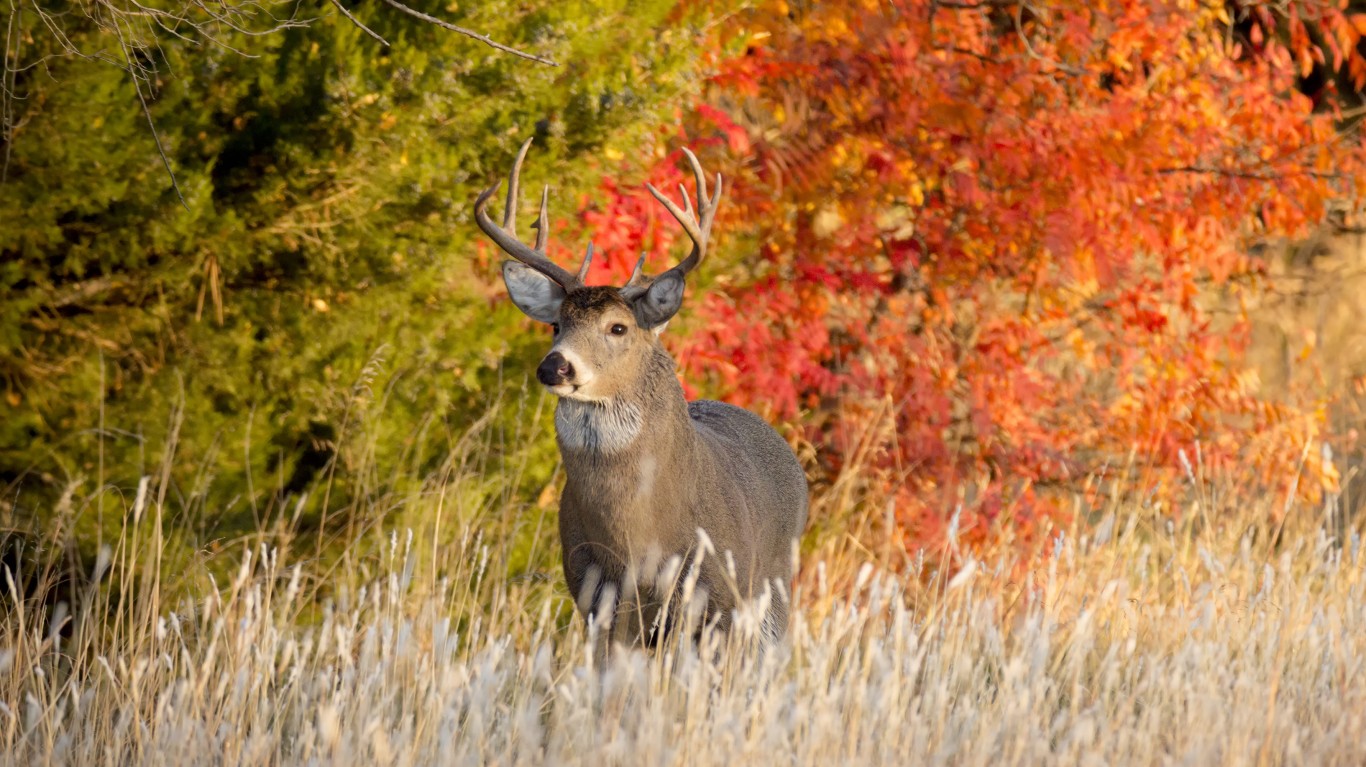
While hunting was once a requirement for survival, today it has become a recreation and sport for many. According to Statista, in 2023 there were over 500,000 people with hunting licenses in the country. Some of the most common animals hunted in America include deer, pheasants, geese, ducks, quail, and elk. (These are the best states for duck and goose hunting.)
To find which state in the nation has the most hunters, 24/7 Wall St. used data on hunting license apportionments from the U.S. Fish and Wildlife Service. We ranked states based on the number of paid hunting licenses issued in 2021 per 100 residents. Using population data from the U.S. Census Bureau we adjusted hunting license apportionments per capita. Data on the gross cost of paid hunting licenses issued in 2021 came from the USFWS. Finally, we took data from the percentage of state-operated public land from the Protected Areas Database program of the U.S. Geological Survey.
Why This Matters

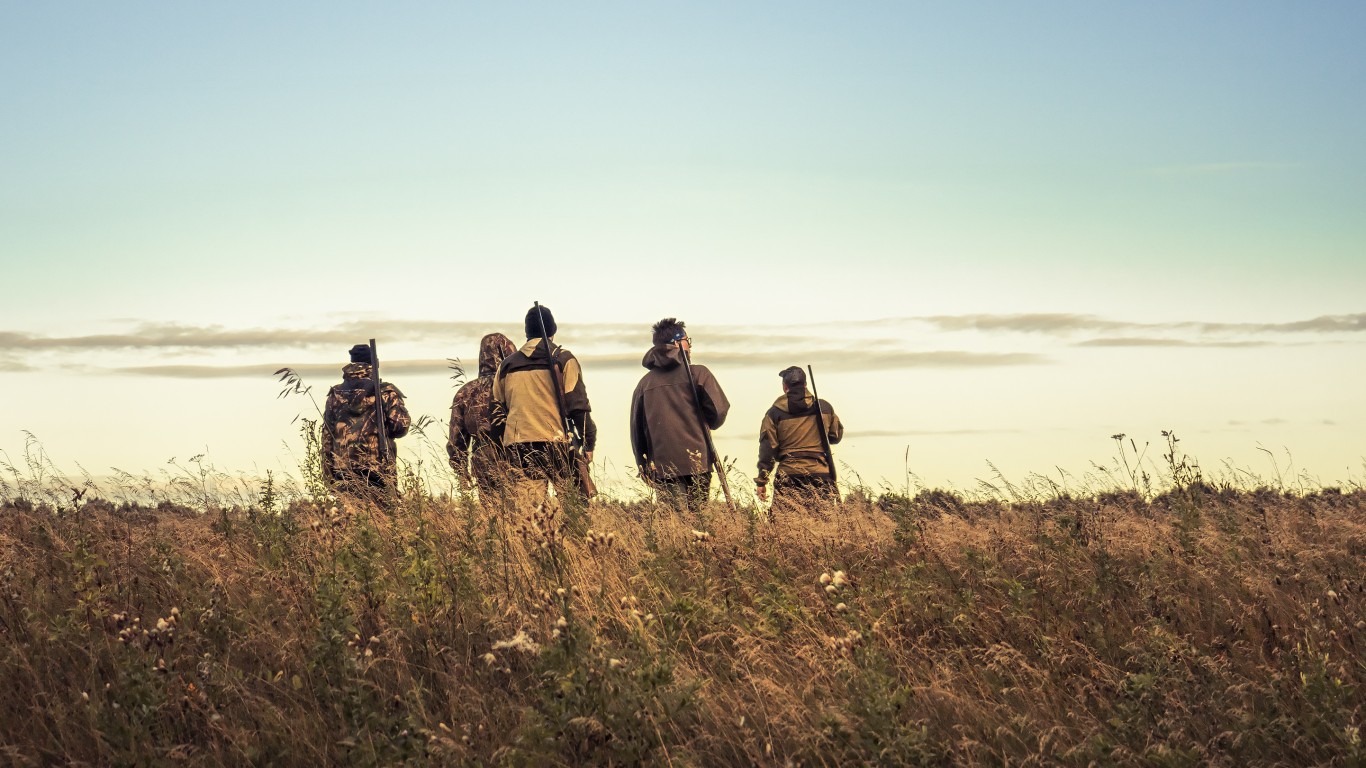
The hunting industry supports the US economy, especially in rural areas where seasonal hunting brings in tourist dollars. Hunters spend money each year on their hobby by buying gear, food, lodging, and many other goods and services. Money raised from fees and excise taxes also contributes to wildlife conservation and public access to lands.
See below for the state with the most hunters: every state ranked. Data is for the year 2021.
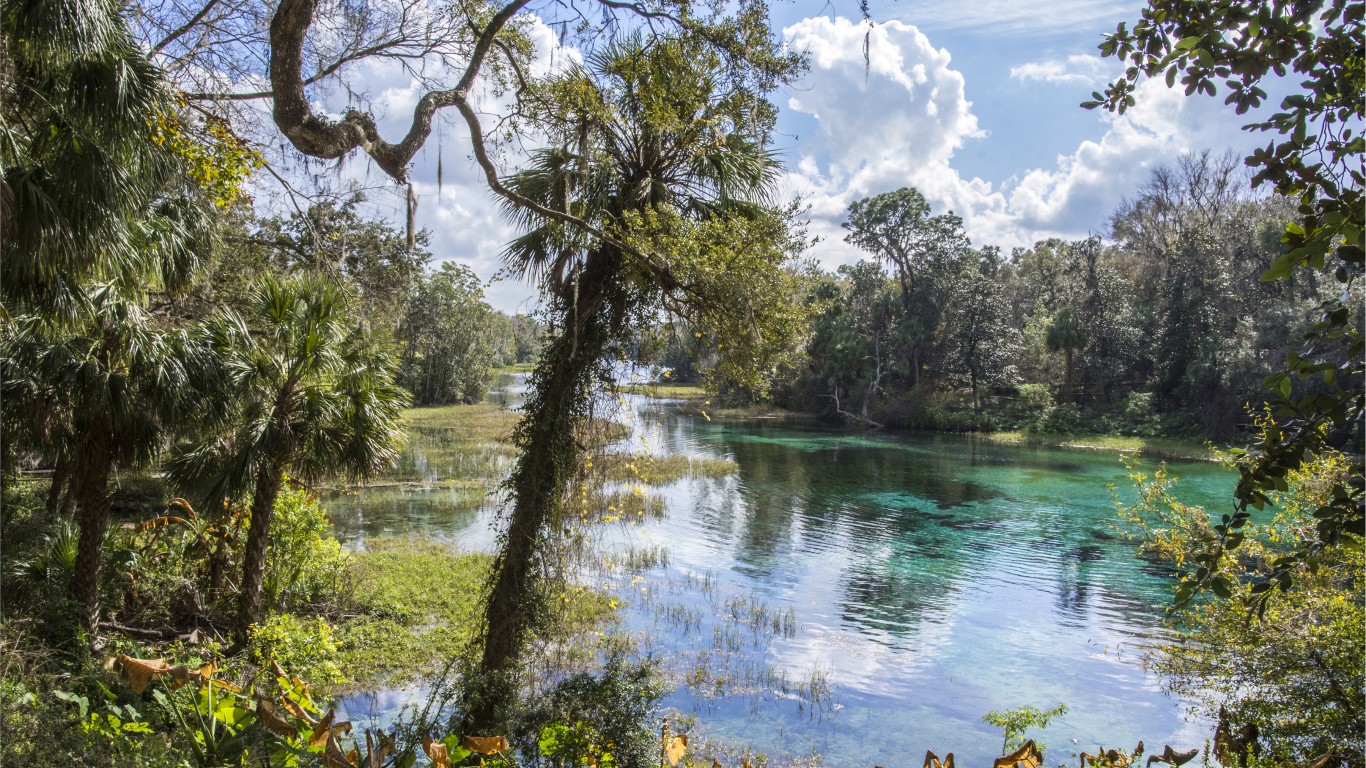
50. California

- Paid hunting licenses issued (adjusted for state population): 0.7 per 100 residents
- Average hunting license expense: $86.67 per hunter (16th most)
- Total paid hunting licenses issued: 278,210 (23rd most)
- Percent of public lands in total state area: 55.9% (6th most)
49. Rhode Island
- Paid hunting licenses issued (adjusted for state population): 0.7 per 100 residents
- Average hunting license expense: $63.84 per hunter (25th least)
- Total paid hunting licenses issued: 7,985 (the least)
- Percent of public lands in total state area: 10.9% (17th least)
48. New Jersey
- Paid hunting licenses issued (adjusted for state population): 0.8 per 100 residents
- Average hunting license expense: $114.71 per hunter (6th most)
- Total paid hunting licenses issued: 71,707 (8th least)
- Percent of public lands in total state area: 23.6% (16th most)
47. Hawaii

- Paid hunting licenses issued (adjusted for state population): 0.8 per 100 residents
- Average hunting license expense: $40.91 per hunter (9th least)
- Total paid hunting licenses issued: 11,270 (2nd least)
- Percent of public lands in total state area: 40.5% (11th most)
46. Massachusetts
- Paid hunting licenses issued (adjusted for state population): 0.9 per 100 residents
- Average hunting license expense: $43.51 per hunter (12th least)
- Total paid hunting licenses issued: 59,652 (5th least)
- Percent of public lands in total state area: 19.4% (18th most)
45. Connecticut
- Paid hunting licenses issued (adjusted for state population): 0.9 per 100 residents
- Average hunting license expense: $71.24 per hunter (24th most)
- Total paid hunting licenses issued: 30,807 (4th least)
- Percent of public lands in total state area: 15.8% (25th most)
44. Florida
- Paid hunting licenses issued (adjusted for state population): 1.0 per 100 residents
- Average hunting license expense: $36.67 per hunter (6th least)
- Total paid hunting licenses issued: 217,113 (19th least)
- Percent of public lands in total state area: 27.0% (14th most)
43. Delaware
- Paid hunting licenses issued (adjusted for state population): 1.7 per 100 residents
- Average hunting license expense: $91.41 per hunter (13th most)
- Total paid hunting licenses issued: 16,728 (3rd least)
- Percent of public lands in total state area: 14.6% (22nd least)
42. Maryland
- Paid hunting licenses issued (adjusted for state population): 1.9 per 100 residents
- Average hunting license expense: $54.44 per hunter (20th least)
- Total paid hunting licenses issued: 116,422 (11th least)
- Percent of public lands in total state area: 14.1% (21st least)
41. Illinois
- Paid hunting licenses issued (adjusted for state population): 2.3 per 100 residents
- Average hunting license expense: $111.83 per hunter (7th most)
- Total paid hunting licenses issued: 289,922 (21st most)
- Percent of public lands in total state area: 4.3% (5th least)
40. Washington
- Paid hunting licenses issued (adjusted for state population): 2.4 per 100 residents
- Average hunting license expense: $103.00 per hunter (8th most)
- Total paid hunting licenses issued: 185,147 (16th least)
- Percent of public lands in total state area: 38.3% (12th most)
39. New York

- Paid hunting licenses issued (adjusted for state population): 2.8 per 100 residents
- Average hunting license expense: $42.13 per hunter (11th least)
- Total paid hunting licenses issued: 560,346 (8th most)
- Percent of public lands in total state area: 15.3% (25th least)
38. Virginia
- Paid hunting licenses issued (adjusted for state population): 2.9 per 100 residents
- Average hunting license expense: $89.42 per hunter (14th most)
- Total paid hunting licenses issued: 253,650 (23rd least)
- Percent of public lands in total state area: 16.0% (24th most)
37. Ohio

- Paid hunting licenses issued (adjusted for state population): 3.1 per 100 residents
- Average hunting license expense: $75.33 per hunter (21st most)
- Total paid hunting licenses issued: 360,421 (15th most)
- Percent of public lands in total state area: 6.0% (8th least)
36. Nevada

- Paid hunting licenses issued (adjusted for state population): 3.4 per 100 residents
- Average hunting license expense: $71.45 per hunter (23rd most)
- Total paid hunting licenses issued: 106,861 (10th least)
- Percent of public lands in total state area: 83.2% (the most)
35. Texas

- Paid hunting licenses issued (adjusted for state population): 4.0 per 100 residents
- Average hunting license expense: $41.90 per hunter (10th least)
- Total paid hunting licenses issued: 1,170,316 (the most)
- Percent of public lands in total state area: 4.1% (4th least)
34. Indiana
- Paid hunting licenses issued (adjusted for state population): 4.0 per 100 residents
- Average hunting license expense: $46.17 per hunter (15th least)
- Total paid hunting licenses issued: 273,423 (24th most)
- Percent of public lands in total state area: 4.7% (6th least)
33. South Carolina
- Paid hunting licenses issued (adjusted for state population): 4.2 per 100 residents
- Average hunting license expense: $46.38 per hunter (16th least)
- Total paid hunting licenses issued: 219,222 (20th least)
- Percent of public lands in total state area: 9.4% (11th least)
32. New Hampshire
- Paid hunting licenses issued (adjusted for state population): 4.4 per 100 residents
- Average hunting license expense: $83.54 per hunter (17th most)
- Total paid hunting licenses issued: 60,629 (6th least)
- Percent of public lands in total state area: 24.9% (15th most)
31. Arizona

- Paid hunting licenses issued (adjusted for state population): 4.8 per 100 residents
- Average hunting license expense: $59.52 per hunter (22nd least)
- Total paid hunting licenses issued: 349,554 (16th most)
- Percent of public lands in total state area: 55.1% (7th most)
30. North Carolina
- Paid hunting licenses issued (adjusted for state population): 6.2 per 100 residents
- Average hunting license expense: $20.12 per hunter (the least)
- Total paid hunting licenses issued: 654,251 (7th most)
- Percent of public lands in total state area: 10.7% (16th least)
29. Colorado

- Paid hunting licenses issued (adjusted for state population): 6.4 per 100 residents
- Average hunting license expense: $207.63 per hunter (2nd most)
- Total paid hunting licenses issued: 370,736 (14th most)
- Percent of public lands in total state area: 44.7% (10th most)
28. Michigan
- Paid hunting licenses issued (adjusted for state population): 6.6 per 100 residents
- Average hunting license expense: $56.19 per hunter (21st least)
- Total paid hunting licenses issued: 660,933 (6th most)
- Percent of public lands in total state area: 15.3% (24th least)
27. New Mexico
- Paid hunting licenses issued (adjusted for state population): 6.6 per 100 residents
- Average hunting license expense: $141.52 per hunter (5th most)
- Total paid hunting licenses issued: 140,685 (13th least)
- Percent of public lands in total state area: 47.6% (9th most)
26. Iowa
- Paid hunting licenses issued (adjusted for state population): 6.9 per 100 residents
- Average hunting license expense: $101.84 per hunter (9th most)
- Total paid hunting licenses issued: 220,576 (21st least)
- Percent of public lands in total state area: 3.0% (3rd least)
25. Georgia
- Paid hunting licenses issued (adjusted for state population): 7.1 per 100 residents
- Average hunting license expense: $26.89 per hunter (4th least)
- Total paid hunting licenses issued: 769,105 (3rd most)
- Percent of public lands in total state area: 9.9% (13th least)
24. Kentucky
- Paid hunting licenses issued (adjusted for state population): 7.1 per 100 residents
- Average hunting license expense: $71.07 per hunter (25th most)
- Total paid hunting licenses issued: 321,347 (19th most)
- Percent of public lands in total state area: 7.7% (10th least)
23. Pennsylvania
- Paid hunting licenses issued (adjusted for state population): 7.4 per 100 residents
- Average hunting license expense: $44.63 per hunter (13th least)
- Total paid hunting licenses issued: 953,903 (2nd most)
- Percent of public lands in total state area: 18.7% (20th most)
22. Oregon
- Paid hunting licenses issued (adjusted for state population): 7.8 per 100 residents
- Average hunting license expense: $91.63 per hunter (12th most)
- Total paid hunting licenses issued: 331,475 (17th most)
- Percent of public lands in total state area: 56.8% (4th most)
21. Utah
- Paid hunting licenses issued (adjusted for state population): 8.0 per 100 residents
- Average hunting license expense: $78.87 per hunter (19th most)
- Total paid hunting licenses issued: 268,075 (25th most)
- Percent of public lands in total state area: 72.0% (2nd most)
20. Missouri
- Paid hunting licenses issued (adjusted for state population): 8.3 per 100 residents
- Average hunting license expense: $51.33 per hunter (18th least)
- Total paid hunting licenses issued: 509,963 (10th most)
- Percent of public lands in total state area: 7.6% (9th least)
19. Kansas
- Paid hunting licenses issued (adjusted for state population): 8.7 per 100 residents
- Average hunting license expense: $93.39 per hunter (11th most)
- Total paid hunting licenses issued: 255,143 (25th least)
- Percent of public lands in total state area: 1.9% (the least)
18. Nebraska
- Paid hunting licenses issued (adjusted for state population): 9.4 per 100 residents
- Average hunting license expense: $86.91 per hunter (15th most)
- Total paid hunting licenses issued: 185,034 (15th least)
- Percent of public lands in total state area: 2.4% (2nd least)
17. Louisiana

- Paid hunting licenses issued (adjusted for state population): 9.6 per 100 residents
- Average hunting license expense: $22.13 per hunter (2nd least)
- Total paid hunting licenses issued: 442,678 (13th most)
- Percent of public lands in total state area: 10.1% (14th least)
16. Mississippi
- Paid hunting licenses issued (adjusted for state population): 9.6 per 100 residents
- Average hunting license expense: $49.13 per hunter (17th least)
- Total paid hunting licenses issued: 283,021 (22nd most)
- Percent of public lands in total state area: 9.8% (12th least)
15. Minnesota
- Paid hunting licenses issued (adjusted for state population): 9.6 per 100 residents
- Average hunting license expense: $61.86 per hunter (23rd least)
- Total paid hunting licenses issued: 550,663 (9th most)
- Percent of public lands in total state area: 18.9% (19th most)
14. Vermont
- Paid hunting licenses issued (adjusted for state population): 10.0 per 100 residents
- Average hunting license expense: $71.53 per hunter (22nd most)
- Total paid hunting licenses issued: 64,343 (7th least)
- Percent of public lands in total state area: 16.5% (23rd most)
13. Alabama
- Paid hunting licenses issued (adjusted for state population): 10.0 per 100 residents
- Average hunting license expense: $45.46 per hunter (14th least)
- Total paid hunting licenses issued: 504,600 (11th most)
- Percent of public lands in total state area: 5.9% (7th least)
12. Tennessee
- Paid hunting licenses issued (adjusted for state population): 10.4 per 100 residents
- Average hunting license expense: $39.06 per hunter (7th least)
- Total paid hunting licenses issued: 728,759 (4th most)
- Percent of public lands in total state area: 10.2% (15th least)
11. Arkansas
- Paid hunting licenses issued (adjusted for state population): 10.7 per 100 residents
- Average hunting license expense: $61.95 per hunter (24th least)
- Total paid hunting licenses issued: 323,474 (18th most)
- Percent of public lands in total state area: 13.6% (20th least)
10. Wisconsin
- Paid hunting licenses issued (adjusted for state population): 11.4 per 100 residents
- Average hunting license expense: $53.51 per hunter (19th least)
- Total paid hunting licenses issued: 669,813 (5th most)
- Percent of public lands in total state area: 14.7% (23rd least)
9. Oklahoma
- Paid hunting licenses issued (adjusted for state population): 12.5 per 100 residents
- Average hunting license expense: $26.30 per hunter (3rd least)
- Total paid hunting licenses issued: 499,182 (12th most)
- Percent of public lands in total state area: 11.7% (18th least)
8. Alaska
- Paid hunting licenses issued (adjusted for state population): 13.4 per 100 residents
- Average hunting license expense: $77.73 per hunter (20th most)
- Total paid hunting licenses issued: 98,202 (9th least)
- Percent of public lands in total state area: 56.2% (5th most)
7. West Virginia
- Paid hunting licenses issued (adjusted for state population): 14.2 per 100 residents
- Average hunting license expense: $35.18 per hunter (5th least)
- Total paid hunting licenses issued: 253,955 (24th least)
- Percent of public lands in total state area: 12.1% (19th least)
6. Maine
- Paid hunting licenses issued (adjusted for state population): 15.1 per 100 residents
- Average hunting license expense: $39.41 per hunter (8th least)
- Total paid hunting licenses issued: 207,849 (18th least)
- Percent of public lands in total state area: 18.1% (21st most)
5. Idaho

- Paid hunting licenses issued (adjusted for state population): 15.9 per 100 residents
- Average hunting license expense: $142.14 per hunter (4th most)
- Total paid hunting licenses issued: 301,994 (20th most)
- Percent of public lands in total state area: 68.0% (3rd most)
4. North Dakota
- Paid hunting licenses issued (adjusted for state population): 19.4 per 100 residents
- Average hunting license expense: $81.97 per hunter (18th most)
- Total paid hunting licenses issued: 150,724 (14th least)
- Percent of public lands in total state area: 21.6% (17th most)
3. Montana
- Paid hunting licenses issued (adjusted for state population): 20.9 per 100 residents
- Average hunting license expense: $166.57 per hunter (3rd most)
- Total paid hunting licenses issued: 231,339 (22nd least)
- Percent of public lands in total state area: 37.6% (13th most)
2. South Dakota
- Paid hunting licenses issued (adjusted for state population): 23.0 per 100 residents
- Average hunting license expense: $101.08 per hunter (10th most)
- Total paid hunting licenses issued: 206,316 (17th least)
- Percent of public lands in total state area: 16.9% (22nd most)
1. Wyoming
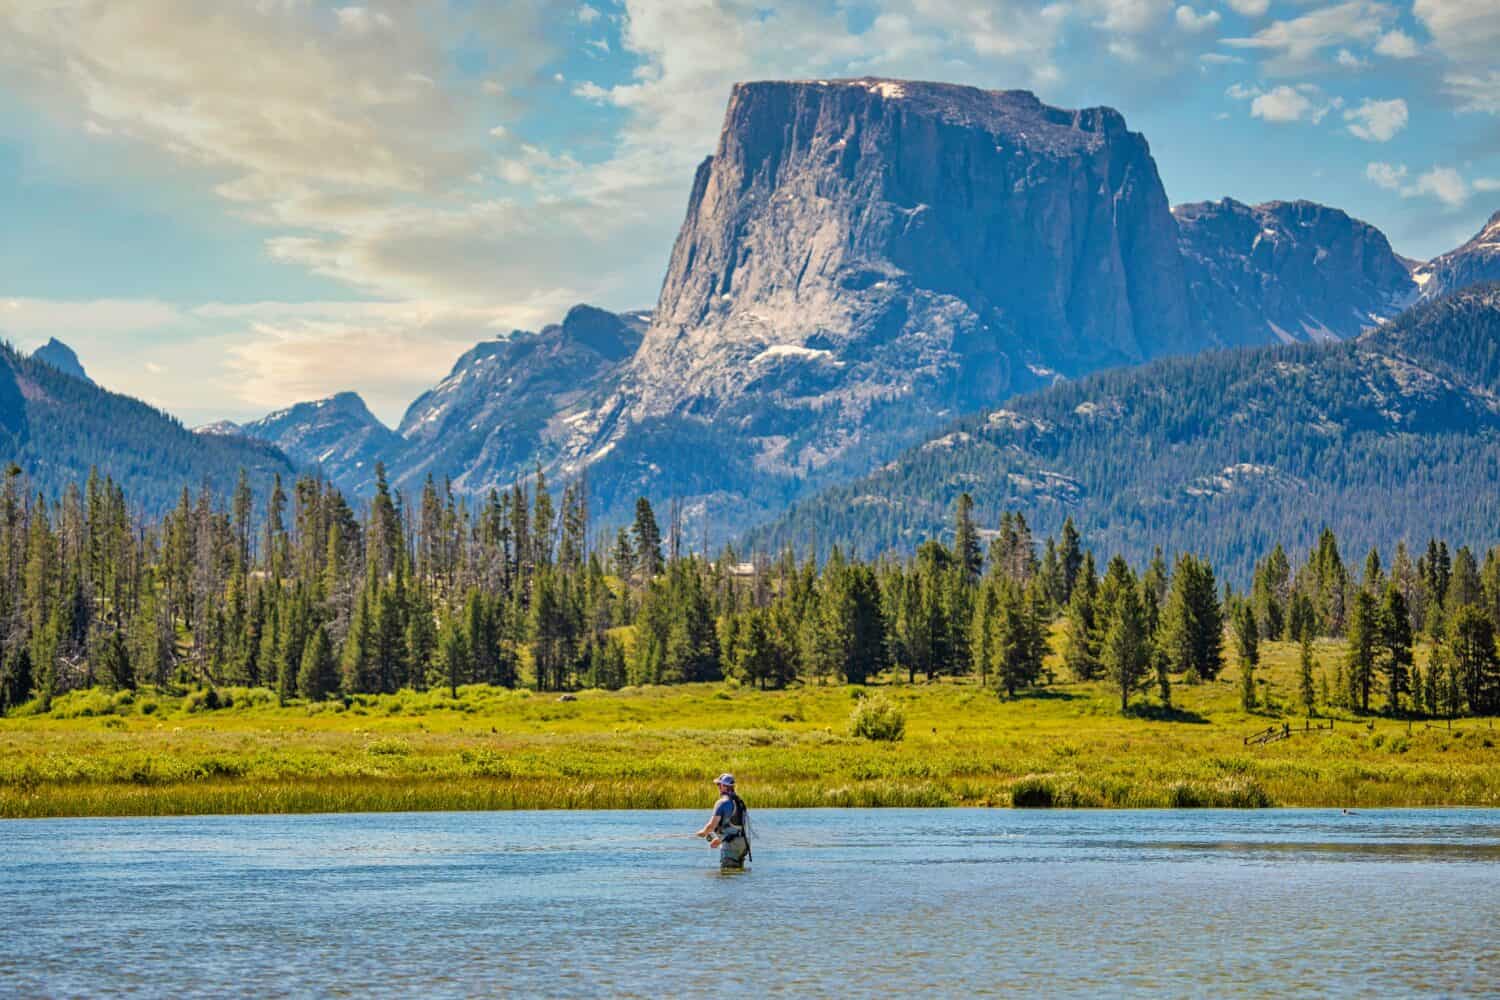
- Paid hunting licenses issued (adjusted for state population): 23.5 per 100 residents
- Average hunting license expense: $258.66 per hunter (the most)
- Total paid hunting licenses issued: 136,205 (12th least)
- Percent of public lands in total state area: 54.2% (8th most)