Health and Healthcare

This State Sees the Highest Fatality Rate Due to Medical Care Complications

Hawaii+hospital+emergency | 190823-N-AW702-005
190823-N-AW702-005 by NavyMedicine / PDM 1.0 (https://creativecommons.org/publicdomain/mark/1.0/)

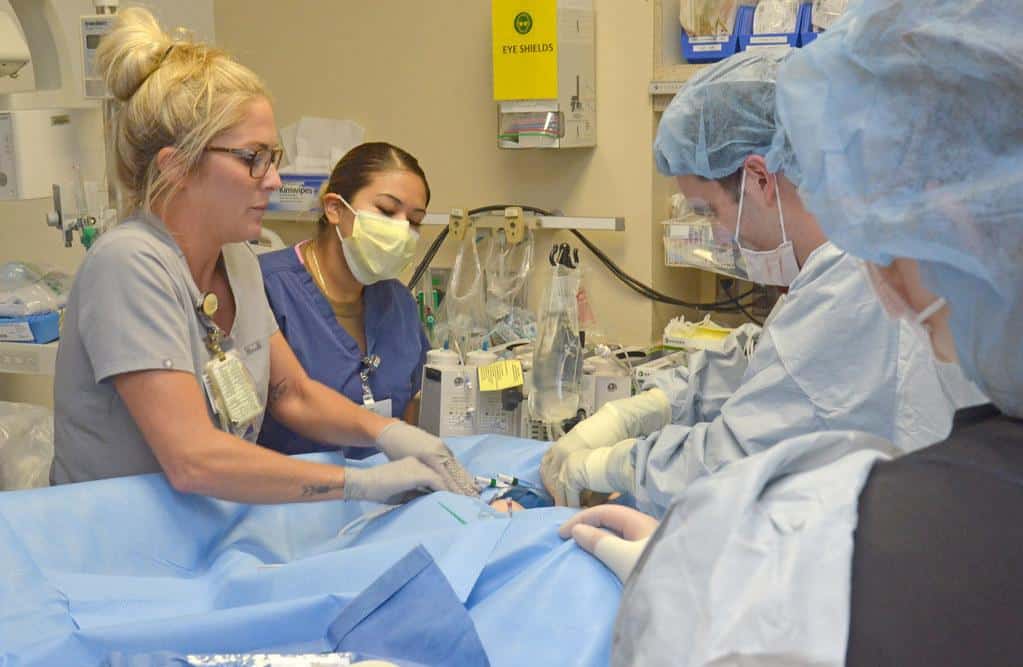
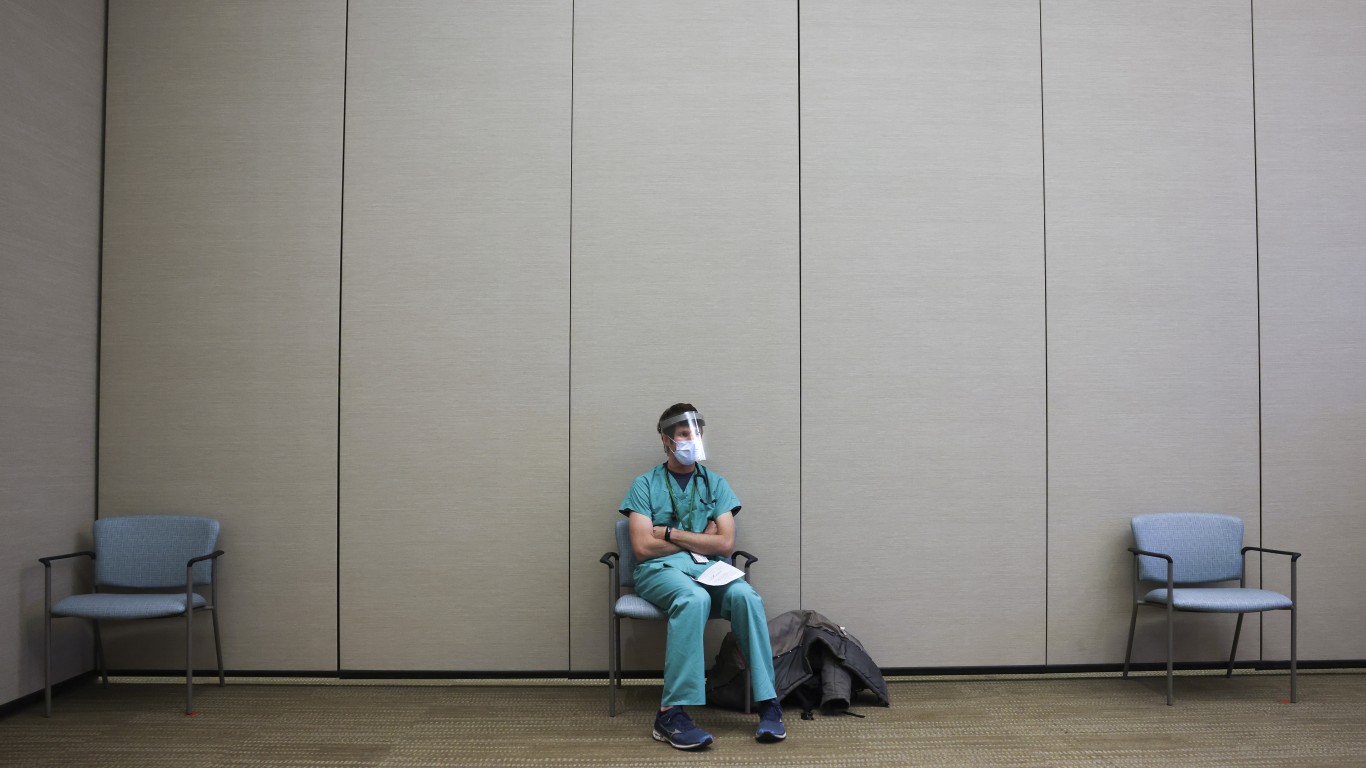
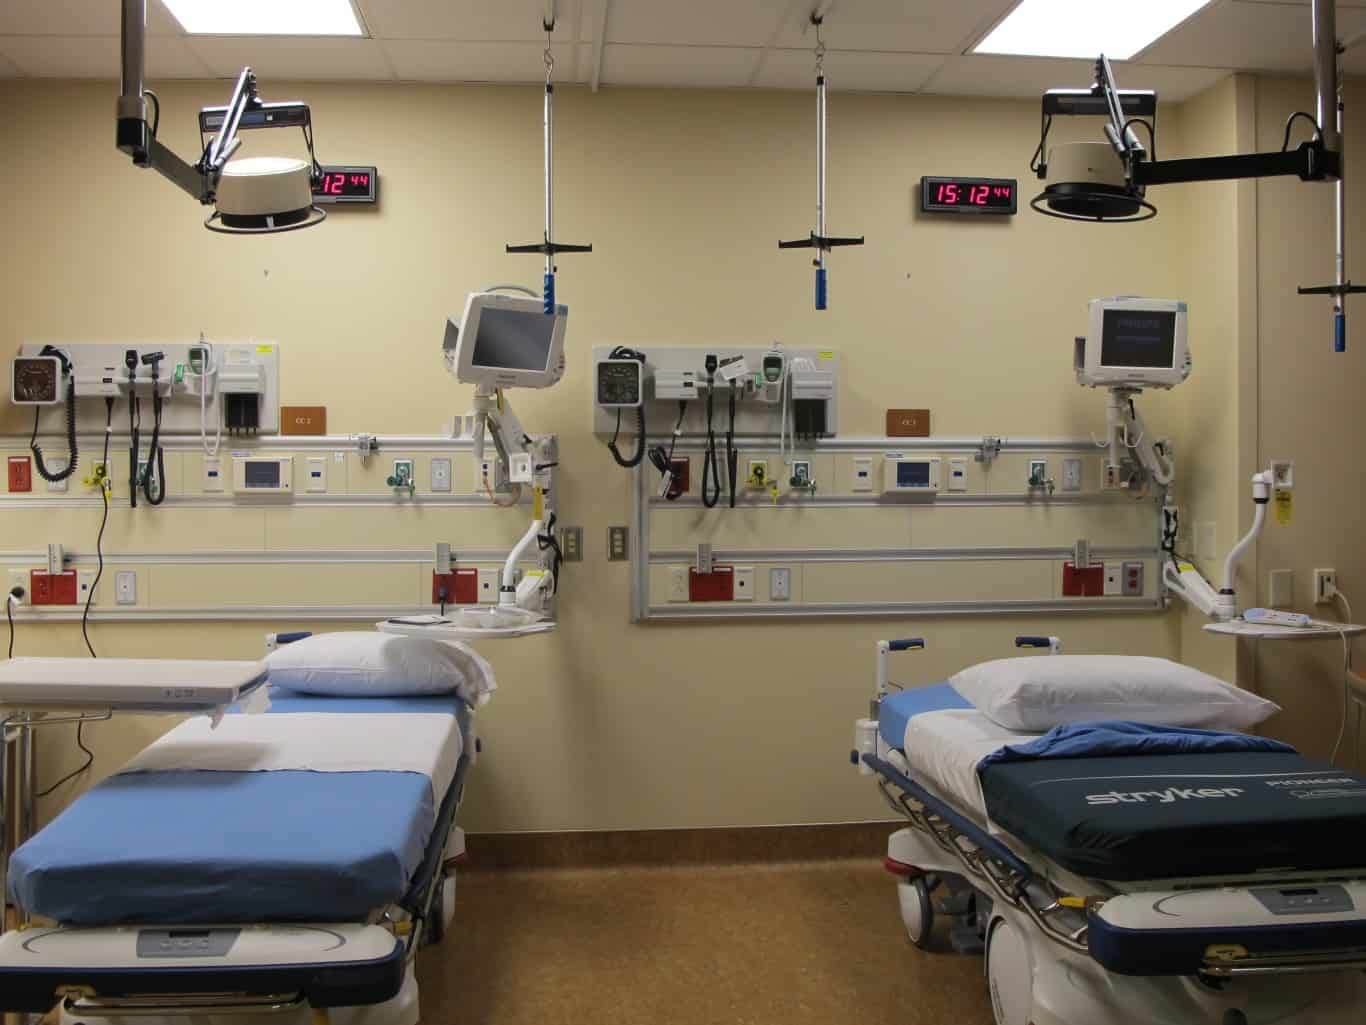
Each year, over 35 million Americans end up in hospitals due to accidents, surgeries, and life-threatening illnesses. Though many of us think of hospitals as safe places offering great care, this is not always the case. The majority of doctors and hospital staff seek to ensure patient experience is both high quality and comforting. However, accidents and oversights still happen.

There were 21,345 deaths due to complications of medical and surgical care in the U.S. from 2018 to 2021, according to the Centers for Disease Control and Prevention. These are deaths to patients that are a direct result of medical and surgical care such adverse drug reactions, contracting a serious infection, bleeding from surgery, and more. Some are direct results of medical staff errors.

A 2016 Johns Hopkins study was even more shocking. It revealed medical error to be the third leading cause of death in the United States, with 250,000 people losing their life each year. And sadly, these numbers are likely even higher. The CDC coding system, which is used to record cause of death on American death certificates, does not account for poor communication or bad judgment. It also doesn’t factor in diagnostic mistakes.

In the 49 states on the list (South Dakota was excluded as the CDC deemed the data unreliable), there were anywhere from 0.7 deaths from such compilations per 100,000 people in California to 2.61 deaths per 100,000 people in Wyoming. Mississippi, Arkansas, New Mexico, and Kansas round out the five states with the most deaths due to complications per capita.

Hawaii, Massachusetts, New York, and Wisconsin round out the five states with the lowest reported deaths from medical care complications per capita.

To determine the states with the most deaths from complications of medical and surgery, 24/7 Wall St. reviewed data on mortality due to medical complications from the CDC’s WONDER database. States were ranked based on the number of deaths due to complications of medical and surgical care per 100,000 state residents from 2018 to 2021. Mortality data is age-adjusted. Mortality data for South Dakota was unreliable per the CDC and was excluded from our analysis.

Supplemental data used to calculate the average dollar amount of medical malpractice payouts per resident from 2010 to 2022 are from the National Practitioner Data Ban of the U.S. Department of Health & Human Services and the U.S. Census Bureau’s Population and Housing Unit Estimates program and are inflation adjusted. Data on median annual salary for health care practitioners and technical occupations are from the Bureau of Labor Statistics Occupational Employment and Wage Statistics program and are for 2022. Data on the percentage of the civilian noninstitutionalized population with private health insurance is from the U.S. Census Bureau’s 2022 American Community Survey.

Why We Are Mentioning This

gorodenkoff / iStock via Getty Images

In America, health insurance and access to healthcare remain primary concerns, especially when it comes to political debates. With almost one in 10 uninsured Americans, many cannot afford healthcare and worry astronomical healthcare bills will be their downfall. However, many of us do not look beyond affordability to consider whether the hospitals they so greatly need are actually safe. As American citizens, we should all be aware of which states pose the greatest risk when it comes to medical error.

49. California

Thomas Northcut / DigitalVision via Getty Images
  • Deaths from medical and surgical care complications, 2018-2021: 0.70 per 100,000 people
  • Total deaths of these complications, 2018-2021: 1,283 or 6.0% of all deaths — 3rd highest
  • Medical malpractice payouts, 2010-2022: $7.52 per capita (nat’l avg: $14.38)
  • Avg. medical malpractice payout, 2010-2022: $45,786 for 82,674 cases (nat’l avg payout: $77,552)
  • Median annual salary for healthcare practitioners, 2022: $105,710
  • Population with private health insurance, 2022: 63.8%

48. Hawaii

SlocumMedia / iStock via Getty Images
  • Deaths from medical and surgical care complications, 2018-2021: 1.12 per 100,000 people
  • Total deaths of these complications, 2018-2021: 83 or 0.4% of all deaths — 7th lowest
  • Medical malpractice payouts, 2010-2022: $11.99 per capita (nat’l avg: $14.38)
  • Avg. medical malpractice payout, 2010-2022: $178,208 for 1,239 cases (nat’l avg payout: $77,552)
  • Median annual salary for healthcare practitioners, 2022: $99,540
  • Population with private health insurance, 2022: 75.0%

47. Massachusetts

DenisTangneyJr / E+ via Getty Images
  • Deaths from medical and surgical care complications, 2018-2021: 1.13 per 100,000 people
  • Total deaths of these complications, 2018-2021: 392 or 1.8% of all deaths — 18th highest
  • Medical malpractice payouts, 2010-2022: $28.22 per capita (nat’l avg: $14.38)
  • Avg. medical malpractice payout, 2010-2022: $193,409 for 12,920 cases (nat’l avg payout: $77,552)
  • Median annual salary for healthcare practitioners, 2022: $85,320
  • Population with private health insurance, 2022: 73.4%

46. New York

Alphotographic / iStock Unreleased via Getty Images
  • Deaths from medical and surgical care complications, 2018-2021: 1.16 per 100,000 people
  • Total deaths of these complications, 2018-2021: 1,169 or 5.5% of all deaths — 4th highest
  • Medical malpractice payouts, 2010-2022: $40.79 per capita (nat’l avg: $14.38)
  • Avg. medical malpractice payout, 2010-2022: $299,023 for 34,821 cases (nat’l avg payout: $77,552)
  • Median annual salary for healthcare practitioners, 2022: $90,600
  • Population with private health insurance, 2022: 65.4%

45. Wisconsin

filo / Getty Images
  • Deaths from medical and surgical care complications, 2018-2021: 1.17 per 100,000 people
  • Total deaths of these complications, 2018-2021: 356 or 1.7% of all deaths — 21st highest
  • Medical malpractice payouts, 2010-2022: $4.83 per capita (nat’l avg: $14.38)
  • Avg. medical malpractice payout, 2010-2022: $38,354 for 9,483 cases (nat’l avg payout: $77,552)
  • Median annual salary for healthcare practitioners, 2022: $77,320
  • Population with private health insurance, 2022: 73.3%

44. Delaware

phittavas / Getty Images
  • Deaths from medical and surgical care complications, 2018-2021: 1.18 per 100,000 people
  • Total deaths of these complications, 2018-2021: 65 or 0.3% of all deaths — 4th lowest
  • Medical malpractice payouts, 2010-2022: $13.53 per capita (nat’l avg: $14.38)
  • Avg. medical malpractice payout, 2010-2022: $58,914 for 2,846 cases (nat’l avg payout: $77,552)
  • Median annual salary for healthcare practitioners, 2022: $79,310
  • Population with private health insurance, 2022: 71.8%

43. Louisiana

Mario Tama / Getty Images News via Getty Images
  • Deaths from medical and surgical care complications, 2018-2021: 1.19 per 100,000 people
  • Total deaths of these complications, 2018-2021: 265 or 1.2% of all deaths — 19th lowest
  • Medical malpractice payouts, 2010-2022: $15.80 per capita (nat’l avg: $14.38)
  • Avg. medical malpractice payout, 2010-2022: $44,178 for 21,529 cases (nat’l avg payout: $77,552)
  • Median annual salary for healthcare practitioners, 2022: $63,610
  • Population with private health insurance, 2022: 58.1%

42. Maryland

Pornpak Khunatorn / iStock via Getty Images
  • Deaths from medical and surgical care complications, 2018-2021: 1.22 per 100,000 people
  • Total deaths of these complications, 2018-2021: 356 or 1.7% of all deaths — 21st highest
  • Medical malpractice payouts, 2010-2022: $19.42 per capita (nat’l avg: $14.38)
  • Avg. medical malpractice payout, 2010-2022: $109,242 for 13,870 cases (nat’l avg payout: $77,552)
  • Median annual salary for healthcare practitioners, 2022: $83,500
  • Population with private health insurance, 2022: 72.8%

41. Illinois

Maryland hospital emergency | Doctor and nurse running in corridor from behind
rubberball / Rubberball Productions via Getty Images
  • Deaths from medical and surgical care complications, 2018-2021: 1.22 per 100,000 people
  • Total deaths of these complications, 2018-2021: 738 or 3.5% of all deaths — 8th highest
  • Medical malpractice payouts, 2010-2022: $21.17 per capita (nat’l avg: $14.38)
  • Avg. medical malpractice payout, 2010-2022: $146,213 for 24,072 cases (nat’l avg payout: $77,552)
  • Median annual salary for healthcare practitioners, 2022: $76,650
  • Population with private health insurance, 2022: 69.3%

40. New Jersey

Image Source / DigitalVision via Getty Images
  • Deaths from medical and surgical care complications, 2018-2021: 1.23 per 100,000 people
  • Total deaths of these complications, 2018-2021: 536 or 2.5% of all deaths — 13th highest
  • Medical malpractice payouts, 2010-2022: $31.45 per capita (nat’l avg: $14.38)
  • Avg. medical malpractice payout, 2010-2022: $172,158 for 21,270 cases (nat’l avg payout: $77,552)
  • Median annual salary for healthcare practitioners, 2022: $92,370
  • Population with private health insurance, 2022: 71.2%

39. Colorado

Michael Ciaglo / Getty Images News via Getty Images
  • Deaths from medical and surgical care complications, 2018-2021: 1.25 per 100,000 people
  • Total deaths of these complications, 2018-2021: 318 or 1.5% of all deaths — 23rd lowest
  • Medical malpractice payouts, 2010-2022: $8.67 per capita (nat’l avg: $14.38)
  • Avg. medical malpractice payout, 2010-2022: $30,817 for 20,106 cases (nat’l avg payout: $77,552)
  • Median annual salary for healthcare practitioners, 2022: $82,000
  • Population with private health insurance, 2022: 70.5%

38. Michigan

saginawfuture / Flickr
  • Deaths from medical and surgical care complications, 2018-2021: 1.25 per 100,000 people
  • Total deaths of these complications, 2018-2021: 632 or 3.0% of all deaths — 9th highest
  • Medical malpractice payouts, 2010-2022: $8.40 per capita (nat’l avg: $14.38)
  • Avg. medical malpractice payout, 2010-2022: $39,622 for 27,442 cases (nat’l avg payout: $77,552)
  • Median annual salary for healthcare practitioners, 2022: $76,240
  • Population with private health insurance, 2022: 70.4%

37. Connecticut

John Moore / Getty Images News via Getty Images
  • Deaths from medical and surgical care complications, 2018-2021: 1.25 per 100,000 people
  • Total deaths of these complications, 2018-2021: 237 or 1.1% of all deaths — 17th lowest
  • Medical malpractice payouts, 2010-2022: $24.90 per capita (nat’l avg: $14.38)
  • Avg. medical malpractice payout, 2010-2022: $202,225 for 5,749 cases (nat’l avg payout: $77,552)
  • Median annual salary for healthcare practitioners, 2022: $84,240
  • Population with private health insurance, 2022: 68.9%

36. Virginia

bsabarnowl / Flickr
  • Deaths from medical and surgical care complications, 2018-2021: 1.27 per 100,000 people
  • Total deaths of these complications, 2018-2021: 517 or 2.4% of all deaths — 15th highest
  • Medical malpractice payouts, 2010-2022: $9.62 per capita (nat’l avg: $14.38)
  • Avg. medical malpractice payout, 2010-2022: $50,701 for 20,711 cases (nat’l avg payout: $77,552)
  • Median annual salary for healthcare practitioners, 2022: $76,900
  • Population with private health insurance, 2022: 73.0%

35. Nebraska

okskaz / iStock via Getty Images
  • Deaths from medical and surgical care complications, 2018-2021: 1.30 per 100,000 people
  • Total deaths of these complications, 2018-2021: 126 or 0.6% of all deaths — 11th lowest
  • Medical malpractice payouts, 2010-2022: $8.63 per capita (nat’l avg: $14.38)
  • Avg. medical malpractice payout, 2010-2022: $35,979 for 5,932 cases (nat’l avg payout: $77,552)
  • Median annual salary for healthcare practitioners, 2022: $67,520
  • Population with private health insurance, 2022: 73.6%

34. Georgia

drserg / iStock Editorial via Getty Images
  • Deaths from medical and surgical care complications, 2018-2021: 1.32 per 100,000 people
  • Total deaths of these complications, 2018-2021: 612 or 2.9% of all deaths — 10th highest
  • Medical malpractice payouts, 2010-2022: $14.03 per capita (nat’l avg: $14.38)
  • Avg. medical malpractice payout, 2010-2022: $139,500 for 13,473 cases (nat’l avg payout: $77,552)
  • Median annual salary for healthcare practitioners, 2022: $75,050
  • Population with private health insurance, 2022: 66.6%

33. Missouri

kansasscanner / Flickr
  • Deaths from medical and surgical care complications, 2018-2021: 1.33 per 100,000 people
  • Total deaths of these complications, 2018-2021: 399 or 1.9% of all deaths — 17th highest
  • Medical malpractice payouts, 2010-2022: $12.48 per capita (nat’l avg: $14.38)
  • Avg. medical malpractice payout, 2010-2022: $61,904 for 15,961 cases (nat’l avg payout: $77,552)
  • Median annual salary for healthcare practitioners, 2022: $63,870
  • Population with private health insurance, 2022: 68.8%

32. Arizona

PhilipGua / iStock via Getty Images
  • Deaths from medical and surgical care complications, 2018-2021: 1.34 per 100,000 people
  • Total deaths of these complications, 2018-2021: 500 or 2.3% of all deaths — 16th highest
  • Medical malpractice payouts, 2010-2022: $12.34 per capita (nat’l avg: $14.38)
  • Avg. medical malpractice payout, 2010-2022: $55,409 for 20,027 cases (nat’l avg payout: $77,552)
  • Median annual salary for healthcare practitioners, 2022: $79,390
  • Population with private health insurance, 2022: 63.9%

31. Rhode Island

Natali_Mis / Getty Images
  • Deaths from medical and surgical care complications, 2018-2021: 1.38 per 100,000 people
  • Total deaths of these complications, 2018-2021: 75 or 0.4% of all deaths — 5th lowest
  • Medical malpractice payouts, 2010-2022: $28.18 per capita (nat’l avg: $14.38)
  • Avg. medical malpractice payout, 2010-2022: $179,926 for 2,169 cases (nat’l avg payout: $77,552)
  • Median annual salary for healthcare practitioners, 2022: $82,330
  • Population with private health insurance, 2022: 70.5%

30. Florida

gpointstudio / iStock via Getty Images
  • Deaths from medical and surgical care complications, 2018-2021: 1.38 per 100,000 people
  • Total deaths of these complications, 2018-2021: 1,682 or 7.9% of all deaths — 2nd highest
  • Medical malpractice payouts, 2010-2022: $15.98 per capita (nat’l avg: $14.38)
  • Avg. medical malpractice payout, 2010-2022: $87,496 for 48,732 cases (nat’l avg payout: $77,552)
  • Median annual salary for healthcare practitioners, 2022: $72,780
  • Population with private health insurance, 2022: 63.6%

29. Oklahoma

PeopleImages / Getty Images
  • Deaths from medical and surgical care complications, 2018-2021: 1.40 per 100,000 people
  • Total deaths of these complications, 2018-2021: 262 or 1.2% of all deaths — 18th lowest
  • Medical malpractice payouts, 2010-2022: $12.30 per capita (nat’l avg: $14.38)
  • Avg. medical malpractice payout, 2010-2022: $38,831 for 16,073 cases (nat’l avg payout: $77,552)
  • Median annual salary for healthcare practitioners, 2022: $63,580
  • Population with private health insurance, 2022: 61.7%

28. Alabama

Jens_Lambert_Photography / iStock via Getty Images
  • Deaths from medical and surgical care complications, 2018-2021: 1.40 per 100,000 people
  • Total deaths of these complications, 2018-2021: 339 or 1.6% of all deaths — 25th highest
  • Medical malpractice payouts, 2010-2022: $7.63 per capita (nat’l avg: $14.38)
  • Avg. medical malpractice payout, 2010-2022: $30,698 for 15,809 cases (nat’l avg payout: $77,552)
  • Median annual salary for healthcare practitioners, 2022: $59,810
  • Population with private health insurance, 2022: 67.0%

27. New Hampshire

Chinnapong / iStock via Getty Images
  • Deaths from medical and surgical care complications, 2018-2021: 1.42 per 100,000 people
  • Total deaths of these complications, 2018-2021: 104 or 0.5% of all deaths — 9th lowest
  • Medical malpractice payouts, 2010-2022: $21.10 per capita (nat’l avg: $14.38)
  • Avg. medical malpractice payout, 2010-2022: $129,193 for 2,864 cases (nat’l avg payout: $77,552)
  • Median annual salary for healthcare practitioners, 2022: $80,000
  • Population with private health insurance, 2022: 75.6%

26. Montana

fokusgood / iStock via Getty Images
  • Deaths from medical and surgical care complications, 2018-2021: 1.42 per 100,000 people
  • Total deaths of these complications, 2018-2021: 86 or 0.4% of all deaths — 8th lowest
  • Medical malpractice payouts, 2010-2022: $13.33 per capita (nat’l avg: $14.38)
  • Avg. medical malpractice payout, 2010-2022: $87,427 for 2,075 cases (nat’l avg payout: $77,552)
  • Median annual salary for healthcare practitioners, 2022: $75,380
  • Population with private health insurance, 2022: 65.2%

25. Minnesota

JodiJacobson / iStock via Getty Images
  • Deaths from medical and surgical care complications, 2018-2021: 1.42 per 100,000 people
  • Total deaths of these complications, 2018-2021: 390 or 1.8% of all deaths — 19th highest
  • Medical malpractice payouts, 2010-2022: $7.53 per capita (nat’l avg: $14.38)
  • Avg. medical malpractice payout, 2010-2022: $50,058 for 10,812 cases (nat’l avg payout: $77,552)
  • Median annual salary for healthcare practitioners, 2022: $82,260
  • Population with private health insurance, 2022: 74.7%

24. Alaska

lippyjr / iStock Editorial via Getty Images
  • Deaths from medical and surgical care complications, 2018-2021: 1.43 per 100,000 people
  • Total deaths of these complications, 2018-2021: 37 or 0.2% of all deaths — the lowest
  • Medical malpractice payouts, 2010-2022: $19.10 per capita (nat’l avg: $14.38)
  • Avg. medical malpractice payout, 2010-2022: $84,324 for 2,160 cases (nat’l avg payout: $77,552)
  • Median annual salary for healthcare practitioners, 2022: $94,680
  • Population with private health insurance, 2022: 66.4%

23. Pennsylvania

qingwa / iStock via Getty Images
  • Deaths from medical and surgical care complications, 2018-2021: 1.43 per 100,000 people
  • Total deaths of these complications, 2018-2021: 998 or 4.7% of all deaths — 5th highest
  • Medical malpractice payouts, 2010-2022: $30.87 per capita (nat’l avg: $14.38)
  • Avg. medical malpractice payout, 2010-2022: $166,985 for 30,829 cases (nat’l avg payout: $77,552)
  • Median annual salary for healthcare practitioners, 2022: $74,120
  • Population with private health insurance, 2022: 71.2%

22. Utah

MSRPhoto / iStock via Getty Images
  • Deaths from medical and surgical care complications, 2018-2021: 1.45 per 100,000 people
  • Total deaths of these complications, 2018-2021: 166 or 0.8% of all deaths — 13th lowest
  • Medical malpractice payouts, 2010-2022: $9.17 per capita (nat’l avg: $14.38)
  • Avg. medical malpractice payout, 2010-2022: $58,017 for 6,284 cases (nat’l avg payout: $77,552)
  • Median annual salary for healthcare practitioners, 2022: $72,890
  • Population with private health insurance, 2022: 78.4%

21. South Carolina

s99 / iStock Editorial via Getty Images
  • Deaths from medical and surgical care complications, 2018-2021: 1.46 per 100,000 people
  • Total deaths of these complications, 2018-2021: 389 or 1.8% of all deaths — 20th highest
  • Medical malpractice payouts, 2010-2022: $10.43 per capita (nat’l avg: $14.38)
  • Avg. medical malpractice payout, 2010-2022: $64,352 for 10,433 cases (nat’l avg payout: $77,552)
  • Median annual salary for healthcare practitioners, 2022: $66,420
  • Population with private health insurance, 2022: 66.9%

20. North Carolina

J. Michael Jones / iStock Editorial via Getty Images
  • Deaths from medical and surgical care complications, 2018-2021: 1.48 per 100,000 people
  • Total deaths of these complications, 2018-2021: 748 or 3.5% of all deaths — 7th highest
  • Medical malpractice payouts, 2010-2022: $5.82 per capita (nat’l avg: $14.38)
  • Avg. medical malpractice payout, 2010-2022: $49,898 for 15,368 cases (nat’l avg payout: $77,552)
  • Median annual salary for healthcare practitioners, 2022: $66,650
  • Population with private health insurance, 2022: 67.8%

19. Texas

aldomurillo / E+ via Getty Images
  • Deaths from medical and surgical care complications, 2018-2021: 1.52 per 100,000 people
  • Total deaths of these complications, 2018-2021: 1,784 or 8.4% of all deaths — the highest
  • Medical malpractice payouts, 2010-2022: $4.42 per capita (nat’l avg: $14.38)
  • Avg. medical malpractice payout, 2010-2022: $22,829 for 69,737 cases (nat’l avg payout: $77,552)
  • Median annual salary for healthcare practitioners, 2022: $74,600
  • Population with private health insurance, 2022: 62.8%

18. Kentucky

Ivelin Denev / iStock via Getty Images
  • Deaths from medical and surgical care complications, 2018-2021: 1.54 per 100,000 people
  • Total deaths of these complications, 2018-2021: 339 or 1.6% of all deaths — 25th highest
  • Medical malpractice payouts, 2010-2022: $11.00 per capita (nat’l avg: $14.38)
  • Avg. medical malpractice payout, 2010-2022: $52,301 for 12,138 cases (nat’l avg payout: $77,552)
  • Median annual salary for healthcare practitioners, 2022: $64,540
  • Population with private health insurance, 2022: 62.8%

17. Nevada

LPETTET / iStock Unreleased via Getty Images
  • Deaths from medical and surgical care complications, 2018-2021: 1.56 per 100,000 people
  • Total deaths of these complications, 2018-2021: 226 or 1.1% of all deaths — 16th lowest
  • Medical malpractice payouts, 2010-2022: $9.12 per capita (nat’l avg: $14.38)
  • Avg. medical malpractice payout, 2010-2022: $49,346 for 7,037 cases (nat’l avg payout: $77,552)
  • Median annual salary for healthcare practitioners, 2022: $82,050
  • Population with private health insurance, 2022: 63.4%

16. Maine

Nevada hospital emergency | Empty hospital emergency room
DreamPictures / Stockbyte via Getty Images
  • Deaths from medical and surgical care complications, 2018-2021: 1.56 per 100,000 people
  • Total deaths of these complications, 2018-2021: 124 or 0.6% of all deaths — 10th lowest
  • Medical malpractice payouts, 2010-2022: $16.42 per capita (nat’l avg: $14.38)
  • Avg. medical malpractice payout, 2010-2022: $65,269 for 4,390 cases (nat’l avg payout: $77,552)
  • Median annual salary for healthcare practitioners, 2022: $76,400
  • Population with private health insurance, 2022: 68.7%

15. Ohio

XiXinXing / iStock via Getty Images
  • Deaths from medical and surgical care complications, 2018-2021: 1.63 per 100,000 people
  • Total deaths of these complications, 2018-2021: 964 or 4.5% of all deaths — 6th highest
  • Medical malpractice payouts, 2010-2022: $8.62 per capita (nat’l avg: $14.38)
  • Avg. medical malpractice payout, 2010-2022: $37,050 for 35,222 cases (nat’l avg payout: $77,552)
  • Median annual salary for healthcare practitioners, 2022: $69,960
  • Population with private health insurance, 2022: 68.1%

14. Washington

FatCamera / E+ via Getty Images
  • Deaths from medical and surgical care complications, 2018-2021: 1.63 per 100,000 people
  • Total deaths of these complications, 2018-2021: 574 or 2.7% of all deaths — 12th highest
  • Medical malpractice payouts, 2010-2022: $10.89 per capita (nat’l avg: $14.38)
  • Avg. medical malpractice payout, 2010-2022: $44,590 for 23,155 cases (nat’l avg payout: $77,552)
  • Median annual salary for healthcare practitioners, 2022: $96,530
  • Population with private health insurance, 2022: 70.8%

13. Oregon

Strekoza2 / iStock Editorial via Getty Images
  • Deaths from medical and surgical care complications, 2018-2021: 1.63 per 100,000 people
  • Total deaths of these complications, 2018-2021: 350 or 1.6% of all deaths — 24th highest
  • Medical malpractice payouts, 2010-2022: $13.89 per capita (nat’l avg: $14.38)
  • Avg. medical malpractice payout, 2010-2022: $50,468 for 14,563 cases (nat’l avg payout: $77,552)
  • Median annual salary for healthcare practitioners, 2022: $100,480
  • Population with private health insurance, 2022: 67.1%

12. Iowa

gorodenkoff / iStock via Getty Images
  • Deaths from medical and surgical care complications, 2018-2021: 1.63 per 100,000 people
  • Total deaths of these complications, 2018-2021: 267 or 1.3% of all deaths — 20th lowest
  • Medical malpractice payouts, 2010-2022: $10.34 per capita (nat’l avg: $14.38)
  • Avg. medical malpractice payout, 2010-2022: $61,806 for 6,811 cases (nat’l avg payout: $77,552)
  • Median annual salary for healthcare practitioners, 2022: $64,070
  • Population with private health insurance, 2022: 73.3%

11. Indiana

Chinnapong / iStock via Getty Images
  • Deaths from medical and surgical care complications, 2018-2021: 1.66 per 100,000 people
  • Total deaths of these complications, 2018-2021: 532 or 2.5% of all deaths — 14th highest
  • Medical malpractice payouts, 2010-2022: $11.25 per capita (nat’l avg: $14.38)
  • Avg. medical malpractice payout, 2010-2022: $60,077 for 16,200 cases (nat’l avg payout: $77,552)
  • Median annual salary for healthcare practitioners, 2022: $66,760
  • Population with private health insurance, 2022: 68.4%

10. North Dakota

GlobalStock / iStock via Getty Images
  • Deaths from medical and surgical care complications, 2018-2021: 1.74 per 100,000 people
  • Total deaths of these complications, 2018-2021: 63 or 0.3% of all deaths — 3rd lowest
  • Medical malpractice payouts, 2010-2022: $4.45 per capita (nat’l avg: $14.38)
  • Avg. medical malpractice payout, 2010-2022: $19,295 for 2,227 cases (nat’l avg payout: $77,552)
  • Median annual salary for healthcare practitioners, 2022: $65,210
  • Population with private health insurance, 2022: 78.4%

9. Tennessee

thomasandreas / Getty Images
  • Deaths from medical and surgical care complications, 2018-2021: 1.76 per 100,000 people
  • Total deaths of these complications, 2018-2021: 591 or 2.8% of all deaths — 11th highest
  • Medical malpractice payouts, 2010-2022: $8.10 per capita (nat’l avg: $14.38)
  • Avg. medical malpractice payout, 2010-2022: $42,624 for 16,479 cases (nat’l avg payout: $77,552)
  • Median annual salary for healthcare practitioners, 2022: $63,700
  • Population with private health insurance, 2022: 67.2%

8. Idaho

soldiersmediacenter / Flickr
  • Deaths from medical and surgical care complications, 2018-2021: 1.78 per 100,000 people
  • Total deaths of these complications, 2018-2021: 143 or 0.7% of all deaths — 12th lowest
  • Medical malpractice payouts, 2010-2022: $8.69 per capita (nat’l avg: $14.38)
  • Avg. medical malpractice payout, 2010-2022: $82,120 for 2,359 cases (nat’l avg payout: $77,552)
  • Median annual salary for healthcare practitioners, 2022: $74,630
  • Population with private health insurance, 2022: 68.3%

7. Vermont

KTM_2016 / iStock via Getty Images
  • Deaths from medical and surgical care complications, 2018-2021: 1.78 per 100,000 people
  • Total deaths of these complications, 2018-2021: 59 or 0.3% of all deaths — 2nd lowest
  • Medical malpractice payouts, 2010-2022: $9.42 per capita (nat’l avg: $14.38)
  • Avg. medical malpractice payout, 2010-2022: $35,786 for 2,157 cases (nat’l avg payout: $77,552)
  • Median annual salary for healthcare practitioners, 2022: $77,230
  • Population with private health insurance, 2022: 70.0%

6. West Virginia

SDI Productions / E+ via Getty Images
  • Deaths from medical and surgical care complications, 2018-2021: 1.81 per 100,000 people
  • Total deaths of these complications, 2018-2021: 184 or 0.9% of all deaths — 14th lowest
  • Medical malpractice payouts, 2010-2022: $21.26 per capita (nat’l avg: $14.38)
  • Avg. medical malpractice payout, 2010-2022: $82,852 for 6,087 cases (nat’l avg payout: $77,552)
  • Median annual salary for healthcare practitioners, 2022: $61,350
  • Population with private health insurance, 2022: 61.8%

5. Kansas

shapecharge / E+ via Getty Images
  • Deaths from medical and surgical care complications, 2018-2021: 1.94 per 100,000 people
  • Total deaths of these complications, 2018-2021: 273 or 1.3% of all deaths — 21st lowest
  • Medical malpractice payouts, 2010-2022: $11.60 per capita (nat’l avg: $14.38)
  • Avg. medical malpractice payout, 2010-2022: $47,938 for 9,146 cases (nat’l avg payout: $77,552)
  • Median annual salary for healthcare practitioners, 2022: $64,570
  • Population with private health insurance, 2022: 73.7%

4. New Mexico

raclro / Getty Images
  • Deaths from medical and surgical care complications, 2018-2021: 1.96 per 100,000 people
  • Total deaths of these complications, 2018-2021: 206 or 1.0% of all deaths — 15th lowest
  • Medical malpractice payouts, 2010-2022: $21.32 per capita (nat’l avg: $14.38)
  • Avg. medical malpractice payout, 2010-2022: $118,078 for 4,917 cases (nat’l avg payout: $77,552)
  • Median annual salary for healthcare practitioners, 2022: $78,560
  • Population with private health insurance, 2022: 54.4%

3. Arkansas

Huntstock / DisabilityImages via Getty Images
  • Deaths from medical and surgical care complications, 2018-2021: 2.09 per 100,000 people
  • Total deaths of these complications, 2018-2021: 311 or 1.5% of all deaths — 22nd lowest
  • Medical malpractice payouts, 2010-2022: $7.84 per capita (nat’l avg: $14.38)
  • Avg. medical malpractice payout, 2010-2022: $31,206 for 9,761 cases (nat’l avg payout: $77,552)
  • Median annual salary for healthcare practitioners, 2022: $60,660
  • Population with private health insurance, 2022: 60.0%

2. Mississippi

nikkormat42 / iStock via Getty Images
  • Deaths from medical and surgical care complications, 2018-2021: 2.58 per 100,000 people
  • Total deaths of these complications, 2018-2021: 352 or 1.6% of all deaths — 23rd highest
  • Medical malpractice payouts, 2010-2022: $7.67 per capita (nat’l avg: $14.38)
  • Avg. medical malpractice payout, 2010-2022: $39,856 for 7,448 cases (nat’l avg payout: $77,552)
  • Median annual salary for healthcare practitioners, 2022: $60,190
  • Population with private health insurance, 2022: 61.5%

1. Wyoming

DragonImages / Getty Images
  • Deaths from medical and surgical care complications, 2018-2021: 2.61 per 100,000 people
  • Total deaths of these complications, 2018-2021: 79 or 0.4% of all deaths — 6th lowest
  • Medical malpractice payouts, 2010-2022: $10.89 per capita (nat’l avg: $14.38)
  • Avg. medical malpractice payout, 2010-2022: $36,728 for 2,231 cases (nat’l avg payout: $77,552)
  • Median annual salary for healthcare practitioners, 2022: $76,920
  • Population with private health insurance, 2022: 71.0%

Thank you for reading! Have some feedback for us?
Contact the 24/7 Wall St. editorial team.