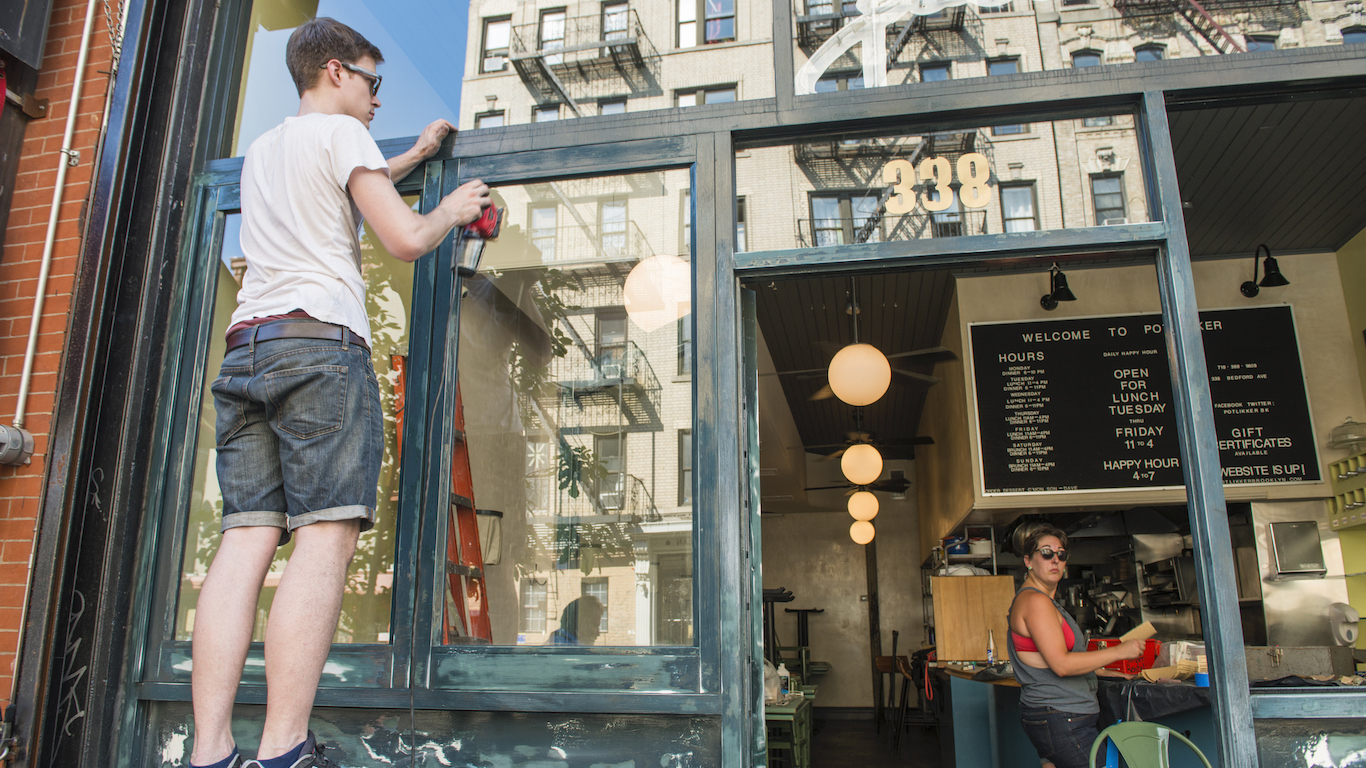
[cnxvideo id=”506829″ placement=”ros”]Gentrification of city neighborhoods is nothing particularly new. The process has been going on, more or less, for 50 years, as young homebuyers (once called yuppies, now called millennials) descend on a (usually) poor or working-class neighborhood en masse, driving home prices up. It’s the reverse of city residents’ flight to the suburbs in the 1950s and ’60s, and it is just as potent (and controversial) a force as its ever been.
The low interest rates of the past nearly 10 years have certainly helped make housing in older city neighborhoods even more affordable. And while interest rates are still historically low, young home buyers are often shopping for a house right on the edge of what they can afford, and for those that qualify for an FHA loan, President Trump’s cancellation of an Obama administration order that cut the insurance premium on FHA-backed loans added a few more bucks to their monthly payments. Not only are the monthly payments higher, but the increase could mean that some buyers will no longer qualify for the low-down payment FHA loans.
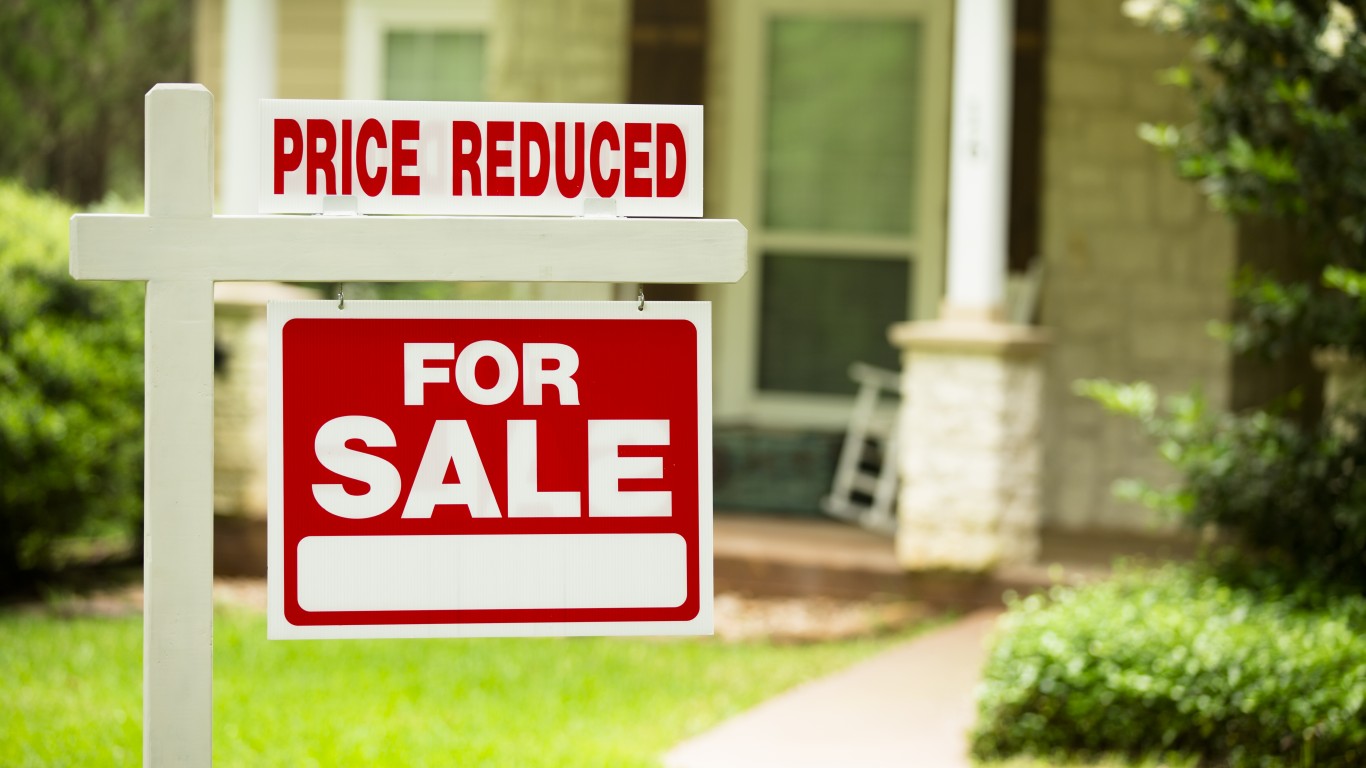
For the U.S. cities currently in the gentrification process, it could mean that the rapidly rising home prices will soften a bit, or it could mean that prices will plummet. Urban economics professor David Fiorenza told Realtor.com:
It’s a trade-off. Whole communities can be displaced. But people [also] can benefit from it, because home values and business values go up … and eventually, there will be more jobs and better schools.
[nativounit]
Researchers at Realtor.com looked at Census data to determine the city neighborhoods that have seen the biggest gain in home prices between 2000 and 2015. These 10 cities are gentrifying the fastest and ranked them on the basis of achieved gentrification potential.
- Charleston, South Carolina
> Price change, 2000–2015: up 77.5%, from $152,100 to $270,000
> Achieved potential: 62.5% - Asheville, North Carolina
> Price change: up 88.0%, from $125,000 to $235,000
> Achieved potential: 50.0% - Washington, D.C.
> Price change: up 228.3%, from $159,900 to $525,000
> Achieved potential: 39.4% - Portland, Oregon
> Price change: up 129.7%, from $148,000 to $340,000
> Achieved potential: 33.9% - Denver, Colorado
> Price change: up 95.1%, from $162,000 to $316,000
> Achieved potential: 32.8% - Nashville, Tennessee
> Price change: up 73.1%, from $118,400 to $205,000
> Achieved potential: 27.6% - Sacramento, California
> Price change: up 100%, from $127,500 to $255,000
> Achieved potential: 26.5% - Jersey City, New Jersey
> Price change: up 167.6%, from $142,000 to $380,000
> Achieved potential: 24.5% - Long Beach, California
> Price change: up 154.2%, from $179,000 to $455,000
> Achieved potential: 22.4% - Austin, Texas
> Price change: up 96.1%, from $152,600 to $299,300
> Achieved potential: 22.2%
See the Realtor.com website for methodology and more details on the housing market in these cities.
[wallst_email_signup]