Home prices rose 6.6% in May compared with the same month a year ago. Compared with April 2017 sales, prices rose 1.7%. Research firm CoreLogic expects June housing prices to rise another 5.3% year over year and by 0.9% month over month.
Only the states of Washington and Utah posted double-digit year-over-year home price growth in May, up 12.6% and 10.4%, respectively. Home price values fell in three states: Wyoming (−2.2%), West Virginia (−1.2%) and Alaska (−0.3%). The full CoreLogic listing of home price changes is included below.
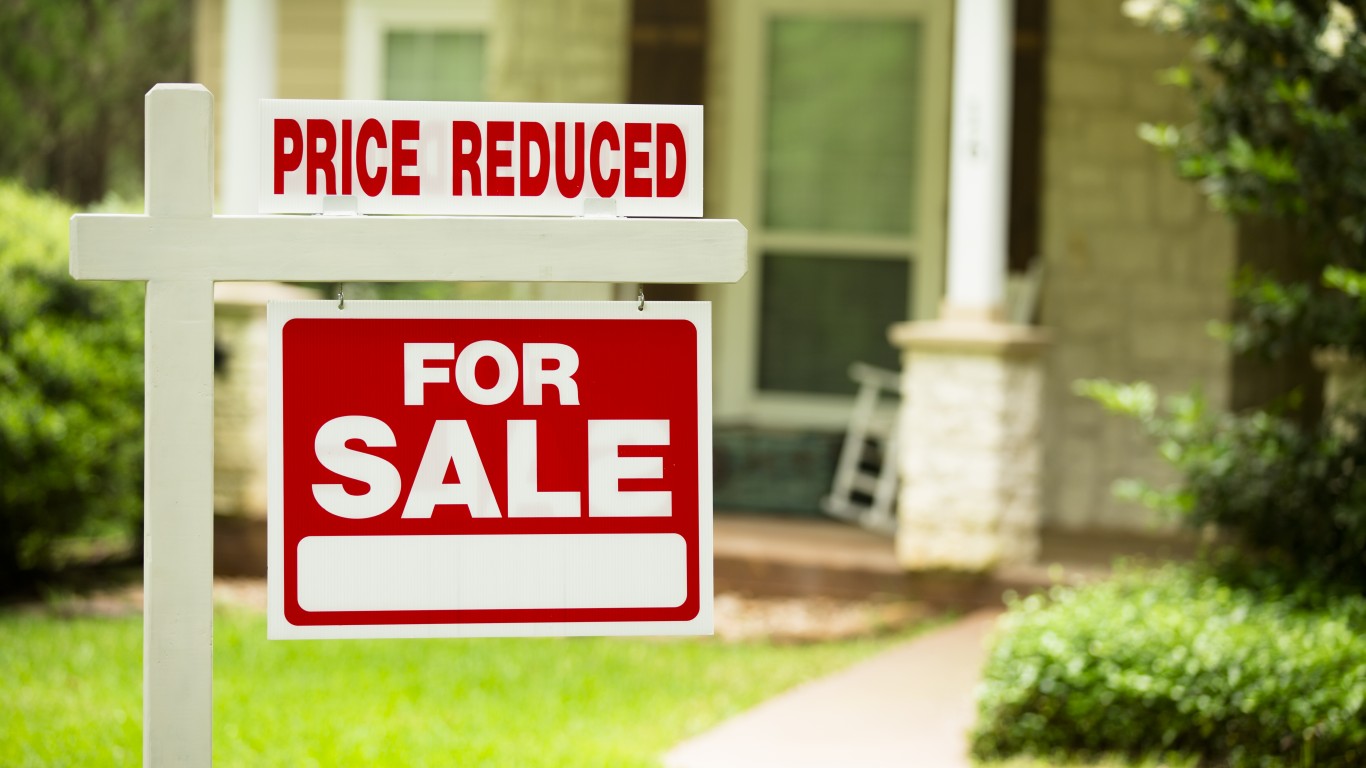
The good news for homebuyers is that monthly increases have slowed since the beginning of the year. The not-so-good news is that the even the slower growth far outpaces income growth, making it harder for first-time buyers (especially) to get into the market.
CoreLogic’s CEO Frank Martell put the current market into a broader context:
For current homeowners, the strong run-up in prices has boosted home equity and, in some cases, spending. For renters and potential first-time buyers, it is not such a pretty picture. With price appreciation and rental inflation outstripping income growth, affordability is destined to become a bigger issue in most markets.
Consumer spending is driven by how flush consumers feel, and homeowners who are seeing home prices rise every month should be feeling pretty flush with cash right now. The variation among CoreLogic’s top 10 metro areas is between a May rise of 9.2% in Denver and 2.2% in Houston.
Here’s CoreLogic’s listing of year-over-year home price index increases by state for May:
| State | Price % Increase | Rank |
| Washington | 12.60% | 1 |
| Utah | 10.40% | 2 |
| Colorado | 9.70% | 3 |
| Oregon | 9.00% | 4 |
| Idaho | 8.40% | 5 |
| New York | 7.50% | 6 |
| Nevada | 7.30% | 7 |
| Michigan | 6.80% | 8 |
| Massachusetts | 6.50% | 9 |
| Florida | 6.40% | 10 |
| Hawaii | 6.40% | 10 |
| Arizona | 6.10% | 12 |
| New Hampshire | 6.00% | 13 |
| Georgia | 5.90% | 14 |
| California | 5.80% | 15 |
| Alabama | 5.60% | 16 |
| Minnesota | 5.50% | 17 |
| North Carolina | 5.50% | 17 |
| Wisconsin | 5.50% | 17 |
| Nebraska | 5.20% | 20 |
| Arkansas | 5.10% | 21 |
| Indiana | 4.90% | 22 |
| Montana | 4.90% | 22 |
| Texas | 4.90% | 22 |
| Missouri | 4.70% | 25 |
| South Carolina | 4.60% | 26 |
| District of Columbia | 4.20% | 27 |
| Rhode Island | 4.20% | 27 |
| Tennessee | 4.20% | 27 |
| Illinois | 4.00% | 30 |
| Louisiana | 4.00% | 30 |
| New Mexico | 3.80% | 32 |
| Pennsylvania | 3.70% | 33 |
| Maryland | 3.60% | 34 |
| Mississippi | 3.60% | 34 |
| Iowa | 3.40% | 36 |
| North Dakota | 2.80% | 37 |
| Kansas | 2.70% | 38 |
| Kentucky | 2.70% | 38 |
| Vermont | 2.60% | 40 |
| New Jersey | 2.40% | 41 |
| Virginia | 2.40% | 41 |
| Maine | 2.10% | 43 |
| Ohio | 1.80% | 44 |
| Oklahoma | 1.70% | 45 |
| Connecticut | 1.00% | 46 |
| South Dakota | 0.80% | 47 |
| Delaware | 0.40% | 48 |
| Alaska | -0.30% | 49 |
| West Virginia | -1.20% | 50 |
| Wyoming | -2.20% | 51 |
Are You Still Paying With a Debit Card?
The average American spends $17,274 on debit cards a year, and it’s a HUGE mistake. First, debit cards don’t have the same fraud protections as credit cards. Once your money is gone, it’s gone. But more importantly you can actually get something back from this spending every time you swipe.
Issuers are handing out wild bonuses right now. With some you can earn up to 5% back on every purchase. That’s like getting a 5% discount on everything you buy!
Our top pick is kind of hard to imagine. Not only does it pay up to 5% back, it also includes a $200 cash back reward in the first six months, a 0% intro APR, and…. $0 annual fee. It’s quite literally free money for any one that uses a card regularly. Click here to learn more!
Flywheel Publishing has partnered with CardRatings to provide coverage of credit card products. Flywheel Publishing and CardRatings may receive a commission from card issuers.
Thank you for reading! Have some feedback for us?
Contact the 24/7 Wall St. editorial team.
Latest from 24/7


Our expert who first called NVIDIA in 2009 is predicting 2025 will see a historic AI breakthrough.
You can follow him investing $500,000 of his own money on our top AI stocks for free.