
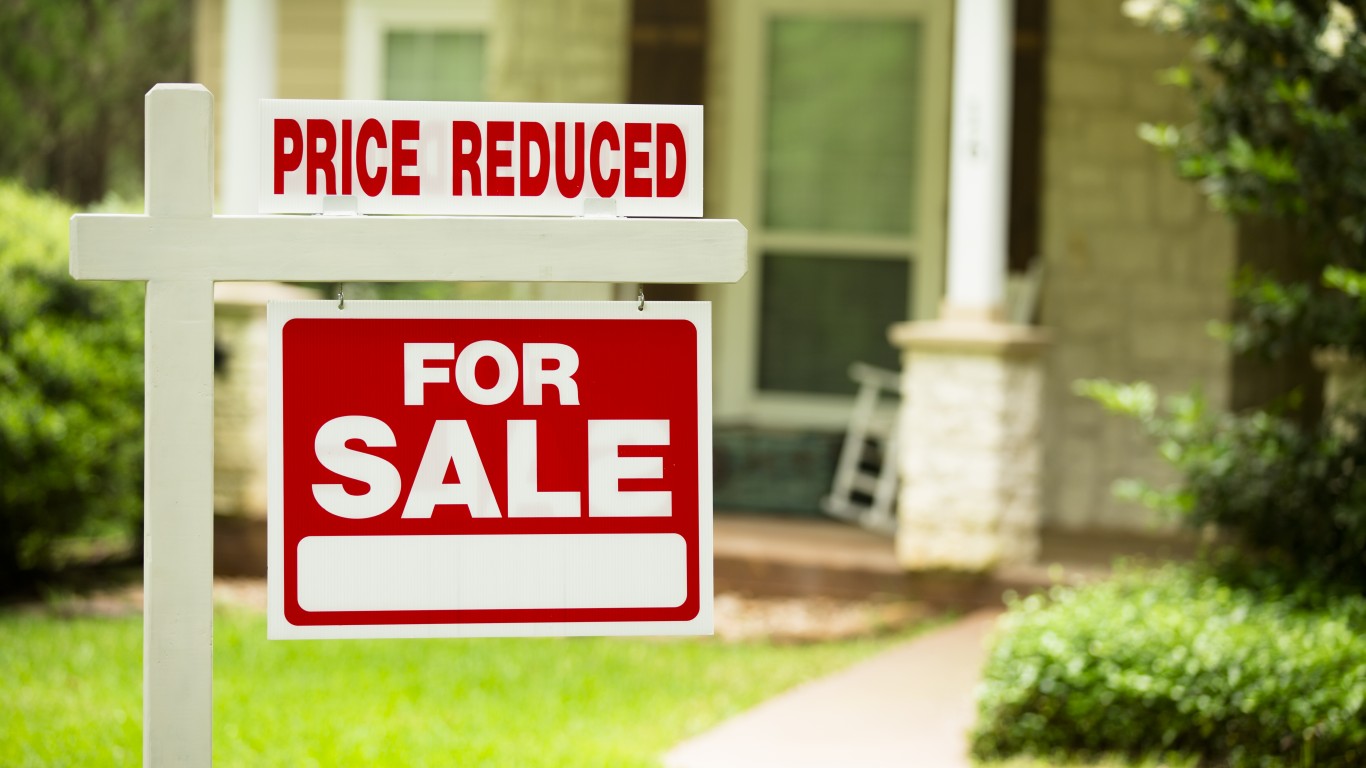
U.S. home prices rose by an average of around 7% in 2017 and are estimated to rise by more than 5% this year and more than 4% in 2019, according to a new report from Freddie Mac. Mortgage rates are climbing too, from 4% last year to around 5% in 2019.
Rising prices coupled with higher interest rates make it tough for first-time buyers looking to buy a home. What makes it even tougher is the lack of inventory to choose from. Trulia reported on Wednesday that first-quarter 2018 inventory of starter homes for sale totaled just 217,717, down from 253,735 in the fourth quarter of 2017.
The median price for a starter home in the first quarter of 2018 was $180,931, a year-over-year increase of 9.6% from the first quarter of 2017. In order to afford to buy that median-priced home, buyers would have to shell out 41.2% of their total income. In the same period last year, starter-home buyers needed to use 36.9% of their income.
In the 10 U.S. metro areas with the fastest rising home prices, starter home prices jumped by double digits. Here’s the list from Freddie Mac, along with the year-over-year list price increase for starter homes and the additional percentage of income first-time buyers needed to buy a home.
- Salt Lake City, Utah
Median starter home price: $229,908
Starter home price increase, 2016 to 2017: 31%
Additional income increase required: 9%- Seattle, Washington
Median starter home price: $326,550
Starter home price increase, 2016 to 2017: 16%
Additional income increase required: 6%- Fort Worth, Texas
Median starter home price: $124,950
Starter home price increase, 2016 to 2017: 25%
Additional income increase required: 6%- San Antonio, Texas
Median starter home price: $112,950
Starter home price increase, 2016 to 2017: 27%
Additional income increase required: 6%- Las Vegas, Nevada
Median starter home price: $151,667
Starter home price increase, 2016 to 2017: 21%
Additional income increase required: 6%- Nashville, Tennessee
Median starter home price: $136,616
Starter home price increase, 2016 to 2017: 25%
Additional income increase required: 5%- Deltona-Daytona-Ormond Beach, Florida
Median starter home price: $113,450
Starter home price increase, 2016 to 2017: 21%
Additional income increase required: 5%- Los Angeles, California
Median starter home price: $379,333
Starter home price increase, 2016 to 2017: 8%
Additional income increase required: 5%- Boston, Massachusetts
Median starter home price: $292,967
Starter home price increase, 2016 to 2017: 12%
Additional income increase required: 5%- Austin, Texas
Median starter home price: $208,597
Starter home price increase, 2016 to 2017: 14%
Additional income increase required: 4%
Freddie Mac’s report notes: “Given that the median income grew only modestly in many of these markets, many first-time homebuyers were pushed out of the market.”
The average size of a starter home has dropped from 1,211 square feet in the first quarter of 2012 to 1,187 square feet in the first quarter of this year, and the houses are nearly nine years older (53.3 years) than they were in 2012. Meanwhile, the percentage of fixer-uppers has risen from 10.3% in 2012 to 11.2%. In other words, less costs more.
Here’s how Trulia sums it up:
Starter home buyers are facing a perfect storm of the lowest inventory, the highest prices and the lowest levels of affordability among all housing segments. In addition, the quality and size of homes available in this segment has worsened to the point where first-time home buyers are likely to feel their choices are even more limited. Meanwhile, mortgage rates have been climbing since the beginning of 2018, worsening affordability. While 2017’s housing starts reflected the highest numbers we have seen in 10 years, they have yet to translate to any relief in the starter home segment.
See the full reports from Freddie Mac and Trulia for more information.
Are You Still Paying With a Debit Card?
The average American spends $17,274 on debit cards a year, and it’s a HUGE mistake. First, debit cards don’t have the same fraud protections as credit cards. Once your money is gone, it’s gone. But more importantly you can actually get something back from this spending every time you swipe.
Issuers are handing out wild bonuses right now. With some you can earn up to 5% back on every purchase. That’s like getting a 5% discount on everything you buy!
Our top pick is kind of hard to imagine. Not only does it pay up to 5% back, it also includes a $200 cash back reward in the first six months, a 0% intro APR, and…. $0 annual fee. It’s quite literally free money for any one that uses a card regularly. Click here to learn more!
Flywheel Publishing has partnered with CardRatings to provide coverage of credit card products. Flywheel Publishing and CardRatings may receive a commission from card issuers.
Thank you for reading! Have some feedback for us?
Contact the 24/7 Wall St. editorial team.
Latest from 24/7


Our expert who first called NVIDIA in 2009 is predicting 2025 will see a historic AI breakthrough.
You can follow him investing $500,000 of his own money on our top AI stocks for free.