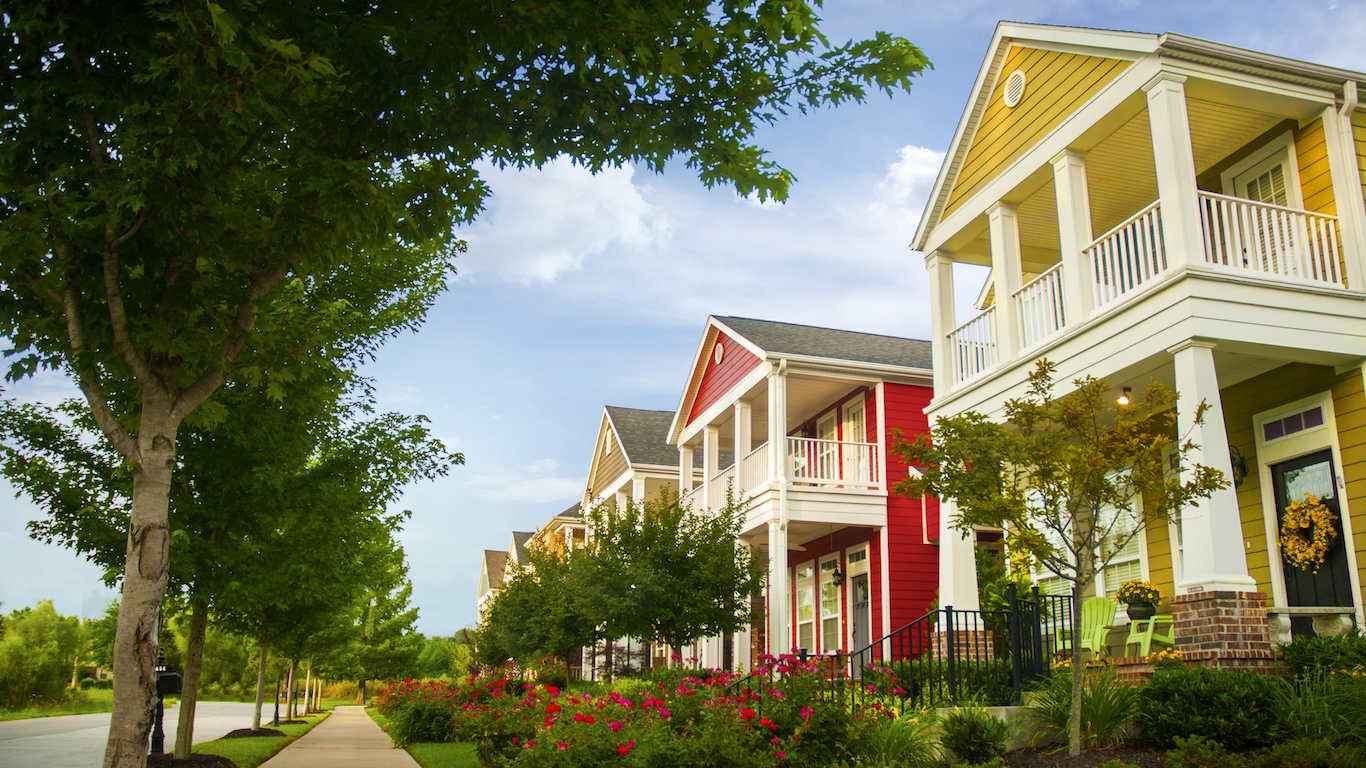
Compared to the third quarter of 2017, U.S. homeowner equity in the third quarter of this year rose by $775.2 billion, up 9.4%. The number of homeowners whose mortgages exceed the value of the property (called negative equity or underwater) fell by 16% (416,000) from 5% (2.6 million) to 4% of (2.2 million) mortgaged properties.
In the past 12 months, 81,000 borrowers have attained positive equity positions in their homes, according to a report released Thursday by CoreLogic. The report reflects only mortgaged single-family properties.
CoreLogic’s chief economist, Frank Nothaft, said:
On average, homeowners saw their home equity increase again this quarter but not nearly as much as in previous quarters. During the third quarter, homeowners gained an average of $12,400 compared to the second quarter when the average home equity wealth increase was more than $16,000. This lower year-over-year gain reflects the slowing in appreciation we’ve seen in the CoreLogic Home Price Index.
[nativounit]
CEO Frank Martell added:
The number of homes in a negative equity position has remained around 2.2 million for two consecutive quarters this year. Without equity, those homeowners are unable to sell their homes and are more likely to transition from delinquency to foreclosure if they face financial distress.
Nationwide, some 4.1% of all homes with a mortgage were underwater compared with 26% in the fourth quarter of 2009, the peak period for negative equity. Nevada’s 4.3% drop in negative equity over the past 12 months represented the nation’s largest year-over-year decline, and Las Vegas’s drop from a high of 72.7% in the first quarter of 2010 to 4.7% represented the largest decline from the peak.
Among the country’s largest metropolitan areas, CoreLogic called out current negative equity percentages in these 10:
- Miami: 11.2%
- Chicago: 8.4%
- Washington, D.C.: 5.5%
- Las Vegas: 5.2%
- New York City: 4.8%
- Boston: 3.2%
- Houston: 1.5%
- Los Angeles: 1.4%
- Denver: 1.3%
- San Francisco: 0.6%
As the percentage of homes with negative equity rises, the average amount of negative equity drops. Miami, the city with the highest rate, has the lowest average amount (under $100,000) of negative equity. Conversely, San Francisco, where the rate is lowest, posts average negative equity of around $750,000.
[recirclink id=497115]
[wallst_email_signup]