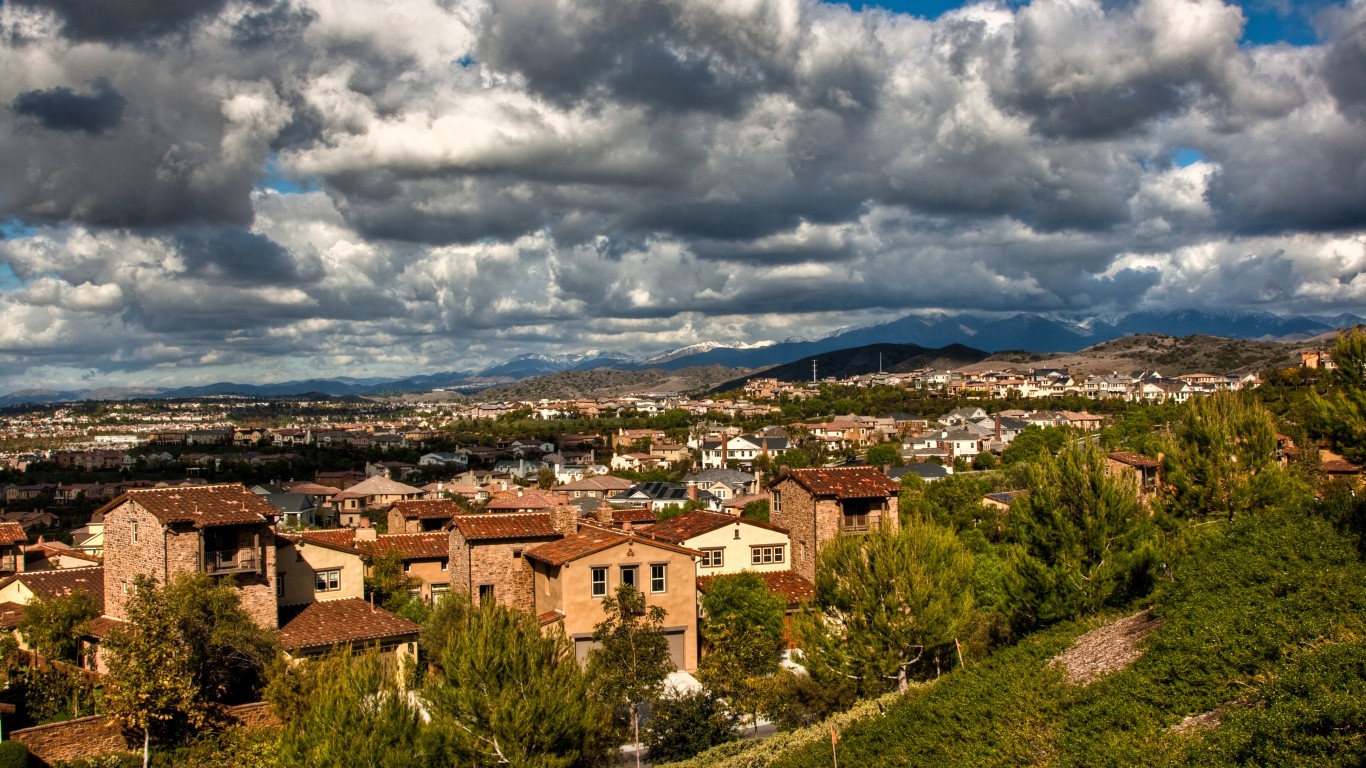
Compared to the fourth quarter of 2017, U.S. homeowner equity in the fourth quarter of 2018 rose by $678.4 billion, up 8.1% year over year and up $5.5 trillion in the past seven years. The number mortgages that exceed the value of the property (called negative equity or underwater) fell by 14%, from 2.6 million to 2.2 million year over year in the quarter, as 351,000 mortgages regained positive equity. Sequentially, however, underwater mortgages rose by 1.6%.
The fourth-quarter increase in homeowner equity is the lowest since the second quarter of 2016, according to CoreLogic, which issued Thursday’s report. About 63% of all U.S. homes have mortgages and the fourth-quarter negative equity percentage for all those mortgages was 4.9%. The CoreLogic report reflects only mortgaged single-family properties.
CoreLogic’s chief economist, Frank Nothaft, said:
Our forecast for the CoreLogic Home Price Index predicts there will be a 4.5 percent increase in our national index from December 2018 to the end of 2019. If all homes experience this gain, this would lift about 350,000 homeowners from being underwater and restore positive equity.
[nativounit]
CoreLogic CEO Frank Martell added:
As home prices rise, significantly more people are choosing to remodel, repair or upgrade their existing homes. The increase in home equity over the past several years provides homeowners with the means to finance home remodels and repairs. With rates still ultra-low by historical standards, home-equity loans provide a low-cost method to finance home-improvement spending. These expenditures are expected to rise 5 percent in 2019.
Among the country’s largest metropolitan areas, CoreLogic called out current negative equity percentages in these 10:
- Miami: 10.4%
- Chicago: 8.7%
- Washington, D.C.: 5.3%
- Las Vegas: 4.8%
- New York City: 4.8%
- Boston: 3.5%
- Houston: 1.6%
- Los Angeles: 1.5%
- Denver: 1.4%
- San Francisco: 0.7%
As the percentage of homes with negative equity rises, the average amount of negative equity drops. Miami, the city with the highest rate has the lowest average amount (under $100,000) of negative equity. Conversely, San Francisco, where the rate is lowest, posts average negative equity of around $750,000.
[recirclink id=529389]
[wallst_email_signup]