U.S. home prices rose 5.1% in November, compared with the same month a year ago, according to data from research firm CoreLogic released Wednesday in the firm’s Home Price Insights monthly report. The data include sales of distressed properties.
Home prices rose 5.4% year over year and 0.5% month over month in November. On a year-over-year basis, the index has increased every month since February 2012 and is up 58% since bottoming out in March 2011.
Month over month, November prices rose 0.4%, including distressed home sales. CoreLogic expects housing prices to rise by 4.8% year over year in November 2019 and to drop by 0.8% month over month in November 2019.
As of last November, home prices are now 6.1% higher than they were at the April 2006 pre-crash peak. Adjusted for inflation, however, home prices remain 13.1% below the April 2006 peak.
[nativounit]
CEO Frank Martell noted:
A strong economy helps homeowners feel confident about the value of their property. If recent declines in the stock market shake consumer confidence in the national economy, we may see homeowners’ perception of home value change and a subsequent buyers’ market emerge in 2019.
Chief economist Frank Nothaft added:
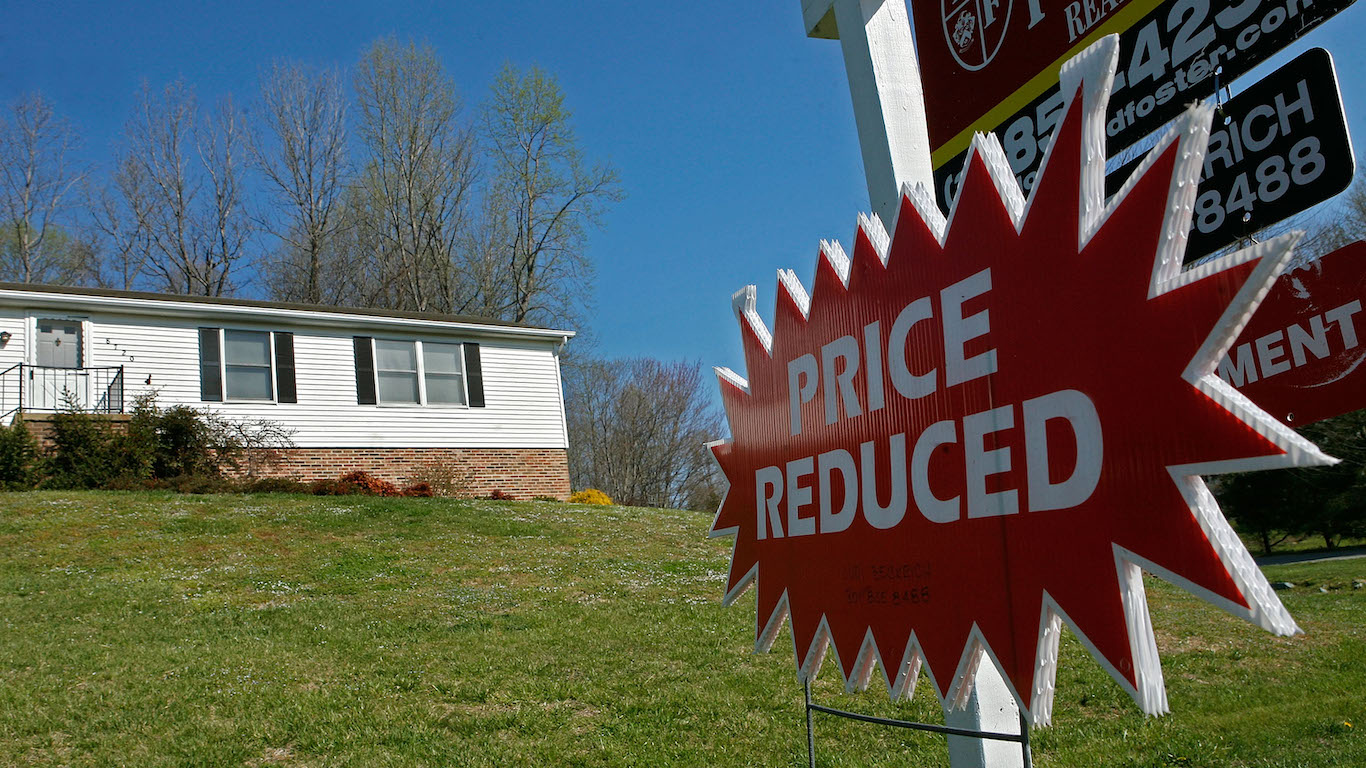
The rise in mortgage rates has dampened buyer demand and slowed home-price growth. Interest rates for new 30-year fixed-rate loans averaged 4.9 percent during December, the highest monthly average since February 2011. These higher rates and home prices have reduced buyer affordability. Home sellers are responding by lowering their asking price, which is reflected in the slowing growth of the CoreLogic Home Price Index.
Including distressed sales, home prices rose the most year over year in Nevada (11.1%) and Idaho (11.0%).
Through November, 35% of the top 100 metropolitan areas were overvalued, 27% were undervalued and 38% were at value. When looking at only the top 50 markets based on housing stock, 44% were overvalued, 18% were undervalued and 38% were at value. CoreLogic defines an overvalued housing market as one in which home prices are at least 10% higher than the long-term, sustainable level, while an undervalued housing market is one in which home prices are at least 10% below the sustainable level.
Among U.S. metro areas, Las Vegas has posted the largest year-over-year index gain (11.7%). Denver is up 6.6%, with Seattle (5.9%), Los Angeles (5.3%) and Boston (5.1%) rounding out the top five.
See CoreLogic’s November report for more detail.
[recirclink id=514997]
[wallst_email_signup]