Housing inventory has risen over the past several months, but higher home prices and interest rates have not increased the number of affordable homes on the market. In fact, compared to 2017, last year’s stock of affordable homes for sale dropped.
Online real-estate firm Redfin reported the data earlier this week. In San Jose, California, for example, just 14% of homes for sale in 2018 were affordable compared with 26% in 2017. Of the 49 U.S. metro areas the firm included in its report, the share of affordable homes for sale dropped, although the number of affordable homes increased.
Redfin calculated affordability based on the share of homes in a metro area that were affordable to a household making the median income in that metro. The calculation assumed a 20% down payment, a 2018 mortgage interest rate of 4.64% and a 2017 interest rate of 3.95%, and a monthly mortgage payment of no more than 30% of a household’s gross income.
[nativounit]
Redfin’s chief economist, Daryl Fairweather, commented:
Homeownership is increasingly out of reach for the typical American. Over the last few years builders have focused on luxury homes, and there hasn’t been enough construction of affordable starter homes. We expect builders to shift their attention to more affordable homes during 2019, which along with rezoning efforts by local governments should reduce this pressure to some degree over time.
Here are the 10 metro areas where the percentage drop in the number of affordable homes was largest between 2017 and 2018.
San Jose, California
> Affordable homes for sale in 2017: 5,804
> Affordable homes for sale in 2018: 2,616
> Year-over-year change: down 54.9%
Seattle, Washington
> Affordable homes for sale in 2017: 43,837
> Affordable homes for sale in 2018: 36,476
> Year-over-year change: down 16.8%
San Francisco, California
> Affordable homes for sale in 2017: 16,731
> Affordable homes for sale in 2018: 13,954
> Year-over-year change: down 16.6%
Los Angeles, California
> Affordable homes for sale in 2017: 27,257
> Affordable homes for sale in 2018: 22,935
> Year-over-year change: down 15.9%
San Diego, California
> Affordable homes for sale in 2017: 17,833
> Affordable homes for sale in 2018: 15,036
> Year-over-year change: down 15.7%
Washington, D.C.
> Affordable homes for sale in 2017: 170,127
> Affordable homes for sale in 2018: 149,208
> Year-over-year change: down 12.3%
Sacramento, California
> Affordable homes for sale in 2017: 22,667
> Affordable homes for sale in 2018: 19,932
> Year-over-year change: down 12.1%
Philadelphia, Pennsylvania
> Affordable homes for sale in 2017: 160,098
> Affordable homes for sale in 2018: 142,338
> Year-over-year change: down 11.1%
Riverside, California
> Affordable homes for sale in 2017: 38,988
> Affordable homes for sale in 2018: 34,721
> Year-over-year change: down 10.9%
Portland, Oregon
> Affordable homes for sale in 2017: 30,832
> Affordable homes for sale in 2018: 27,867
> Year-over-year change: down 9.6%
In these seven metro areas, the number of affordable homes for sale increased year over year in 2018:
Hartford, Connecticut
> Affordable homes for sale in 2017: 14,290
> Affordable homes for sale in 2018: 16,973
> Year-over-year change: up 18.8%
Jacksonville, Florida
> Affordable homes for sale in 2017: 27,106
> Affordable homes for sale in 2018: 29,413
> Year-over-year change: up 8.5%
Nashville, Tennessee
> Affordable homes for sale in 2017: 37,430
> Affordable homes for sale in 2018: 38,857
> Year-over-year change: up 3.8%
Chicago, Illinois
> Affordable homes for sale in 2017: 135,695
> Affordable homes for sale in 2018: 139,374
> Year-over-year change: up 2.7%
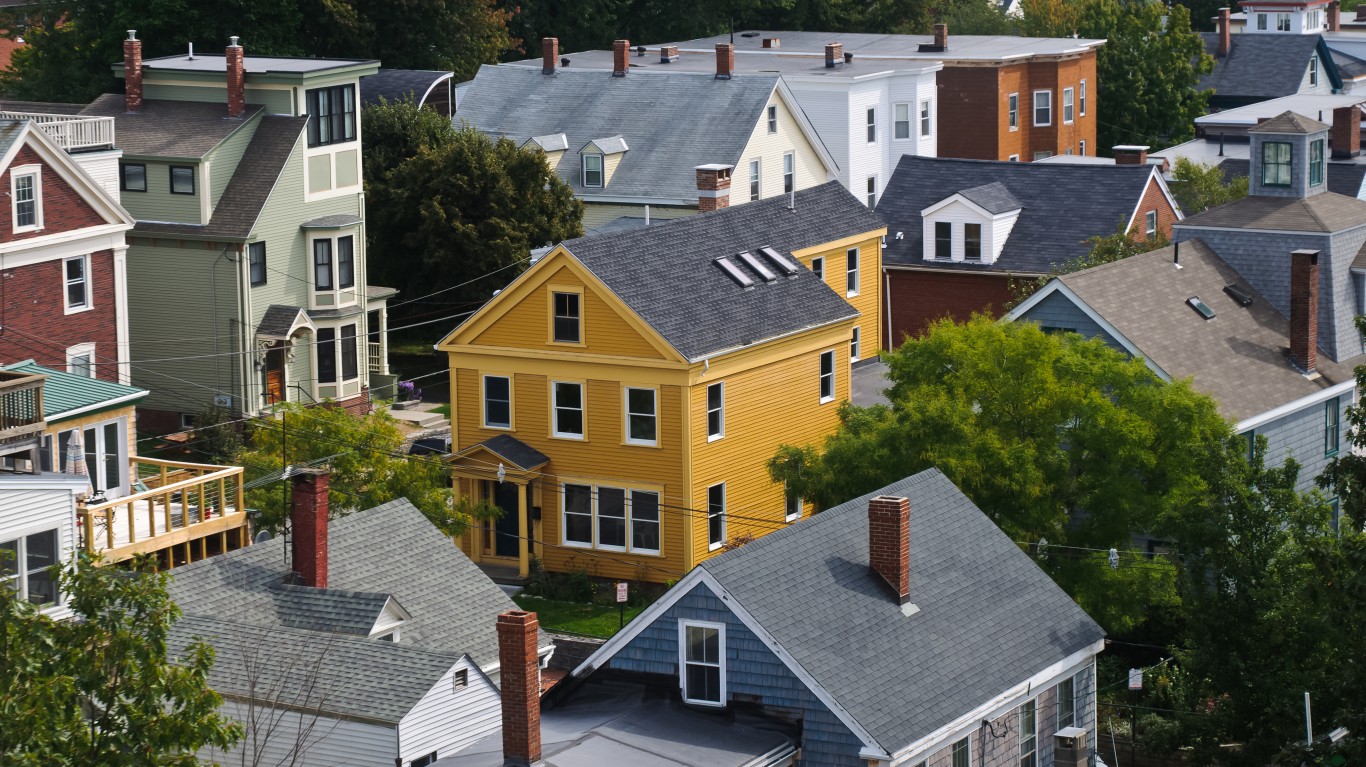
Providence, Rhode Island
> Affordable homes for sale in 2017: 17,985
> Affordable homes for sale in 2018: 18,219
> Year-over-year change: up 1.3%
Indianapolis, Indiana
> Affordable homes for sale in 2017: 32,783
> Affordable homes for sale in 2018: 33,053
> Year-over-year change: up 0.8%
Kansas City, Missouri
> Affordable homes for sale in 2017: 35,206
> Affordable homes for sale in 2018: 35,267
> Year-over-year change: up 0.2%
The full listing of all 49 metro areas and methodology are available at the Redfin website.
[recirclink id=523125]
[wallst_email_signup]