
Recessions are supposed to bring havoc and strife to the housing market. With the COVID-19 pandemic having locked people in their homes and apartments, this recession brought carnage to the housing market in 2020. What’s different this time around is that carnage was very brief, and suddenly there seems to be a boom in housing demand heading into the summer.
One thing that marks a strong housing market is when bidding wars on properties come into play. That is when it is a seller’s market. It may seem hard to imagine, with double-digit unemployment and with double-digit declines in gross domestic product, but the start of the summer housing season of 2020 has seen a surge in bidding wars in many areas in America.
Redfin Corp. (NASDAQ: RDFN) announced on Monday that 49.4% of offers on home purchases faced competition in May. April’s level was 43.9%. To define competition, an offer is considered to be in a bidding war if an agent reported at least one competing bid for the home.
One key issue driving the multiple offers is that there is a shortage of homes for sale. To further prove that point, Redfin noted that May’s total number of listings on the market was down a sharp 18.9% from the same period in 2019.
[nativounit]
Redfin also attributed the increase in bidding wars to buyers starting to have more clarity about the state of the economy now that stay-at-home orders have been lifted.
It remains unclear whether the bidding war climate will remain into the summer months. Redfin was quick to point out that the rise in the number of coronavirus cases in many states brings questions about how sustainable that confidence is. That said, the company showed that agents have reported that competition among buyers was up significantly in recent weeks. The release also showed that many of the offers are coming in as all-cash and are driving the sales prices higher.
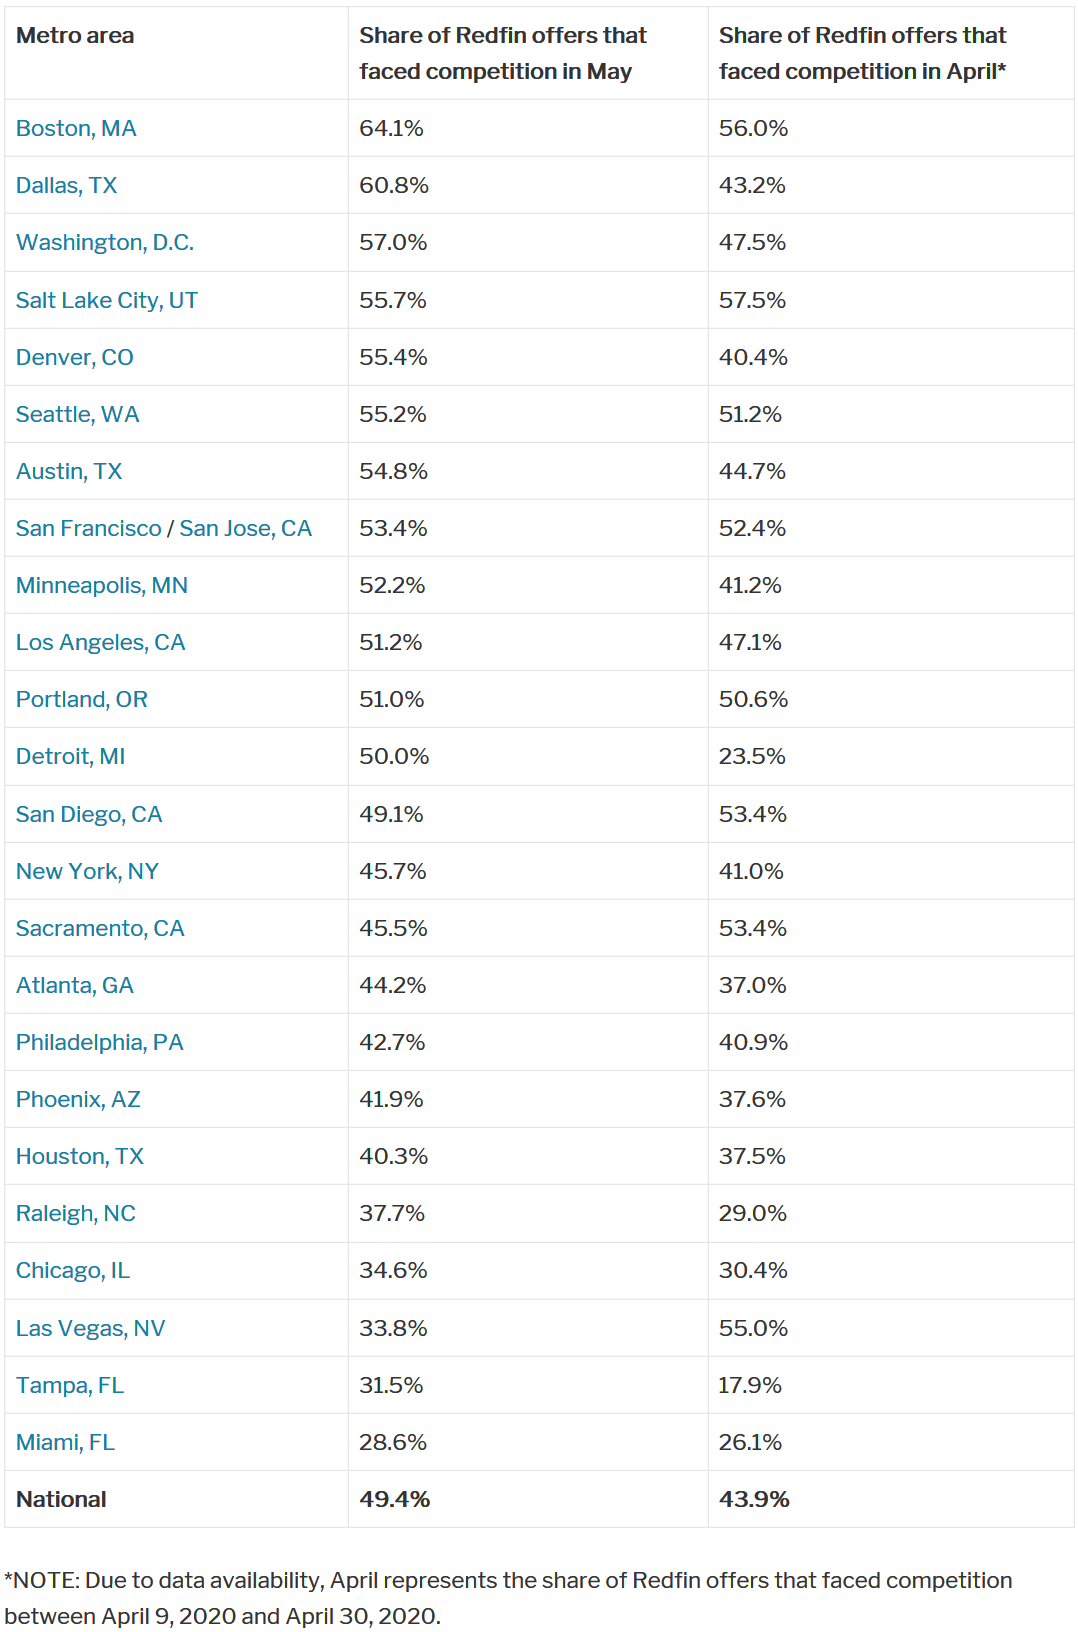
There is also a contrast in where the bidding wars and housing strength is geographically and in price points. A Redfin table (see image below) shows increases in the rates of bidding wars in 20 of the 24 metros. There is a discrepancy in the exact full dates in April versus May, but the percentages should speak for themselves.
Of the 24 major metro areas covered by Redfin, in 11 a majority of Redfin’s offers faced competition in May, up from eight of the metro areas in April. Buyers in the Boston area led the way with competition of 64.1% in May, up from 56.0% in April. Dallas came in second place in May at 60.8%, followed by 57.0% in Washington, D.C. Somewhat surprising was that the Detroit metro area saw the largest increase as the percentage of offers facing competition more than doubled to 50.0% from 23.5% the prior month. Salt Lake City came in at 55.7%, down 1.8 points, and Denver came in at 55.4% for a 14-point gain. Other metro areas where bidding wars were above 50% were Seattle; Austin, Texas; San Francisco/San Jose; Minneapolis; Los Angeles; and Portland.
As for the two worst areas of competition, Miami saw only 28.6% and Tampa saw only 31.5% of offers their sales facing competition. Las Vegas was the biggest decliner in offers with competition, as its rate fell by 21.2 percentage points.
As for the price points, Redfin noted that any home priced under $500,000 is receiving multiple offers because the supply is so much less than the demand. The rate of bidding wars by type was led by a 41.5% reading for single-family homes, compared with 48.7% in townhouses and 38.8% for condos. Redfin even went so far as to say that people no longer want to share laundry services or a yard and that buyers want places with more privacy.
[recirclink id=713337]
Redfin’s table has been included below for those looking for more specifics of major metro areas around the nation.
[wallst_email_signup]