24/7 Wall St. Insights
- Rising demand and limited supply have driven U.S. home prices up by nearly 4% so far in 2024.
- In many popular coastal areas, price increases have far exceeded the national average.
- In Massachusetts, however, not all oceanfront housing markets align with the broader trend.
- Also: Discover the next Nvidia
Coastal communities are some of the most popular places to live in the United States. But while the U.S. has nearly 12,400 miles of coastline, more than all but seven other countries worldwide, the supply of available oceanfront real estate is inherently fixed.
Fewer than 8% of the more than 3,200 counties and county equivalents across the 50 states border an ocean, and over the last 50 years, these places have reported population growth of over 40 million, according to the National Oceanic and Atmospheric Administration. As of 2022, nearly 30% of the U.S. population lived in a county or county equivalent that borders an ocean.
With rising demand and limited supply, many coastal communities are reporting skyrocketing home prices — a reflection of the nationwide housing shortage and ongoing affordability crisis.
Though home prices have fallen slightly in recent months, the housing market is still generally more expensive today than it was at the beginning of the year. According to data from Realtor.com, the typical American home was listed for $425,000 in September 2024, a $15,500, or 3.8%, increase from the median list price in January 2024.
In Massachusetts, one of 23 U.S. states located along an ocean, home prices have climbed even faster than average. Among the 12,220 homes statewide that were on the market in September 2024, the median list price was $779,500, about 4.0% higher than in January. Notably, however, not all housing markets in coastal Massachusetts have followed this trend.
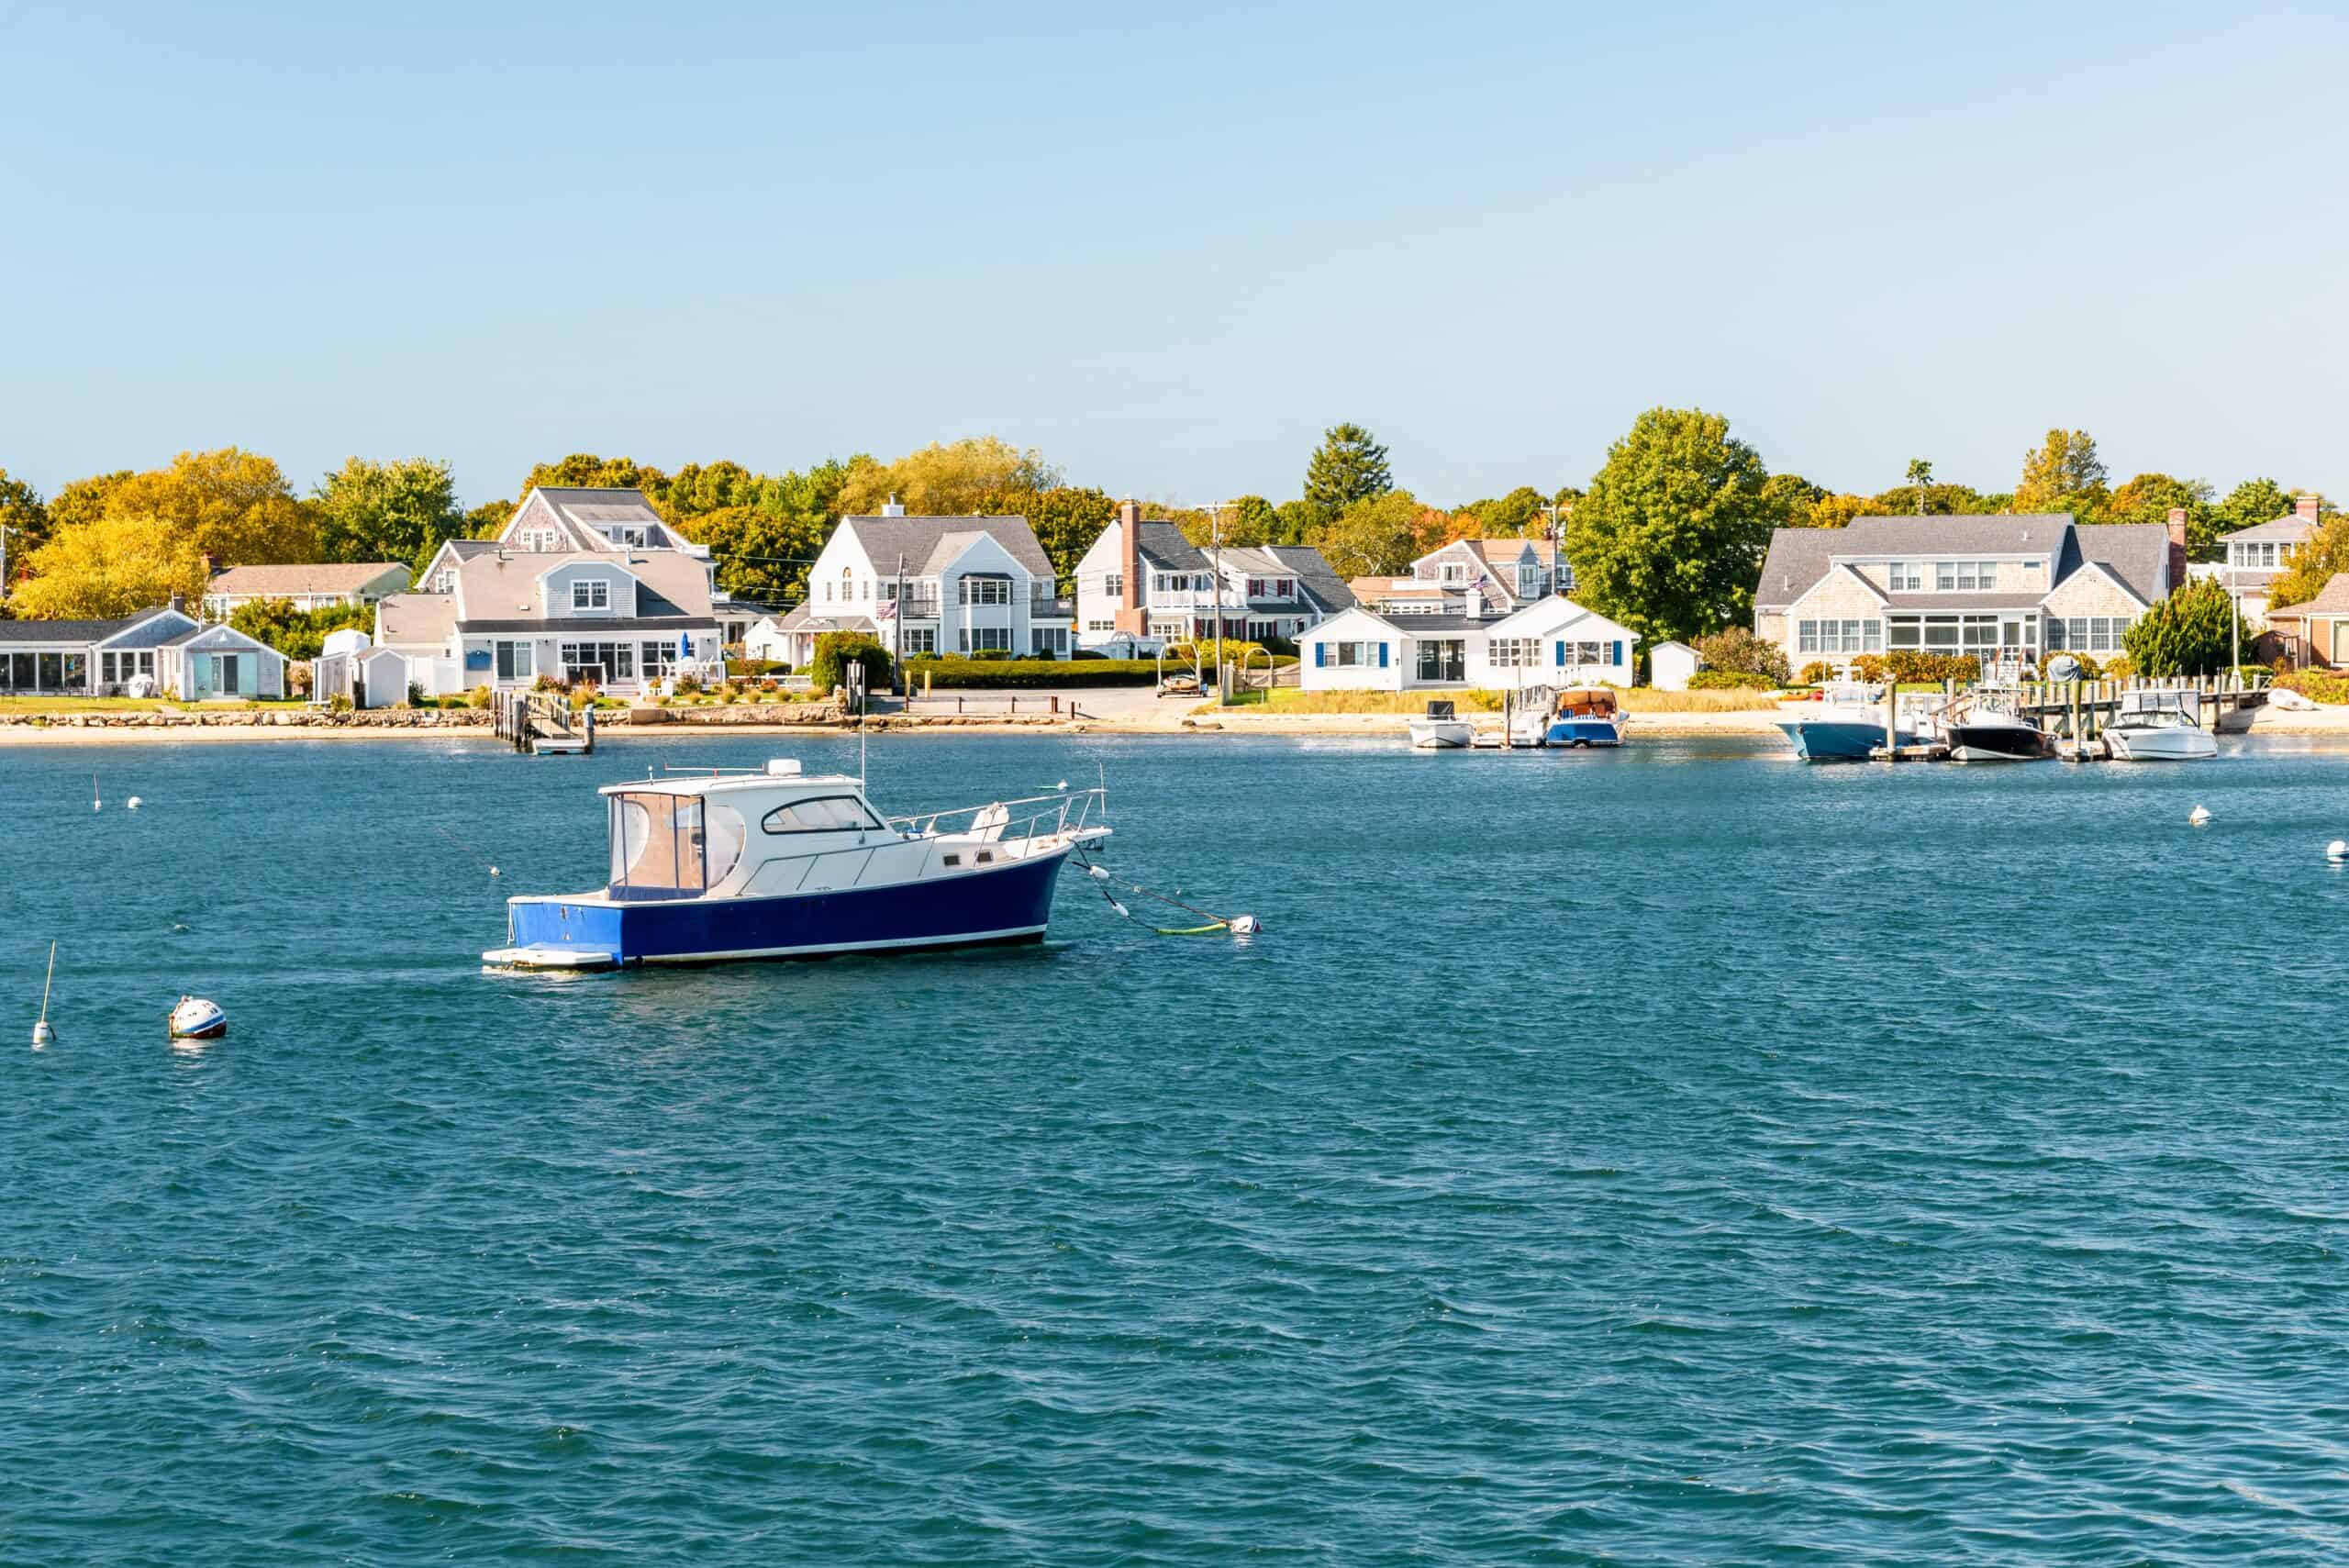
Of the 14 counties in Massachusetts with available housing market data, eight border the Atlantic Ocean. In some of these places, home prices have climbed by more than 7% so far in 2024. In other coastal counties, price increases have been far more modest — and in three, a typical home is cheaper now than it was at the beginning of the year. (Here is a look at the most affordable housing market in each state.)
It is important to note that, as of September 2024, median list prices varied between $572,225 and $4,972,500 in these counties — and while some of these housing markets may be only modestly more expensive, or even cheaper, than they were at the beginning of the year, they are not necessarily affordable for a broad range of budgets. (Here is a look at the cities where most homes cost less than $125,000.)
These are the coastal counties in Massachusetts where home prices have climbed or fallen the most in 2024. All eight oceanfront counties in the state, with available data from Realtor.com, are ranked on the percent change in median list price from January to September 2024.
Why It Matters
In recent years, limited supply and rising demand have fueled a surge in home prices. This year alone, the list price of a typical American home has climbed by about 3.8%. In many popular coastal areas, the same supply and demand dynamics that led to the ongoing housing affordability crisis have been even more pronounced. In Massachusetts, however, not all oceanfront housing markets have gotten more expensive in 2024.
8. Plymouth County

- Change in median home list price in 2024: +10.1% (+$67,100)
- Median home list price in January 2024: $664,900 ($84,550 less than statewide median)
- Median home list price in September 2024: $732,000 ($47,500 less than statewide median)
- Median size of a listed home in September 2024: 1,956 square feet (86 sq. ft. larger than statewide median)
- Number of homes for sale in September 2024: 960 (7.9% of all listed homes in Massachusetts)
- Population: 529,548
7. Norfolk County

- Change in median home list price in 2024: +7.1% (+$60,000)
- Median home list price in January 2024: $839,450 ($90,000 more than statewide median)
- Median home list price in September 2024: $899,450 ($119,950 more than statewide median)
- Median size of a listed home in September 2024: 2,135 square feet (265 sq. ft. larger than statewide median)
- Number of homes for sale in September 2024: 1,015 (8.3% of all listed homes in Massachusetts)
- Population: 722,112
6. Nantucket County
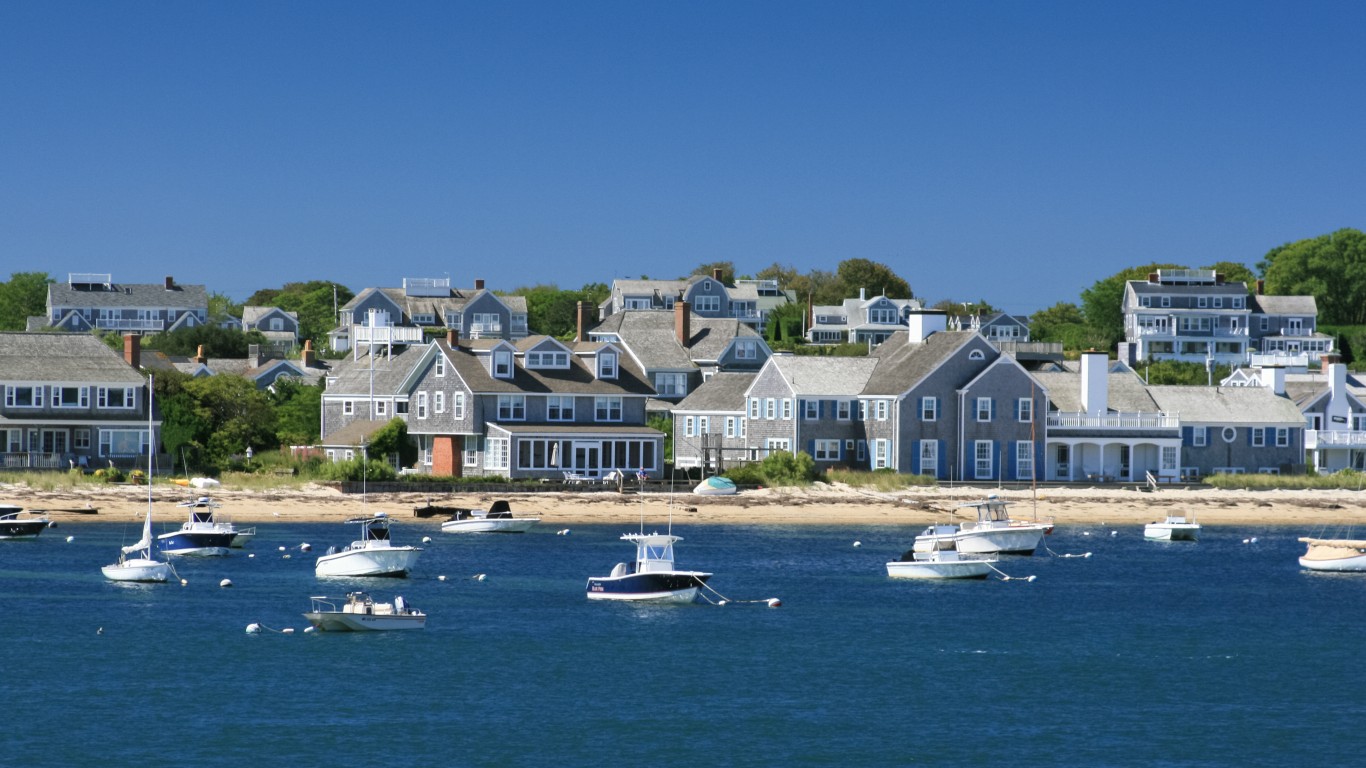
- Change in median home list price in 2024: +5.9% (+$276,500)
- Median home list price in January 2024: $4,696,000 ($3,946,550 more than statewide median)
- Median home list price in September 2024: $4,972,500 ($4,193,000 more than statewide median)
- Median size of a listed home in September 2024: 3,152 square feet (1,282 sq. ft. larger than statewide median)
- Number of homes for sale in September 2024: 214 (1.8% of all listed homes in Massachusetts)
- Population: 14,065
5. Bristol County

- Change in median home list price in 2024: +4.1% (+$22,775)
- Median home list price in January 2024: $549,450 ($200,000 less than statewide median)
- Median home list price in September 2024: $572,225 ($207,275 less than statewide median)
- Median size of a listed home in September 2024: 1,832 square feet (38 sq. ft. smaller than statewide median)
- Number of homes for sale in September 2024: 706 (5.8% of all listed homes in Massachusetts)
- Population: 576,699
4. Essex County

- Change in median home list price in 2024: 0%
- Median home list price in January 2024: $799,000 ($49,550 more than statewide median)
- Median home list price in September 2024: $799,000 ($19,500 more than statewide median)
- Median size of a listed home in September 2024: 2,059 square feet (189 sq. ft. larger than statewide median)
- Number of homes for sale in September 2024: 1,013 (8.3% of all listed homes in Massachusetts)
- Population: 806,103
3. Barnstable County

- Change in median home list price in 2024: -3.2% (-$30,000)
- Median home list price in January 2024: $929,950 ($180,500 more than statewide median)
- Median home list price in September 2024: $899,950 ($120,450 more than statewide median)
- Median size of a listed home in September 2024: 1,831 square feet (39 sq. ft. smaller than statewide median)
- Number of homes for sale in September 2024: 1,662 (13.6% of all listed homes in Massachusetts)
- Population: 229,436
2. Suffolk County

- Change in median home list price in 2024: -10.6% (-$112,513)
- Median home list price in January 2024: $1,062,500 ($313,050 more than statewide median)
- Median home list price in September 2024: $949,987 ($170,487 more than statewide median)
- Median size of a listed home in September 2024: 1,247 square feet (623 sq. ft. smaller than statewide median)
- Number of homes for sale in September 2024: 1,542 (12.6% of all listed homes in Massachusetts)
- Population: 785,443
1. Dukes County
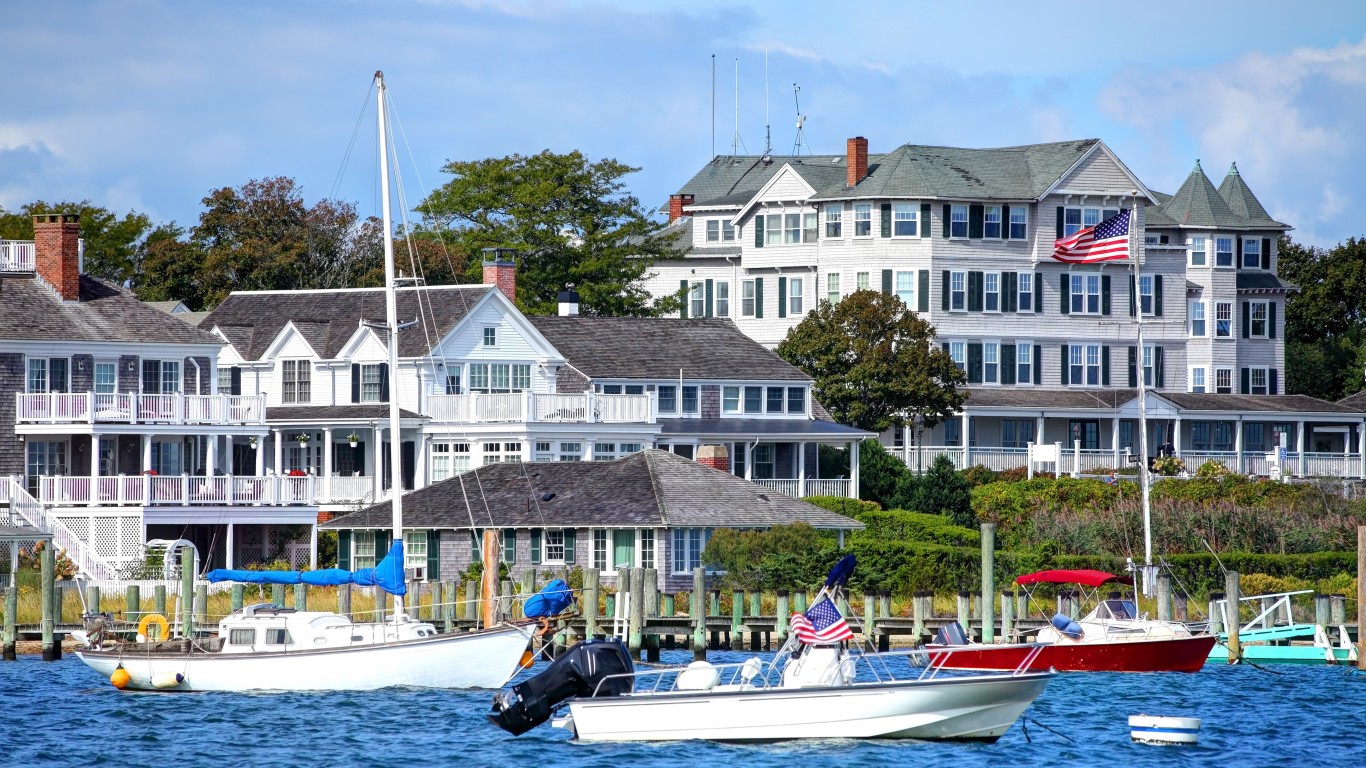
- Change in median home list price in 2024: -14.1% (-$360,000)
- Median home list price in January 2024: $2,555,000 ($1,805,550 more than statewide median)
- Median home list price in September 2024: $2,195,000 ($1,415,500 more than statewide median)
- Median size of a listed home in September 2024: 2,232 square feet (362 sq. ft. larger than statewide median)
- Number of homes for sale in September 2024: 289 (2.4% of all listed homes in Massachusetts)
- Population: 20,543
The Average American Is Their Savings Every Day (Sponsor)
If you’re like many Americans and keep your money ‘safe’ in a checking or savings account, think again. The average yield on a savings account is a paltry .4% today. Checking accounts are even worse.
But there is good news. To win qualified customers, some accounts are paying almost 10x the national average! That’s an incredible way to keep your money safe and earn more at the same time. Our top pick for high yield savings accounts includes other benefits as well. You can earn up to 3.80% with a Checking & Savings Account today Sign up and get up to $300 with direct deposit. No account fees. FDIC Insured.
Click here to see how much more you could be earning on your savings today. It takes just a few minutes to open an account to make your money work for you.
Our top pick for high yield savings accounts includes other benefits as well. You can earn up to 4.00% with a Checking & Savings Account from Sofi. Sign up and get up to $300 with direct deposit. No account fees. FDIC Insured.
Thank you for reading! Have some feedback for us?
Contact the 24/7 Wall St. editorial team.

