
More than 60 years have passed since President Lyndon Johnson declared war on poverty, and yet, poverty remains endemic in the United States. In any given year over the last three decades, anywhere from 31.6 million to 48.8 million Americans were living below the poverty line. Over that period, the annual U.S. poverty rate climbed as high as 15.9%, and never fell below 11.3%.
The effects of poverty extend far beyond economics. According to the latest Pulse Survey from the U.S. Census Bureau, 38% of American adults earning less than $25,000 reported feeling depressed or hopeless on most days, compared to 17% of all adults. Additionally, 27% of adults in the lowest income bracket reported not having enough to eat within the last week, three times the food insufficiency rate among all adults.
In most of the country, including New York state, the U.S. Department of Health and Human Services sets the poverty line at an annual income of $15,060 for individuals and $31,200 for a family of four. In New York, 13.6% of the population live below these thresholds — and in many towns across the state, the poverty rate is far higher.
Using five-year estimates from the Census’ 2022 American Community Survey, 24/7 Wall St. identified the towns in New York with the highest poverty rates. We considered all places — including cities, towns, and unincorporated communities — with populations between 5,000 and 50,000. Because the presence of colleges and universities can distort economic realities in a given area, places where 20% or more of the population are enrolled in a post-secondary institution were excluded from analysis.
Among the 35 places on this list, poverty rates range from 18.8% to over 60%, and in all but one of these places, the typical household earns less than the statewide median household income of $81,386.
Widespread financial hardship in these areas is partially attributable to a lack of economic opportunity. In most places on this list, the five-year average unemployment rate is higher than the comparable 6.2% jobless rate across New York.
Incomes and job security tend to rise with educational attainment. According to the Bureau of Labor Statistics, the typical worker with a bachelor’s degree earns 66% more than those with no more than a high school diploma. Additionally, workers with only a high school education are far more likely to be unemployed than college graduates. In nearly every town on this list, the share of adults with a bachelor’s degree is below the 38.8% statewide bachelor’s degree attainment rate.
Why It Matters

The United States is, in many ways, the center of gravity of the global economy. The U.S. dollar has been the world’s leading reserve currency since the end of World War II, and American gross domestic product accounts for over a quarter of economic activity worldwide. Despite these advantages, more than one in every 10 Americans have been living below the poverty line for decades. For those facing serious financial hardship, the effects are far reaching. Poverty can negatively impact mental health, social relationships, and life expectancy.
35. Hornell
- Poverty rate: 18.8%
- Median household income: $47,632
- 5-yr. avg. unemployment rate: 8.5%
- Adults with a bachelor’s degree or higher: 16.3%
- Population: 8,208
34. Watertown
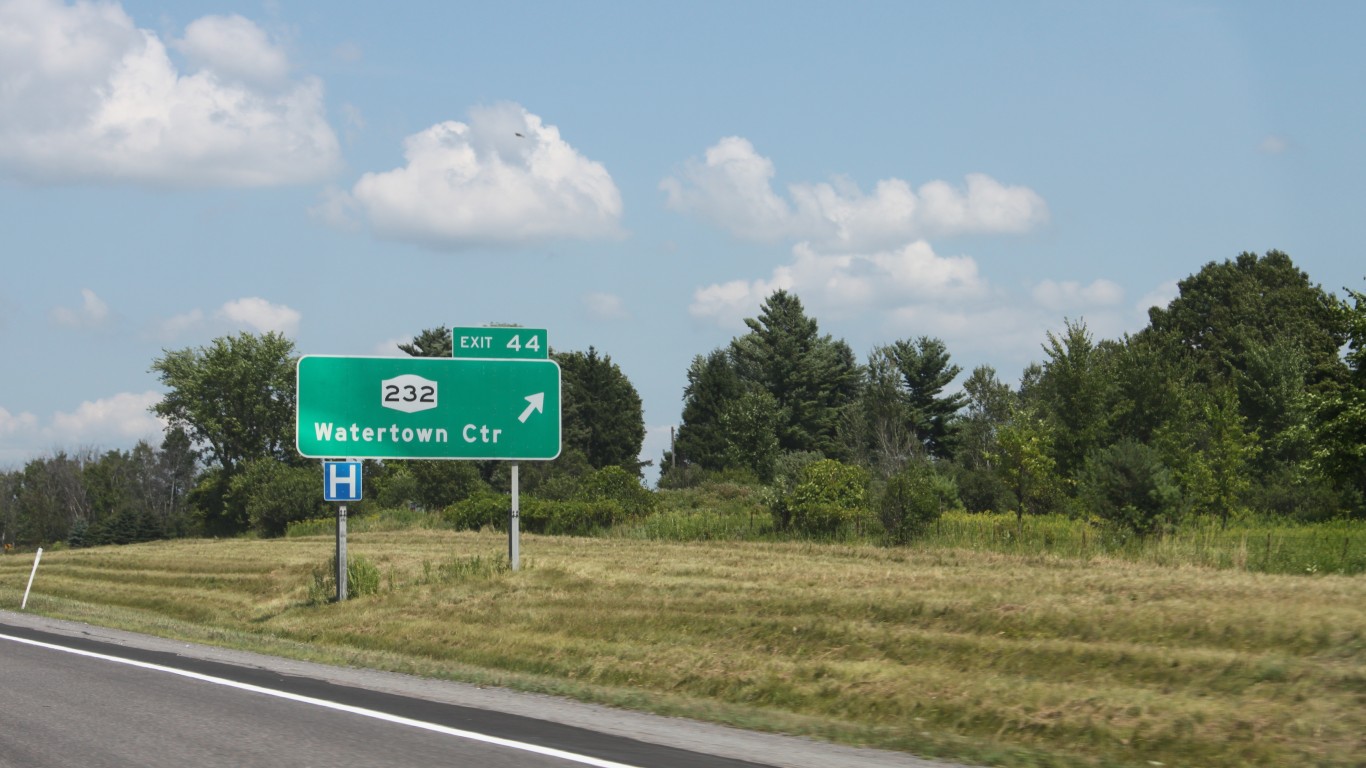
- Poverty rate: 19.5%
- Median household income: $49,722
- 5-yr. avg. unemployment rate: 5.8%
- Adults with a bachelor’s degree or higher: 25.3%
- Population: 24,859
33. Cohoes

- Poverty rate: 19.6%
- Median household income: $62,679
- 5-yr. avg. unemployment rate: 7.3%
- Adults with a bachelor’s degree or higher: 26.4%
- Population: 17,960
32. Rensselaer
- Poverty rate: 19.9%
- Median household income: $68,284
- 5-yr. avg. unemployment rate: 2.7%
- Adults with a bachelor’s degree or higher: 27.9%
- Population: 9,252
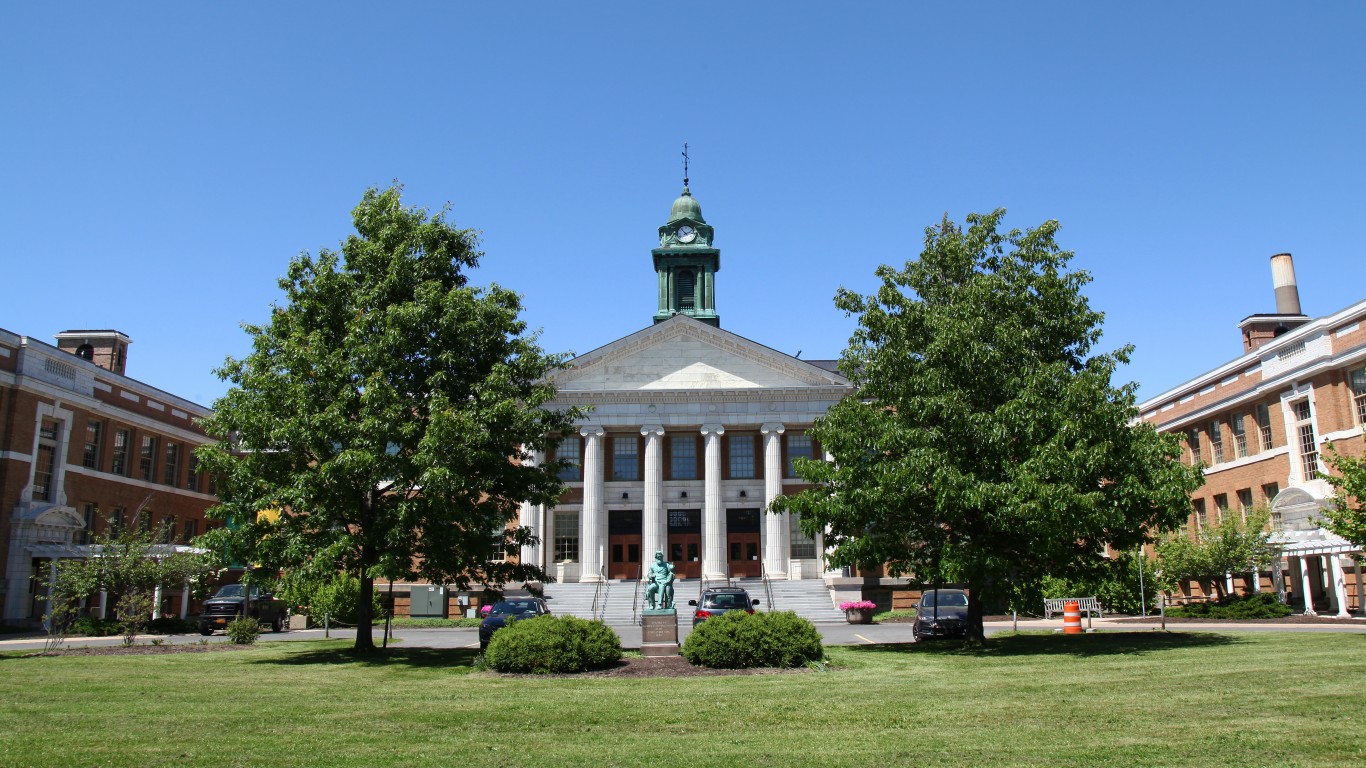
31. Auburn

- Poverty rate: 19.9%
- Median household income: $48,203
- 5-yr. avg. unemployment rate: 5.9%
- Adults with a bachelor’s degree or higher: 19.1%
- Population: 26,674
30. Watervliet

- Poverty rate: 20.2%
- Median household income: $51,092
- 5-yr. avg. unemployment rate: 4.7%
- Adults with a bachelor’s degree or higher: 18.9%
- Population: 10,325
29. Johnson City
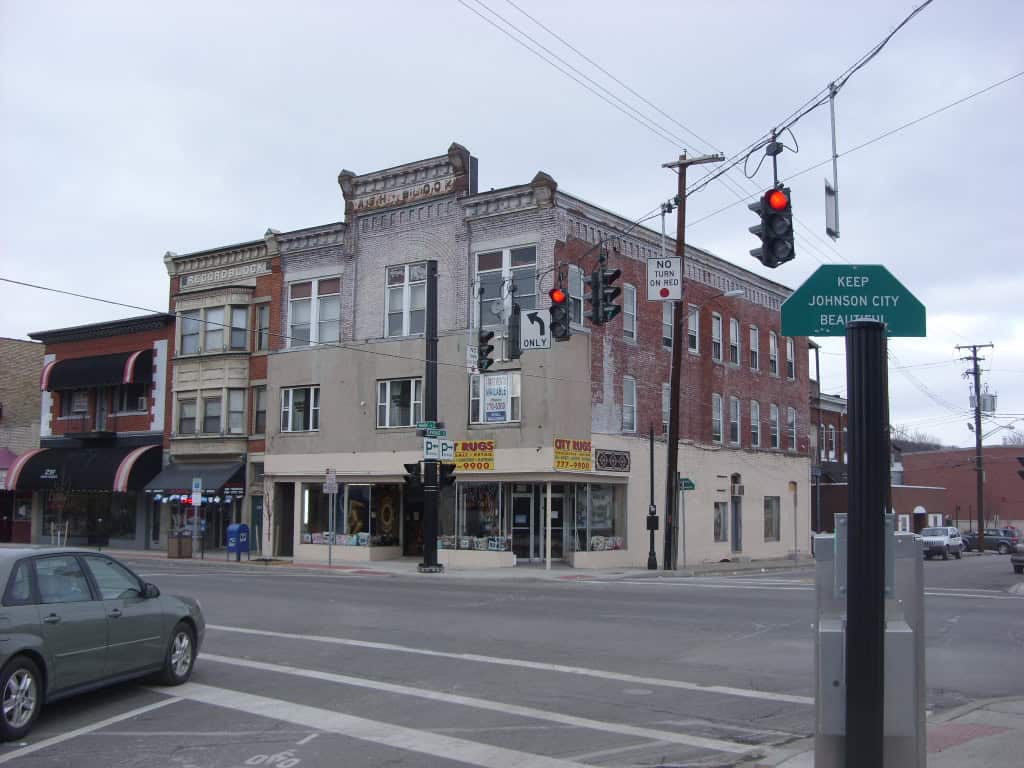
- Poverty rate: 20.3%
- Median household income: $50,611
- 5-yr. avg. unemployment rate: 11.2%
- Adults with a bachelor’s degree or higher: 28.1%
- Population: 15,229
28. Mechanicville

- Poverty rate: 20.7%
- Median household income: $45,686
- 5-yr. avg. unemployment rate: 6.4%
- Adults with a bachelor’s degree or higher: 20.2%
- Population: 5,177
27. Gloversville

- Poverty rate: 20.7%
- Median household income: $47,205
- 5-yr. avg. unemployment rate: 7.2%
- Adults with a bachelor’s degree or higher: 15.3%
- Population: 15,113
26. Flanders
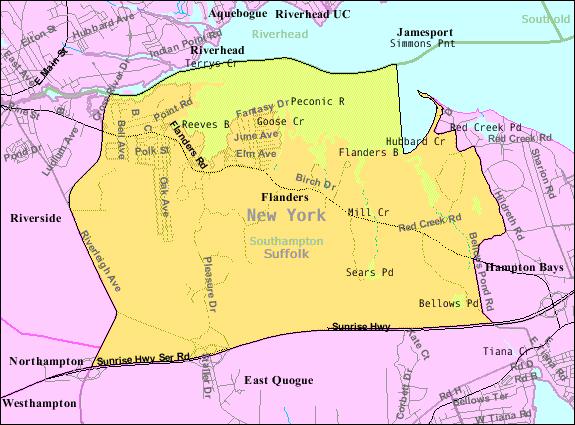
- Poverty rate: 21.0%
- Median household income: $79,100
- 5-yr. avg. unemployment rate: 2.6%
- Adults with a bachelor’s degree or higher: 16.5%
- Population: 6,411
25. Lackawanna

- Poverty rate: 21.5%
- Median household income: $46,869
- 5-yr. avg. unemployment rate: 5.4%
- Adults with a bachelor’s degree or higher: 19.8%
- Population: 19,762
24. Massena

- Poverty rate: 21.6%
- Median household income: $48,161
- 5-yr. avg. unemployment rate: 6.7%
- Adults with a bachelor’s degree or higher: 26.0%
- Population: 10,218
23. Plattsburgh
- Poverty rate: 21.7%
- Median household income: $55,049
- 5-yr. avg. unemployment rate: 6.0%
- Adults with a bachelor’s degree or higher: 39.8%
- Population: 19,907
22. Amsterdam

- Poverty rate: 22.0%
- Median household income: $46,338
- 5-yr. avg. unemployment rate: 9.2%
- Adults with a bachelor’s degree or higher: 19.4%
- Population: 18,244
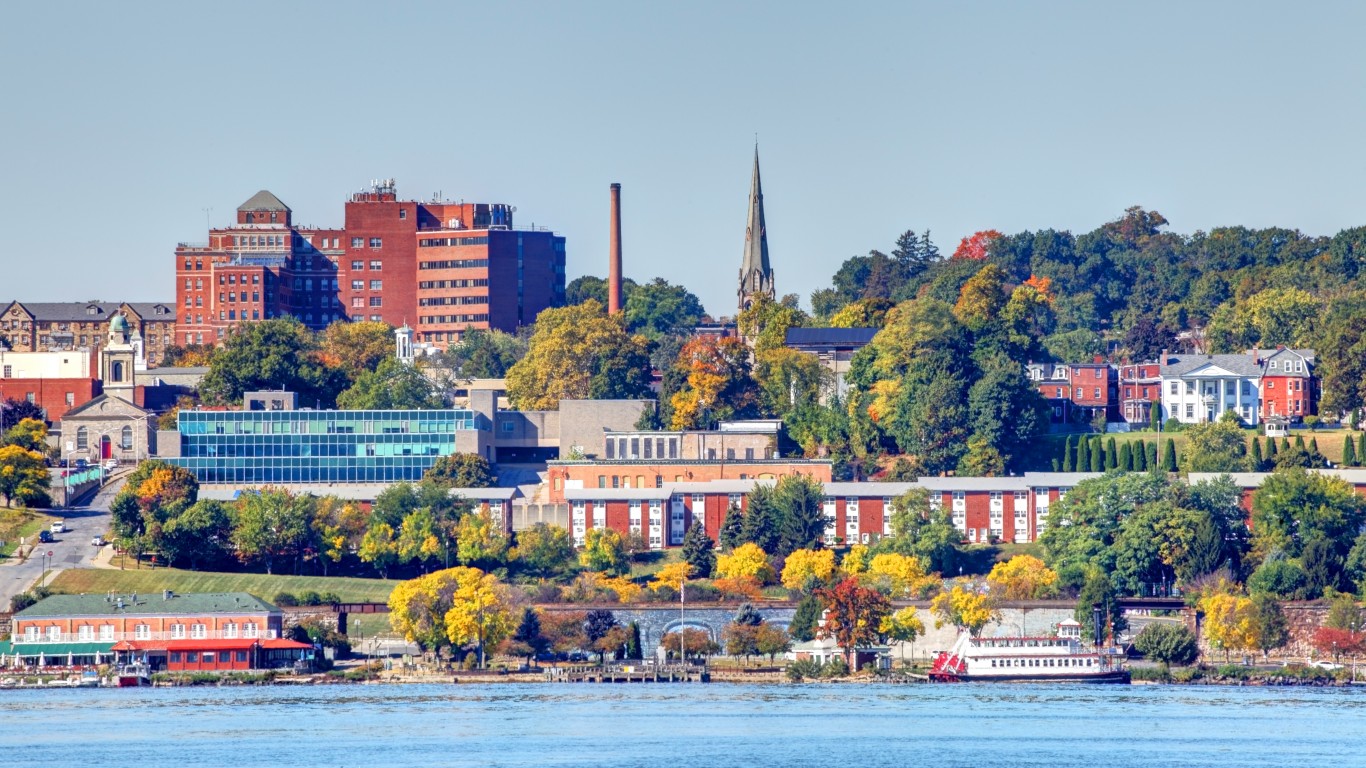
21. Hudson
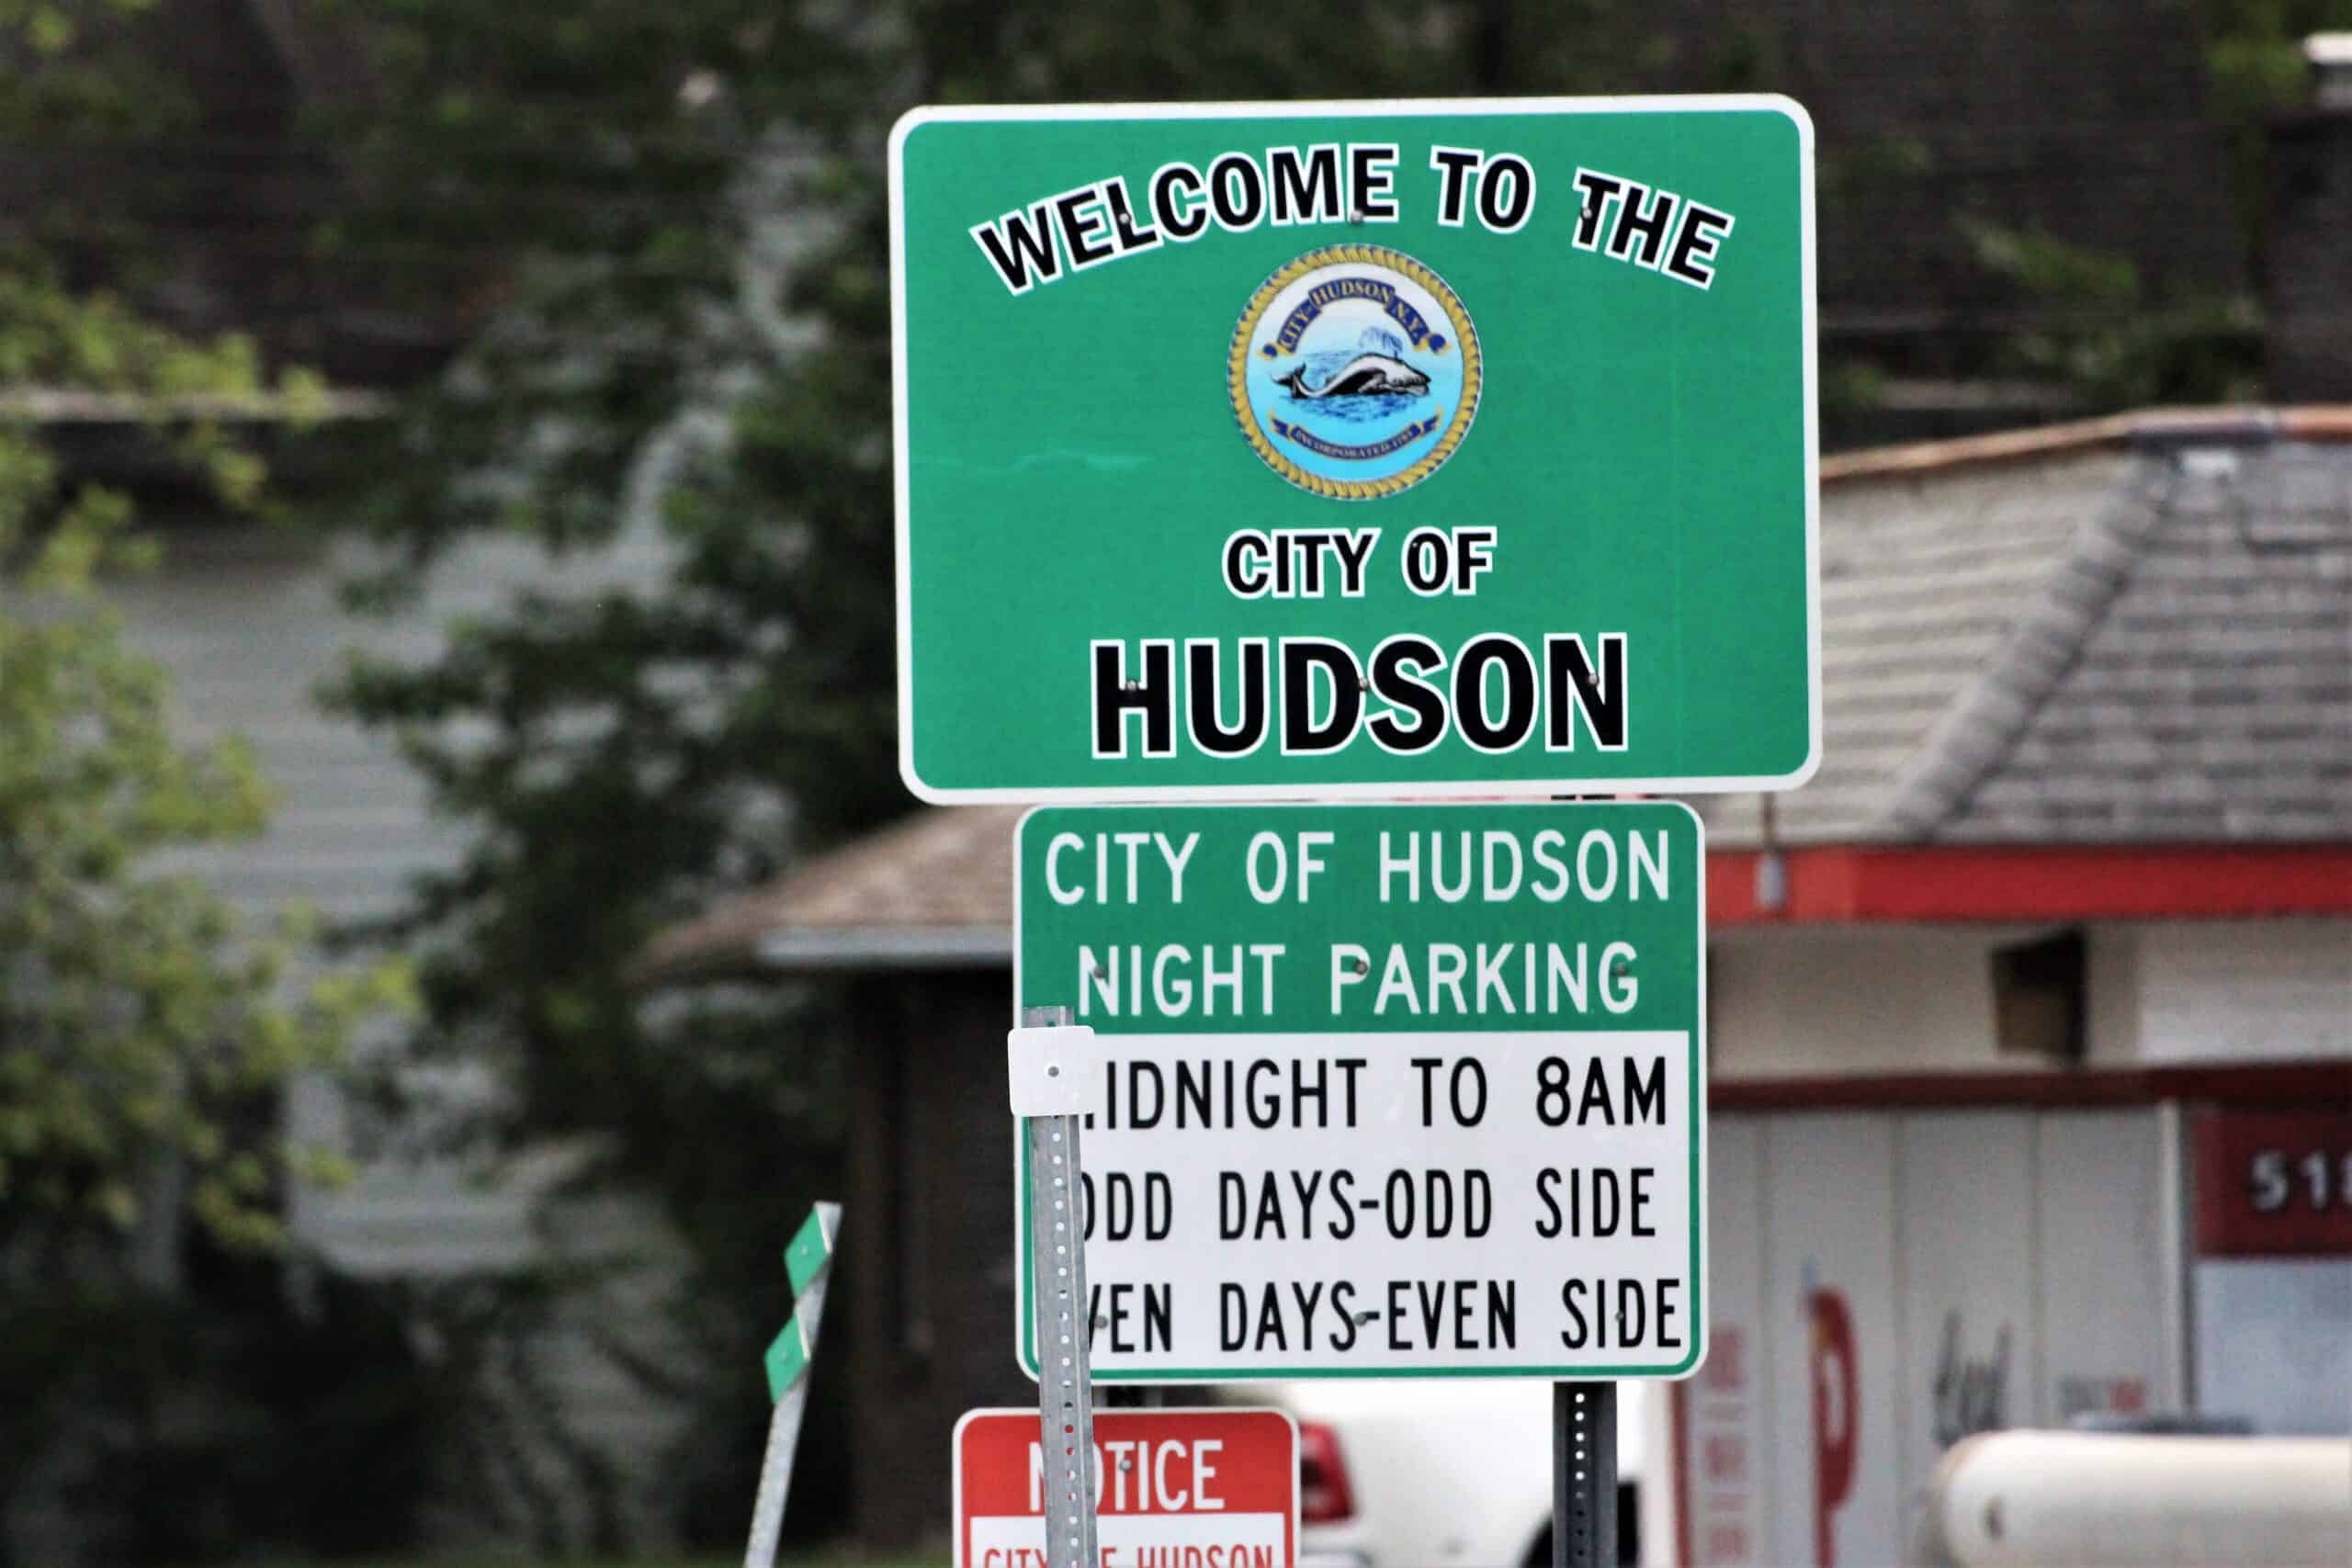
- Poverty rate: 23.3%
- Median household income: $46,293
- 5-yr. avg. unemployment rate: 12.8%
- Adults with a bachelor’s degree or higher: 34.0%
- Population: 5,923
20. Port Jervis

- Poverty rate: 23.6%
- Median household income: $38,804
- 5-yr. avg. unemployment rate: 7.9%
- Adults with a bachelor’s degree or higher: 14.8%
- Population: 8,725
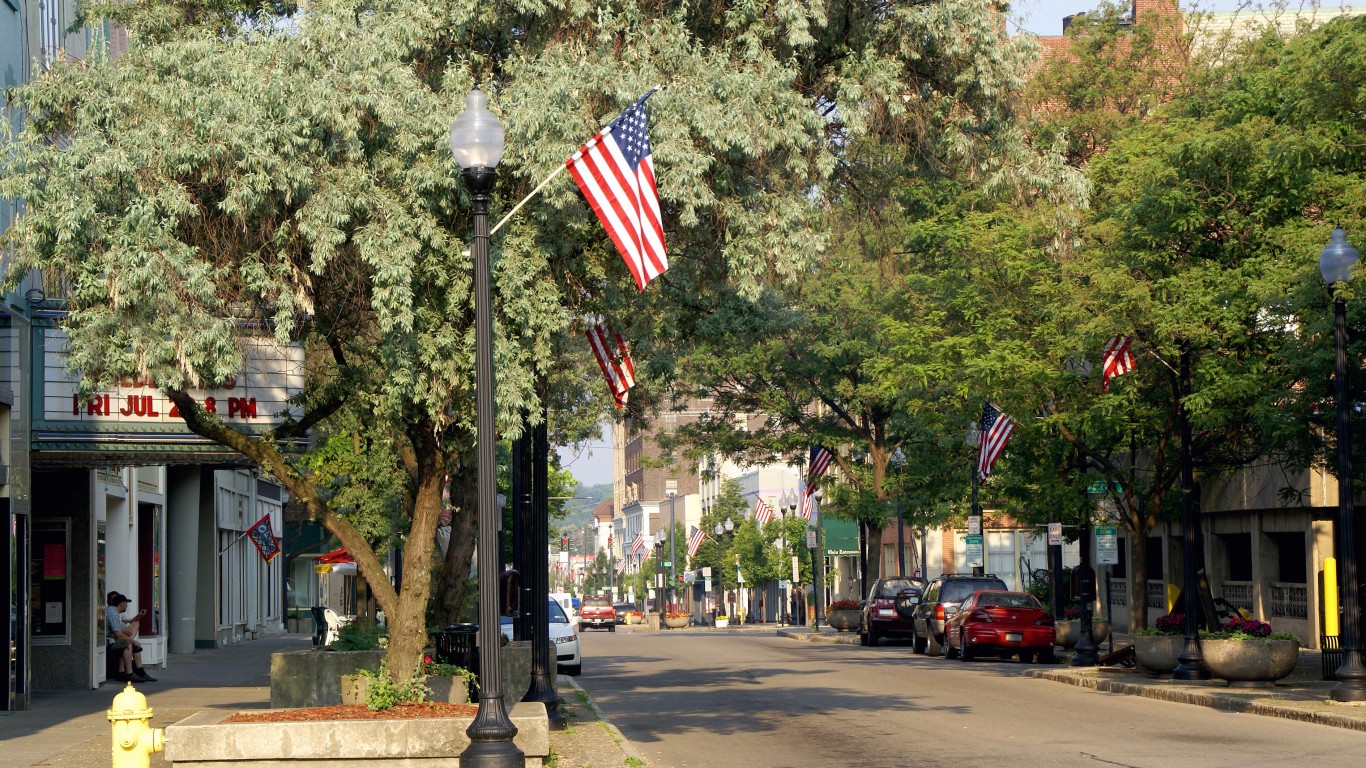
19. Olean

- Poverty rate: 23.8%
- Median household income: $45,078
- 5-yr. avg. unemployment rate: 6.6%
- Adults with a bachelor’s degree or higher: 26.7%
- Population: 13,890
18. Fulton
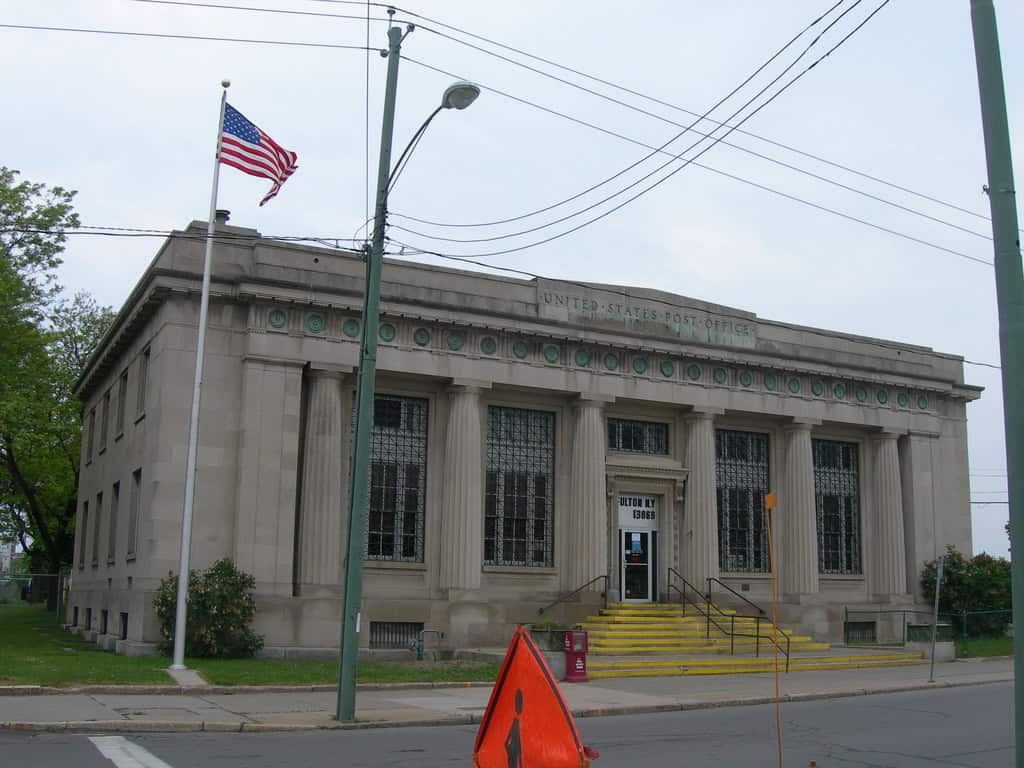
- Poverty rate: 23.9%
- Median household income: $51,243
- 5-yr. avg. unemployment rate: 9.0%
- Adults with a bachelor’s degree or higher: 15.6%
- Population: 11,381
17. Dunkirk

- Poverty rate: 24.9%
- Median household income: $46,800
- 5-yr. avg. unemployment rate: 4.6%
- Adults with a bachelor’s degree or higher: 16.9%
- Population: 12,668
16. Niagara Falls

- Poverty rate: 25.1%
- Median household income: $45,932
- 5-yr. avg. unemployment rate: 9.1%
- Adults with a bachelor’s degree or higher: 22.0%
- Population: 48,502
15. Spring Valley

- Poverty rate: 25.3%
- Median household income: $50,749
- 5-yr. avg. unemployment rate: 5.6%
- Adults with a bachelor’s degree or higher: 18.5%
- Population: 32,963
14. Oswego
- Poverty rate: 25.4%
- Median household income: $50,266
- 5-yr. avg. unemployment rate: 10.6%
- Adults with a bachelor’s degree or higher: 27.8%
- Population: 17,092
13. Viola

- Poverty rate: 25.5%
- Median household income: $93,844
- 5-yr. avg. unemployment rate: 12.5%
- Adults with a bachelor’s degree or higher: 35.3%
- Population: 7,385
12. Monticello

- Poverty rate: 25.6%
- Median household income: $45,531
- 5-yr. avg. unemployment rate: 9.3%
- Adults with a bachelor’s degree or higher: 18.0%
- Population: 7,224
11. Salamanca

- Poverty rate: 25.8%
- Median household income: $38,472
- 5-yr. avg. unemployment rate: 7.8%
- Adults with a bachelor’s degree or higher: 14.2%
- Population: 5,906
10. Malone

- Poverty rate: 26.3%
- Median household income: $49,531
- 5-yr. avg. unemployment rate: 2.7%
- Adults with a bachelor’s degree or higher: 25.7%
- Population: 5,507
9. Newburgh
- Poverty rate: 26.5%
- Median household income: $48,555
- 5-yr. avg. unemployment rate: 7.8%
- Adults with a bachelor’s degree or higher: 19.7%
- Population: 28,751
8. Elmira

- Poverty rate: 27.6%
- Median household income: $41,073
- 5-yr. avg. unemployment rate: 9.8%
- Adults with a bachelor’s degree or higher: 17.1%
- Population: 26,494
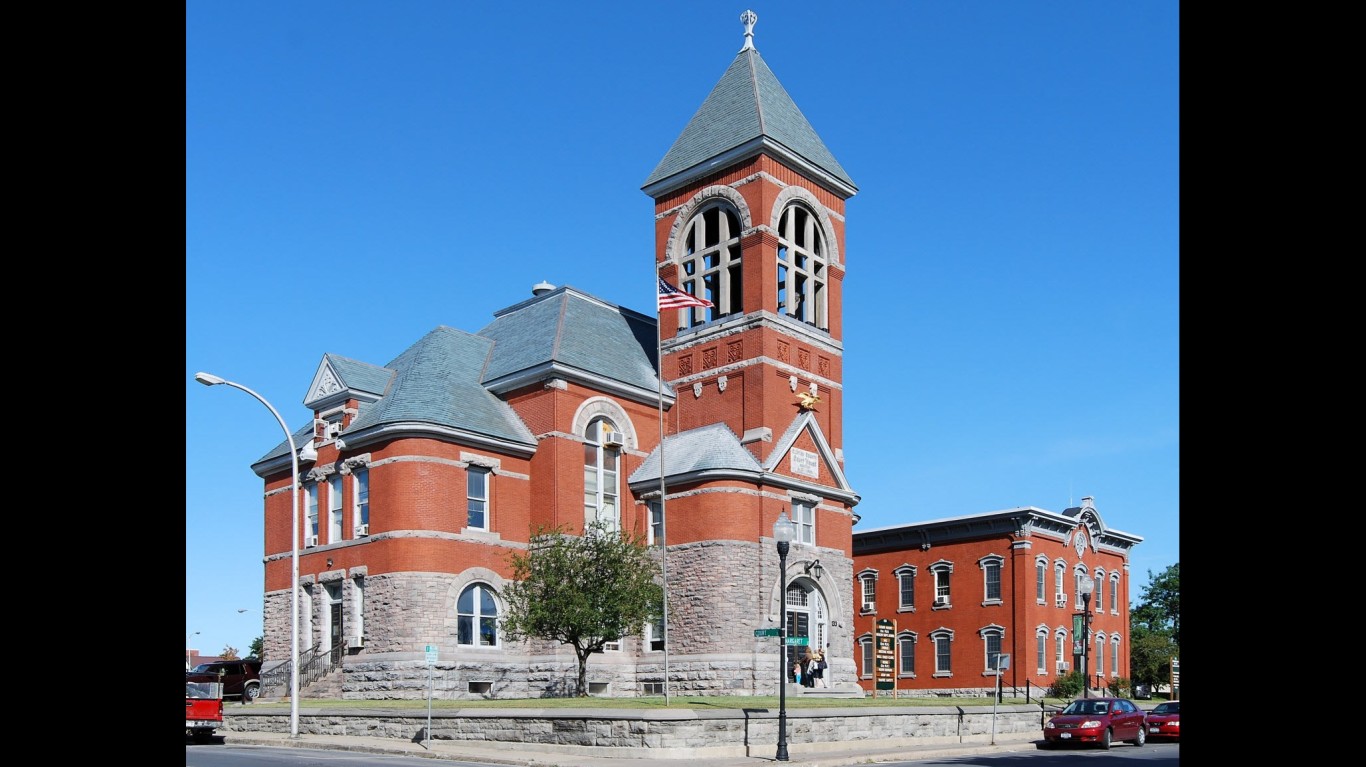
7. Jamestown
- Poverty rate: 28.2%
- Median household income: $39,507
- 5-yr. avg. unemployment rate: 9.1%
- Adults with a bachelor’s degree or higher: 21.0%
- Population: 28,679
6. Endicott

- Poverty rate: 29.5%
- Median household income: $43,509
- 5-yr. avg. unemployment rate: 7.5%
- Adults with a bachelor’s degree or higher: 19.1%
- Population: 13,540
5. Binghamton
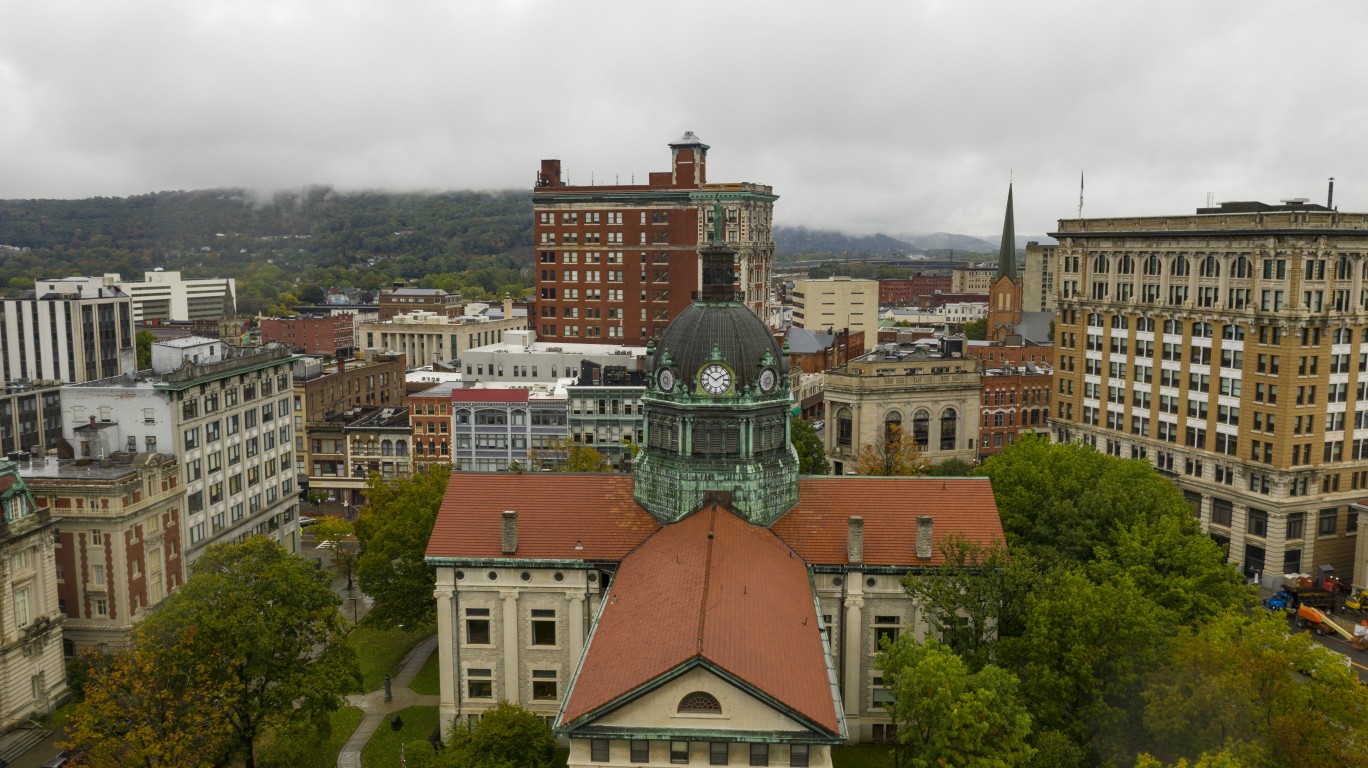
- Poverty rate: 31.7%
- Median household income: $42,031
- 5-yr. avg. unemployment rate: 10.1%
- Adults with a bachelor’s degree or higher: 30.7%
- Population: 47,617
4. Kiryas Joel

- Poverty rate: 43.3%
- Median household income: $40,218
- 5-yr. avg. unemployment rate: 3.4%
- Adults with a bachelor’s degree or higher: 6.3%
- Population: 34,368
3. Monsey
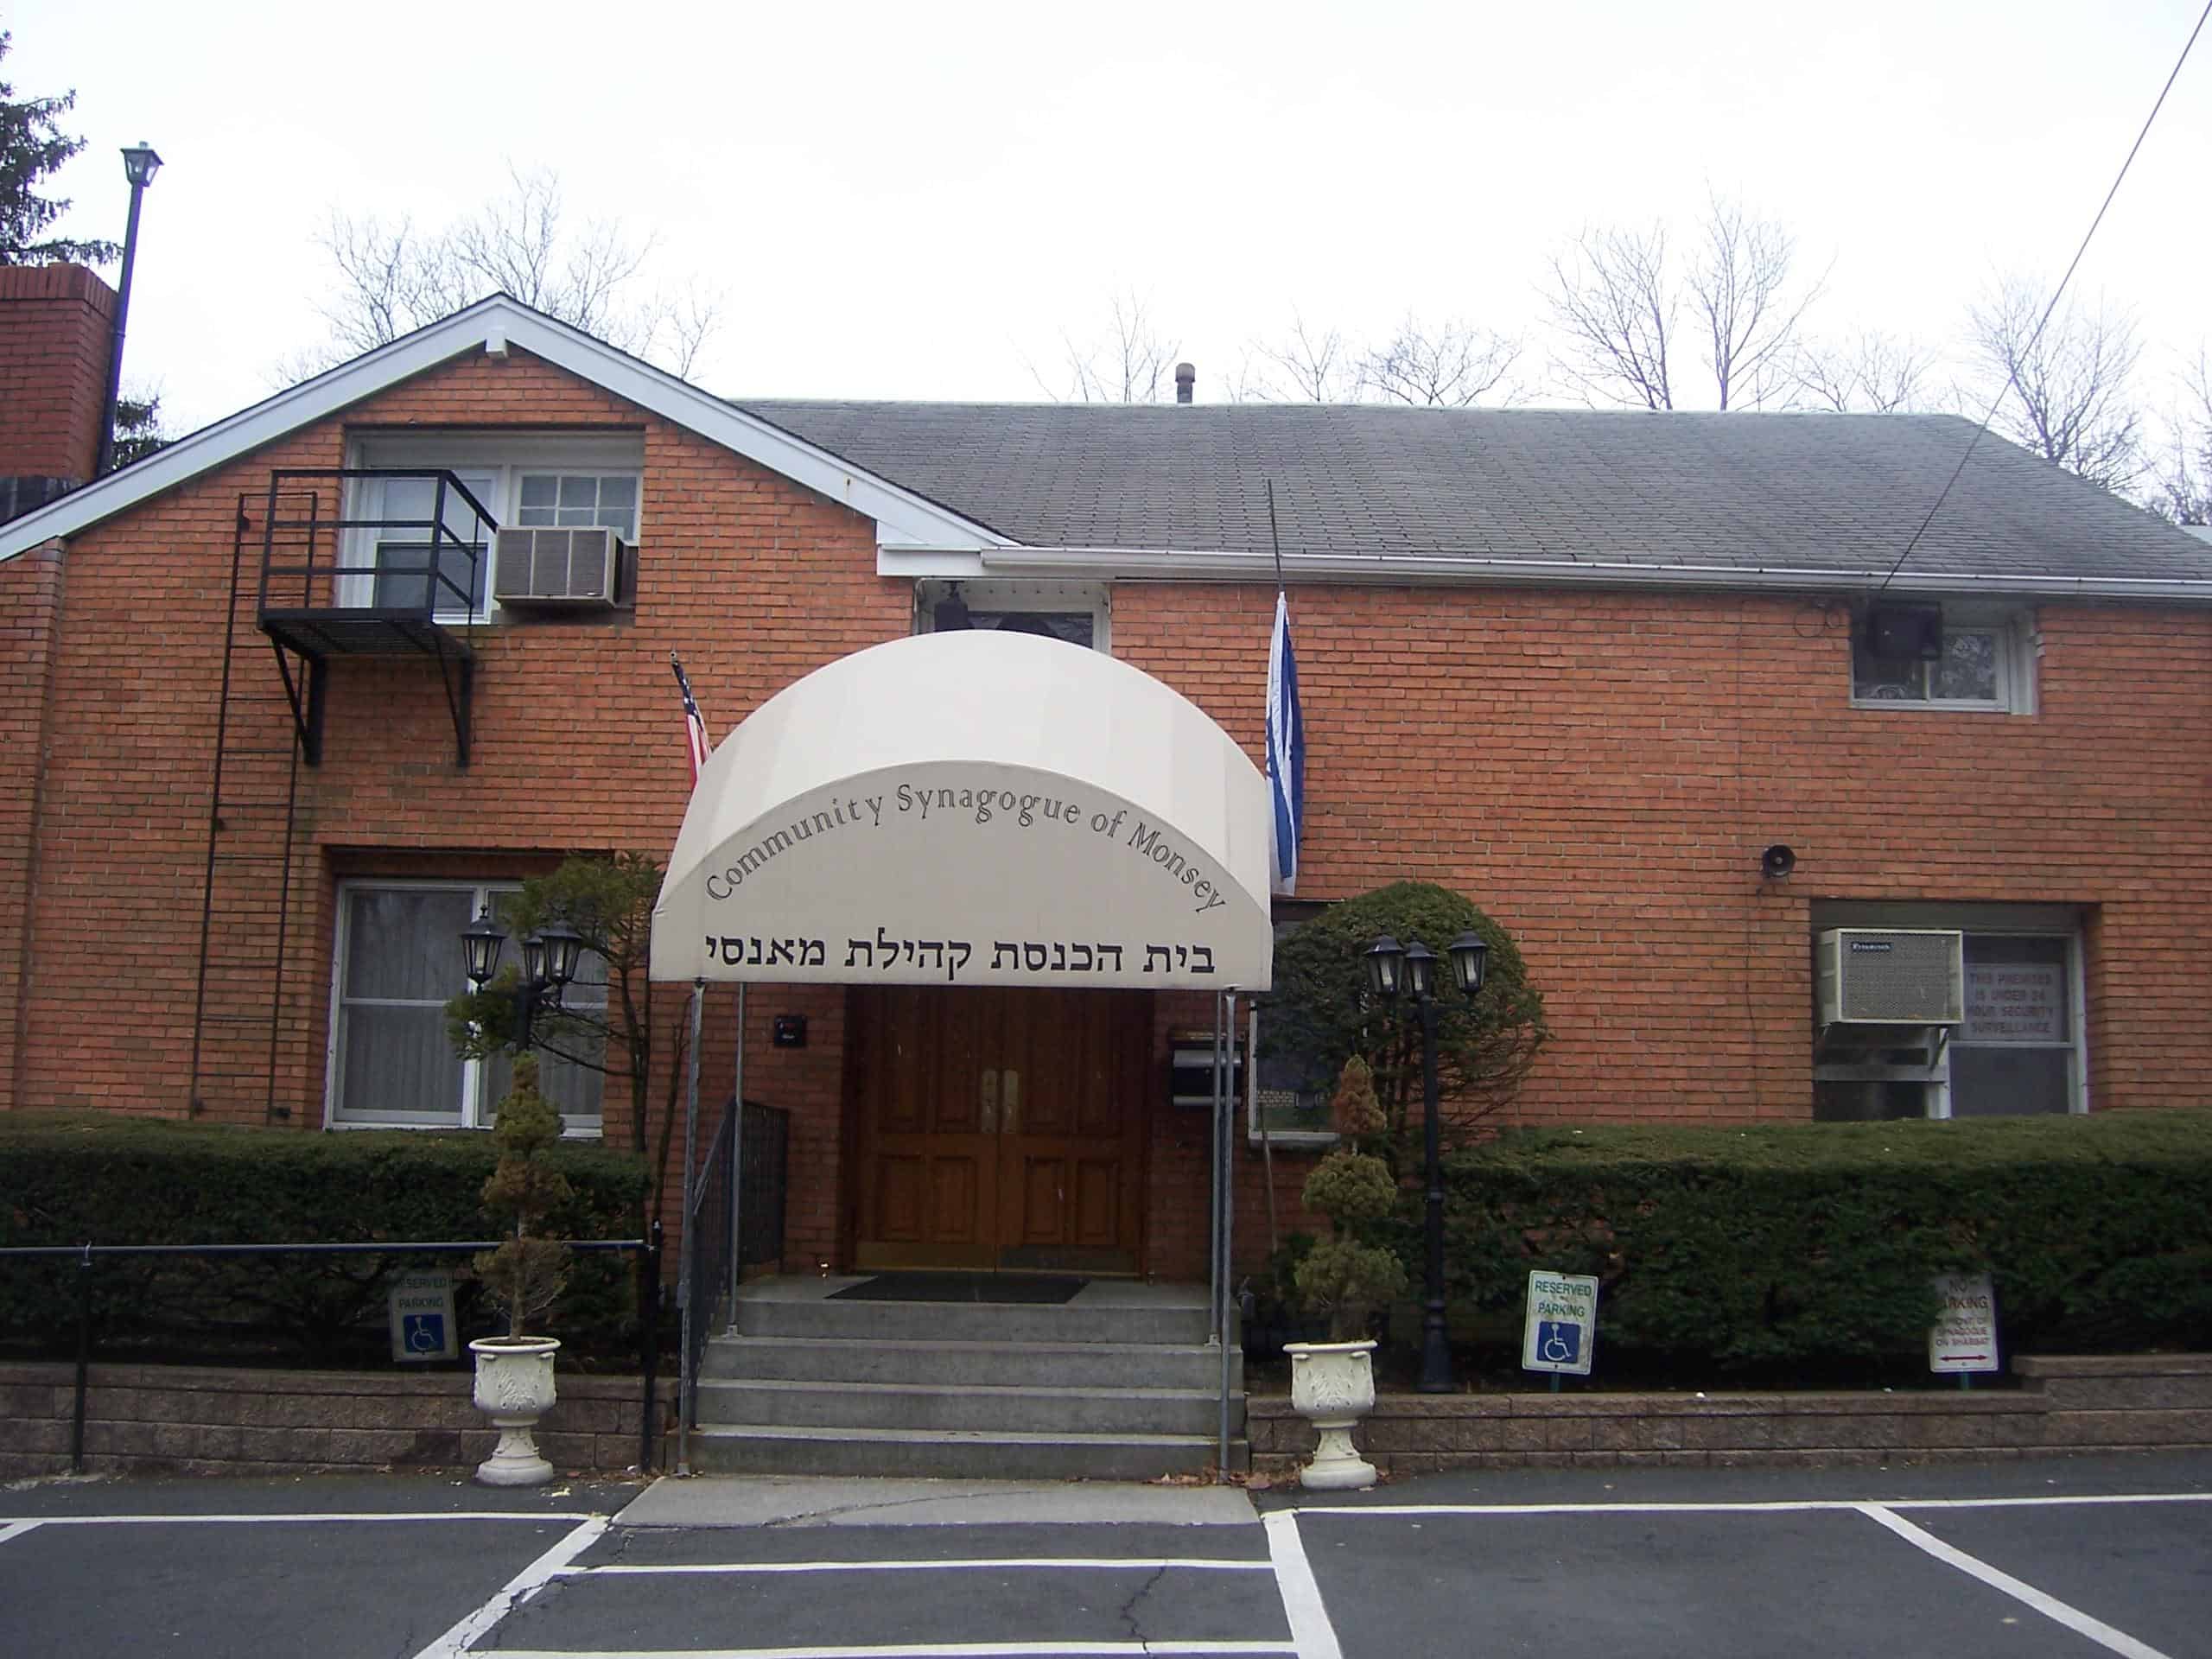
- Poverty rate: 45.8%
- Median household income: $49,630
- 5-yr. avg. unemployment rate: 8.2%
- Adults with a bachelor’s degree or higher: 14.2%
- Population: 28,287
2. Kaser

- Poverty rate: 60.4%
- Median household income: $30,320
- 5-yr. avg. unemployment rate: 7.2%
- Adults with a bachelor’s degree or higher: 5.0%
- Population: 5,501
1. New Square

- Poverty rate: 64.2%
- Median household income: $27,488
- 5-yr. avg. unemployment rate: 8.1%
- Adults with a bachelor’s degree or higher: 2.4%
- Population: 9,578
| Rank | Place | Poverty rate (%) | Median household income ($) | Unemployment rate (%) | Adults with a bachelor’s degree or higher (%) | Total population |
|---|---|---|---|---|---|---|
| 1 | New Square, New York | 64.2 | 27,488 | 8.1 | 2.4 | 9,578 |
| 2 | Kaser, New York | 60.4 | 30,320 | 7.2 | 5.0 | 5,501 |
| 3 | Monsey, New York | 45.8 | 49,630 | 8.2 | 14.2 | 28,287 |
| 4 | Kiryas Joel, New York | 43.3 | 40,218 | 3.4 | 6.3 | 34,368 |
| 5 | Binghamton, New York | 31.7 | 42,031 | 10.1 | 30.7 | 47,617 |
| 6 | Endicott, New York | 29.5 | 43,509 | 7.5 | 19.1 | 13,540 |
| 7 | Jamestown, New York | 28.2 | 39,507 | 9.1 | 21.0 | 28,679 |
| 8 | Elmira, New York | 27.6 | 41,073 | 9.8 | 17.1 | 26,494 |
| 9 | Newburgh, New York | 26.5 | 48,555 | 7.8 | 19.7 | 28,751 |
| 10 | Malone, New York | 26.3 | 49,531 | 2.7 | 25.7 | 5,507 |
| 11 | Salamanca, New York | 25.8 | 38,472 | 7.8 | 14.2 | 5,906 |
| 12 | Monticello, New York | 25.6 | 45,531 | 9.3 | 18.0 | 7,224 |
| 13 | Viola, New York | 25.5 | 93,844 | 12.5 | 35.3 | 7,385 |
| 14 | Oswego, New York | 25.4 | 50,266 | 10.6 | 27.8 | 17,092 |
| 15 | Spring Valley, New York | 25.3 | 50,749 | 5.6 | 18.5 | 32,963 |
| 16 | Niagara Falls, New York | 25.1 | 45,932 | 9.1 | 22.0 | 48,502 |
| 17 | Dunkirk, New York | 24.9 | 46,800 | 4.6 | 16.9 | 12,668 |
| 18 | Fulton, New York | 23.9 | 51,243 | 9.0 | 15.6 | 11,381 |
| 19 | Olean, New York | 23.8 | 45,078 | 6.6 | 26.7 | 13,890 |
| 20 | Port Jervis, New York | 23.6 | 38,804 | 7.9 | 14.8 | 8,725 |
| 21 | Hudson, New York | 23.3 | 46,293 | 12.8 | 34.0 | 5,923 |
| 22 | Amsterdam, New York | 22.0 | 46,338 | 9.2 | 19.4 | 18,244 |
| 23 | Plattsburgh, New York | 21.7 | 55,049 | 6.0 | 39.8 | 19,907 |
| 24 | Massena, New York | 21.6 | 48,161 | 6.7 | 26.0 | 10,218 |
| 25 | Lackawanna, New York | 21.5 | 46,869 | 5.4 | 19.8 | 19,762 |
| 26 | Flanders, New York | 21.0 | 79,100 | 2.6 | 16.5 | 6,411 |
| 27 | Gloversville, New York | 20.7 | 47,205 | 7.2 | 15.3 | 15,113 |
| 28 | Mechanicville, New York | 20.7 | 45,686 | 6.4 | 20.2 | 5,177 |
| 29 | Johnson City, New York | 20.3 | 50,611 | 11.2 | 28.1 | 15,229 |
| 30 | Watervliet, New York | 20.2 | 51,092 | 4.7 | 18.9 | 10,325 |
| 31 | Auburn, New York | 19.9 | 48,203 | 5.9 | 19.1 | 26,674 |
| 32 | Rensselaer, New York | 19.9 | 68,284 | 2.7 | 27.9 | 9,252 |
| 33 | Cohoes, New York | 19.6 | 62,679 | 7.3 | 26.4 | 17,960 |
| 34 | Watertown, New York | 19.5 | 49,722 | 5.8 | 25.3 | 24,859 |
| 35 | Hornell, New York | 18.8 | 47,632 | 8.5 | 16.3 | 8,208 |
Take Charge of Your Retirement In Just A Few Minutes (Sponsor)
Retirement planning doesn’t have to feel overwhelming. The key is finding expert guidance—and SmartAsset’s simple quiz makes it easier than ever for you to connect with a vetted financial advisor.
Here’s how it works:
- Answer a Few Simple Questions. Tell us a bit about your goals and preferences—it only takes a few minutes!
- Get Matched with Vetted Advisors Our smart tool matches you with up to three pre-screened, vetted advisors who serve your area and are held to a fiduciary standard to act in your best interests. Click here to begin
- Choose Your Fit Review their profiles, schedule an introductory call (or meet in person), and select the advisor who feel is right for you.
Why wait? Start building the retirement you’ve always dreamed of. Click here to get started today!
Thank you for reading! Have some feedback for us?
Contact the 24/7 Wall St. editorial team.
Latest from 24/7


Our expert who first called NVIDIA in 2009 is predicting 2025 will see a historic AI breakthrough.
You can follow him investing $500,000 of his own money on our top AI stocks for free.