According to the Federal Reserve’s most recent data, about 18% of American households are millionaires. This percentage rose between 2019 and 2022, despite remaining somewhat consistent over the prior 18-year span. The United States currently reigns as the top country for millionaires (and billionaires too). According to Henley & Partners and New World Wealth’s 2024 USA Wealth Report, the American millionaire population has grown almost twice as fast as China’s over the last five years. In fact, 37% of the world’s millionaires reside in the U.S.
The real estate-focused site, Point2Homes, found that the number of homeowner households that earn at least $1 million more than quadrupled between 2017 and 2022, reaching 136,697 (adding 100,000 households). Of the roughly 320,000 people living in these households, the largest share (37.4%) are Gen Xers, followed by baby boomers (28.9%), and Millennials (19.7%). The typical millionaire owner is a 50-year-old chief executive or physician who owns a $1.8-million, five-bedroom home, and has three cars. He or she likely lives in San Francisco or New York.
24/7 Wall St. reviewed Point2’s report, The Rise of the Millionaire Homeowner: Number of Ultra-Wealthy U.S. Owners Quadruples in 5 Years, to find the cities with the highest concentration of homeowner households making seven figures. Ties were broken by the actual number of such households. Additional data regarding median household income and median home value came from the Census Bureau 2022 American Community Survey.
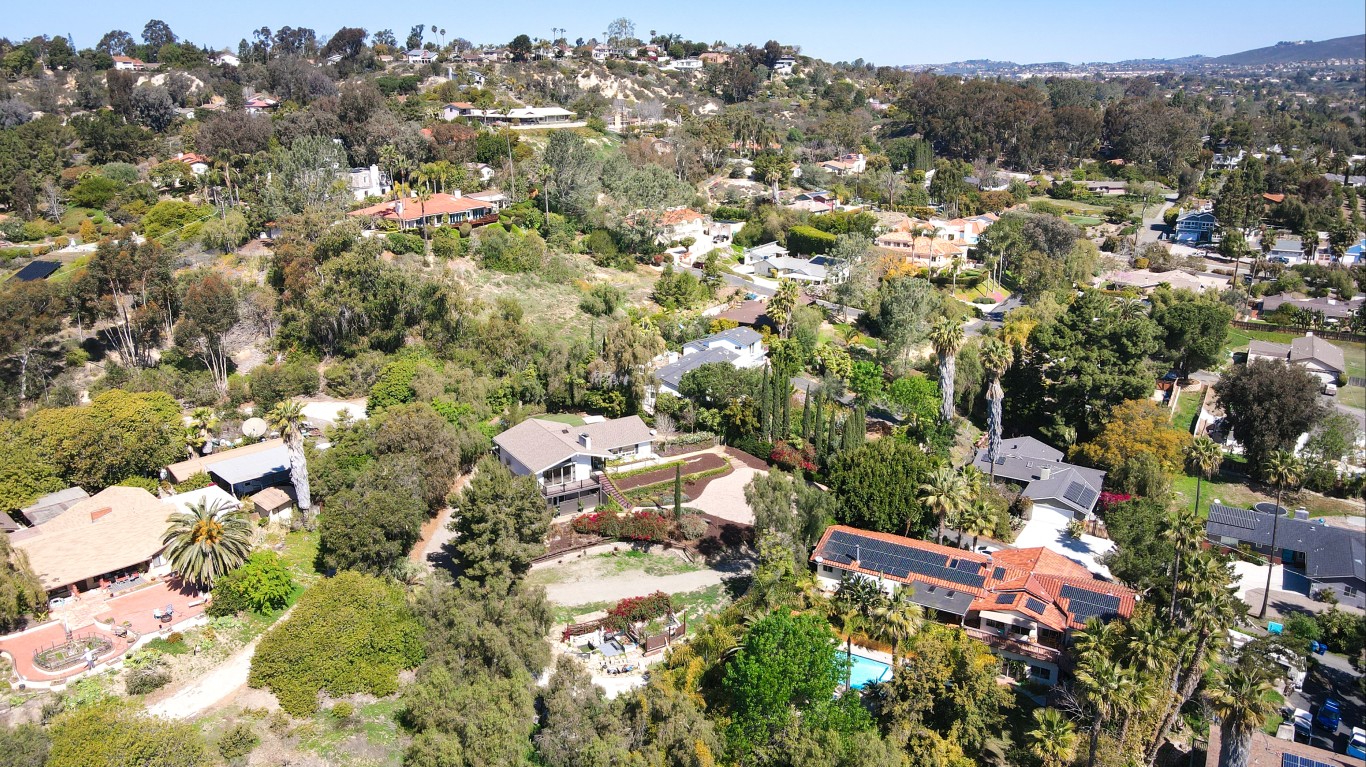
It won’t come as a shock to anyone that many of the cities on this list are large metropolitan areas with expensive, sometimes-massive homes. Six of these 30 cities are in America’s second most costly state: California (beat out only by Hawaii). These include Sacramento, San Bernadino, San Diego, Los Angeles, and San Francisco.
Among the cities on the list, the concentration of homeowner households that make over $1 million ranges from 0.03% of all households in Pittsburgh to 0.49% of all households in San Francisco. Depending on the city, such households typically own homes worth anywhere from nearly $700,000 in Cincinnati to $2.8 million in San Francisco.
The city with the most millionaire owners is by far New York, with over 26,000 millionaire households, followed by Los Angeles with nearly 11,000 households, and San Francisco with nearly 9,000 such households. Boston and Washington D.C. are also in the top five in both the number and concentration of millionaire households.
Why This Matters

Making seven digits a year is likely many Americans’ dream. And considering the significant rise in households making over $1 million in the past five years, this target is more achievable than ever. Understanding where these high-earning households are located can shed light on the health of the local economy and help aspiring millionaires decide where to settle.
30. Pittsburgh, PA

- Homeowner households making at least $1 million: 306 or 0.03% out of all households
- Millionaire households by generation: Millennials: 8.0%; Gen X: 50.6%; Baby boomers: 33.9%
- Main occupation of millionaire households: Chief executives and legislators
- Home values: metro median: $209,800 vs. millionaire avg.: $752,950
- Metro median household income, 2022: $73,596
29. Detroit-Warren-Dearborn, MI
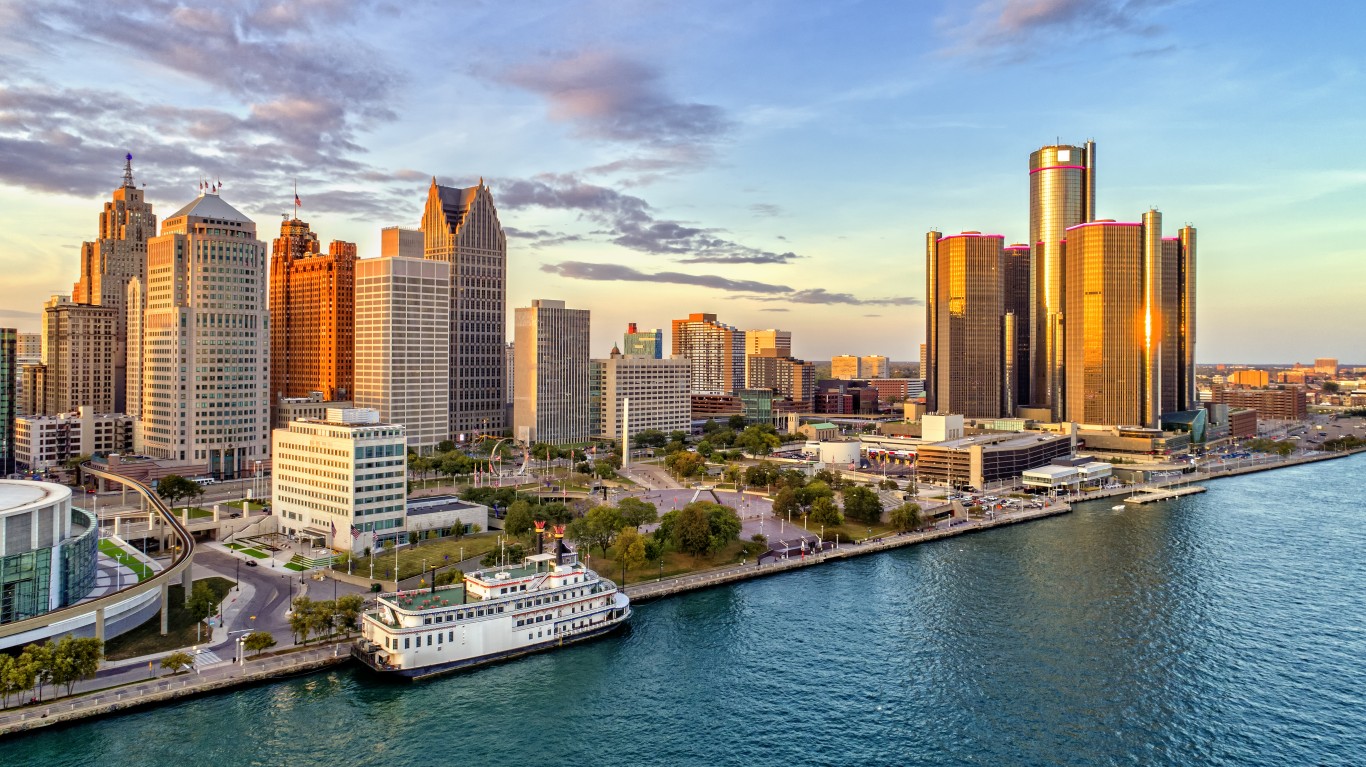
- Homeowner households making at least $1 million: 582 or 0.03% out of all households
- Millionaire households by generation: Millennials: 11.2%; Gen X: 37.8%; Baby boomers: 31.3%
- Main occupation of millionaire households: Physicians
- Home values: metro median: $245,500 vs. millionaire avg.: $1,051,556
- Metro median household income, 2022: $80,879
27. San Antonio-New Braunfels, TX
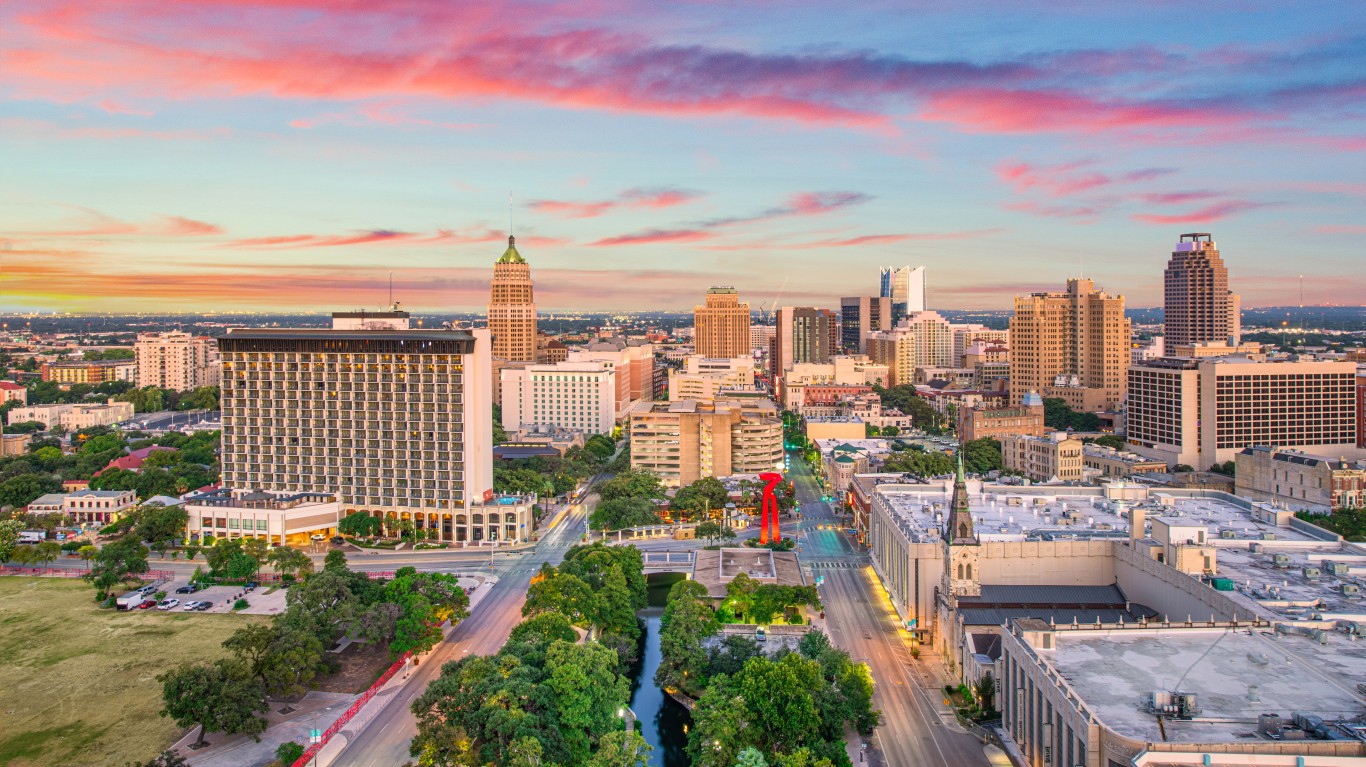
- Homeowner households making at least $1 million: 414 or 0.04% out of all households
- Millionaire households by generation: Millennials: 17.6%; Gen X: 38.4%; Baby boomers: 36.5%
- Main occupation of millionaire households: Physicians
- Home values: metro median: $275,700 vs. millionaire avg.: $968,914
- Metro median household income, 2022: $78,931
26. Phoenix-Mesa-Chandler, AZ
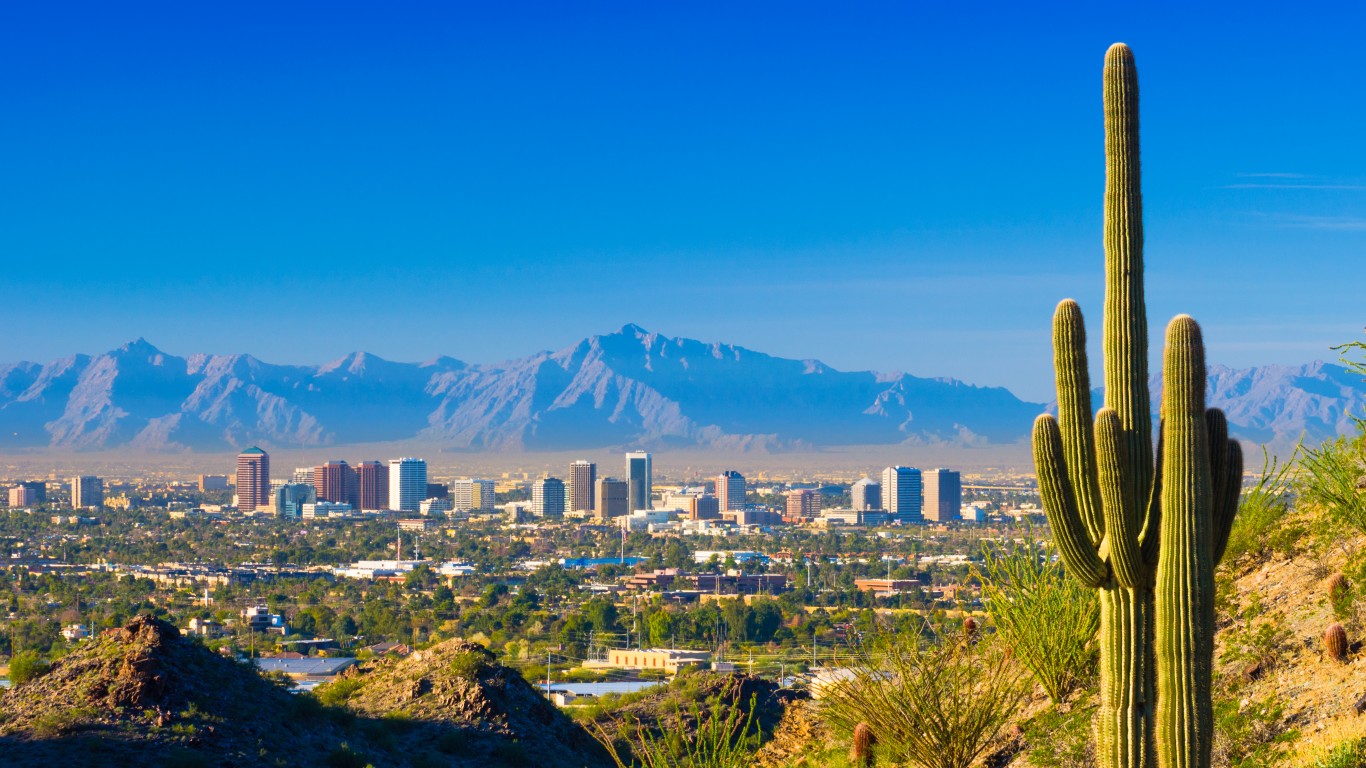
- Homeowner households making at least $1 million: 787 or 0.04% out of all households
- Millionaire households by generation: Millennials: 17.2%; Gen X: 35.5%; Baby boomers: 32.6%
- Main occupation of millionaire households: Physicians
- Home values: metro median: $454,000 vs. millionaire avg.: $1,690,041
- Metro median household income, 2022: $88,279
25. Cincinnati, OH-KY-IN
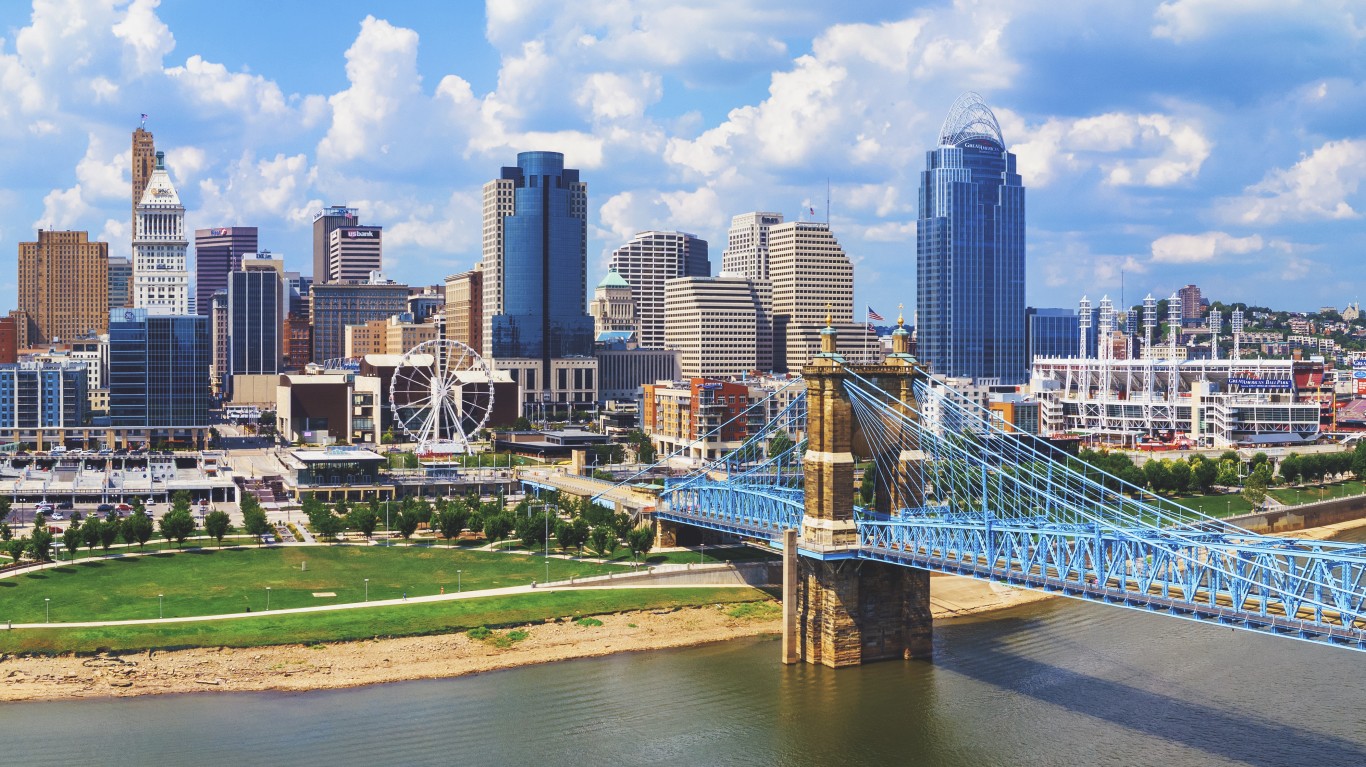
- Homeowner households making at least $1 million: 446 or 0.05% out of all households
- Millionaire households by generation: Millennials: 8.6%; Gen X: 25.9%; Baby boomers: 53.7%
- Main occupation of millionaire households: Physicians
- Home values: metro median: $248,700 vs. millionaire avg.: $692,423
- Metro median household income, 2022: $81,140
24. Portland-Vancouver-Hillsboro, OR-WA

- Homeowner households making at least $1 million: 555 or 0.05% out of all households
- Millionaire households by generation: Millennials: 14.2%; Gen X: 30.1%; Baby boomers: 36.7%
- Main occupation of millionaire households: Physicians
- Home values: metro median: $556,700 vs. millionaire avg.: $1,339,968
- Metro median household income, 2022: $90,889
24. Sacramento-Roseville-Folsom, CA

- Homeowner households making at least $1 million: 549 or 0.06% out of all households
- Millionaire households by generation: Millennials: 11.9%; Gen X: 31.0%; Baby boomers: 45.1%
- Main occupation of millionaire households: Physicians
- Home values: metro median: $584,200 vs. millionaire avg.: $1,492,944
- Metro median household income, 2022: $94,123
23. Charlotte-Concord-Gastonia, NC-SC
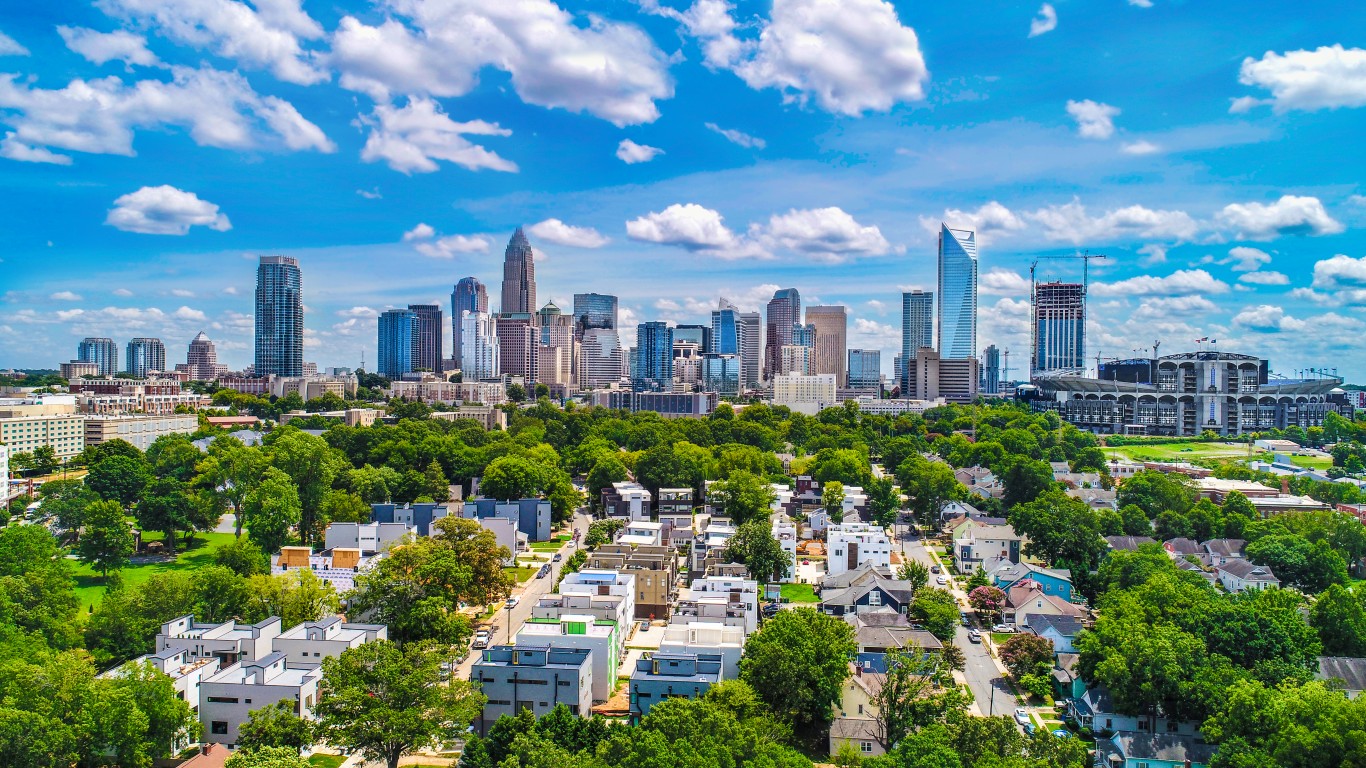
- Homeowner households making at least $1 million: 785 or 0.07% out of all households
- Millionaire households by generation: Millennials: 12.4%; Gen X: 39.0%; Baby boomers: 43.0%
- Main occupation of millionaire households: Other engineers
- Home values: metro median: $352,000 vs. millionaire avg.: $1,227,991
- Metro median household income, 2022: $86,638
22. St. Louis, MO-IL

- Homeowner households making at least $1 million: 828 or 0.07% out of all households
- Millionaire households by generation: Millennials: 11.7%; Gen X: 50.6%; Baby boomers: 14.4%
- Main occupation of millionaire households: Physicians
- Home values: metro median: $237,700 vs. millionaire avg.: $1,222,667
- Metro median household income, 2022: $82,611
21. Riverside-San Bernardino-Ontario, CA

- Homeowner households making at least $1 million: 979 or 0.07% out of all households
- Millionaire households by generation: Millennials: 18.7%; Gen X: 27.1%; Baby boomers: 40.6%
- Main occupation of millionaire households: Chief executives and legislators
- Home values: metro median: $534,900 vs. millionaire avg.: $1,649,873
- Metro median household income, 2022: $87,574
20. Austin-Round Rock-Georgetown, TX

- Homeowner households making at least $1 million: 749 or 0.08% out of all households
- Millionaire households by generation: Millennials: 30.8%; Gen X: 34.9%; Baby boomers: 26.4%
- Main occupation of millionaire households: Chief executives and legislators
- Home values: metro median: $490,000 vs. millionaire avg.: $1,573,600
- Metro median household income, 2022: $100,378
19. Minneapolis-St. Paul-Bloomington, MN-WI
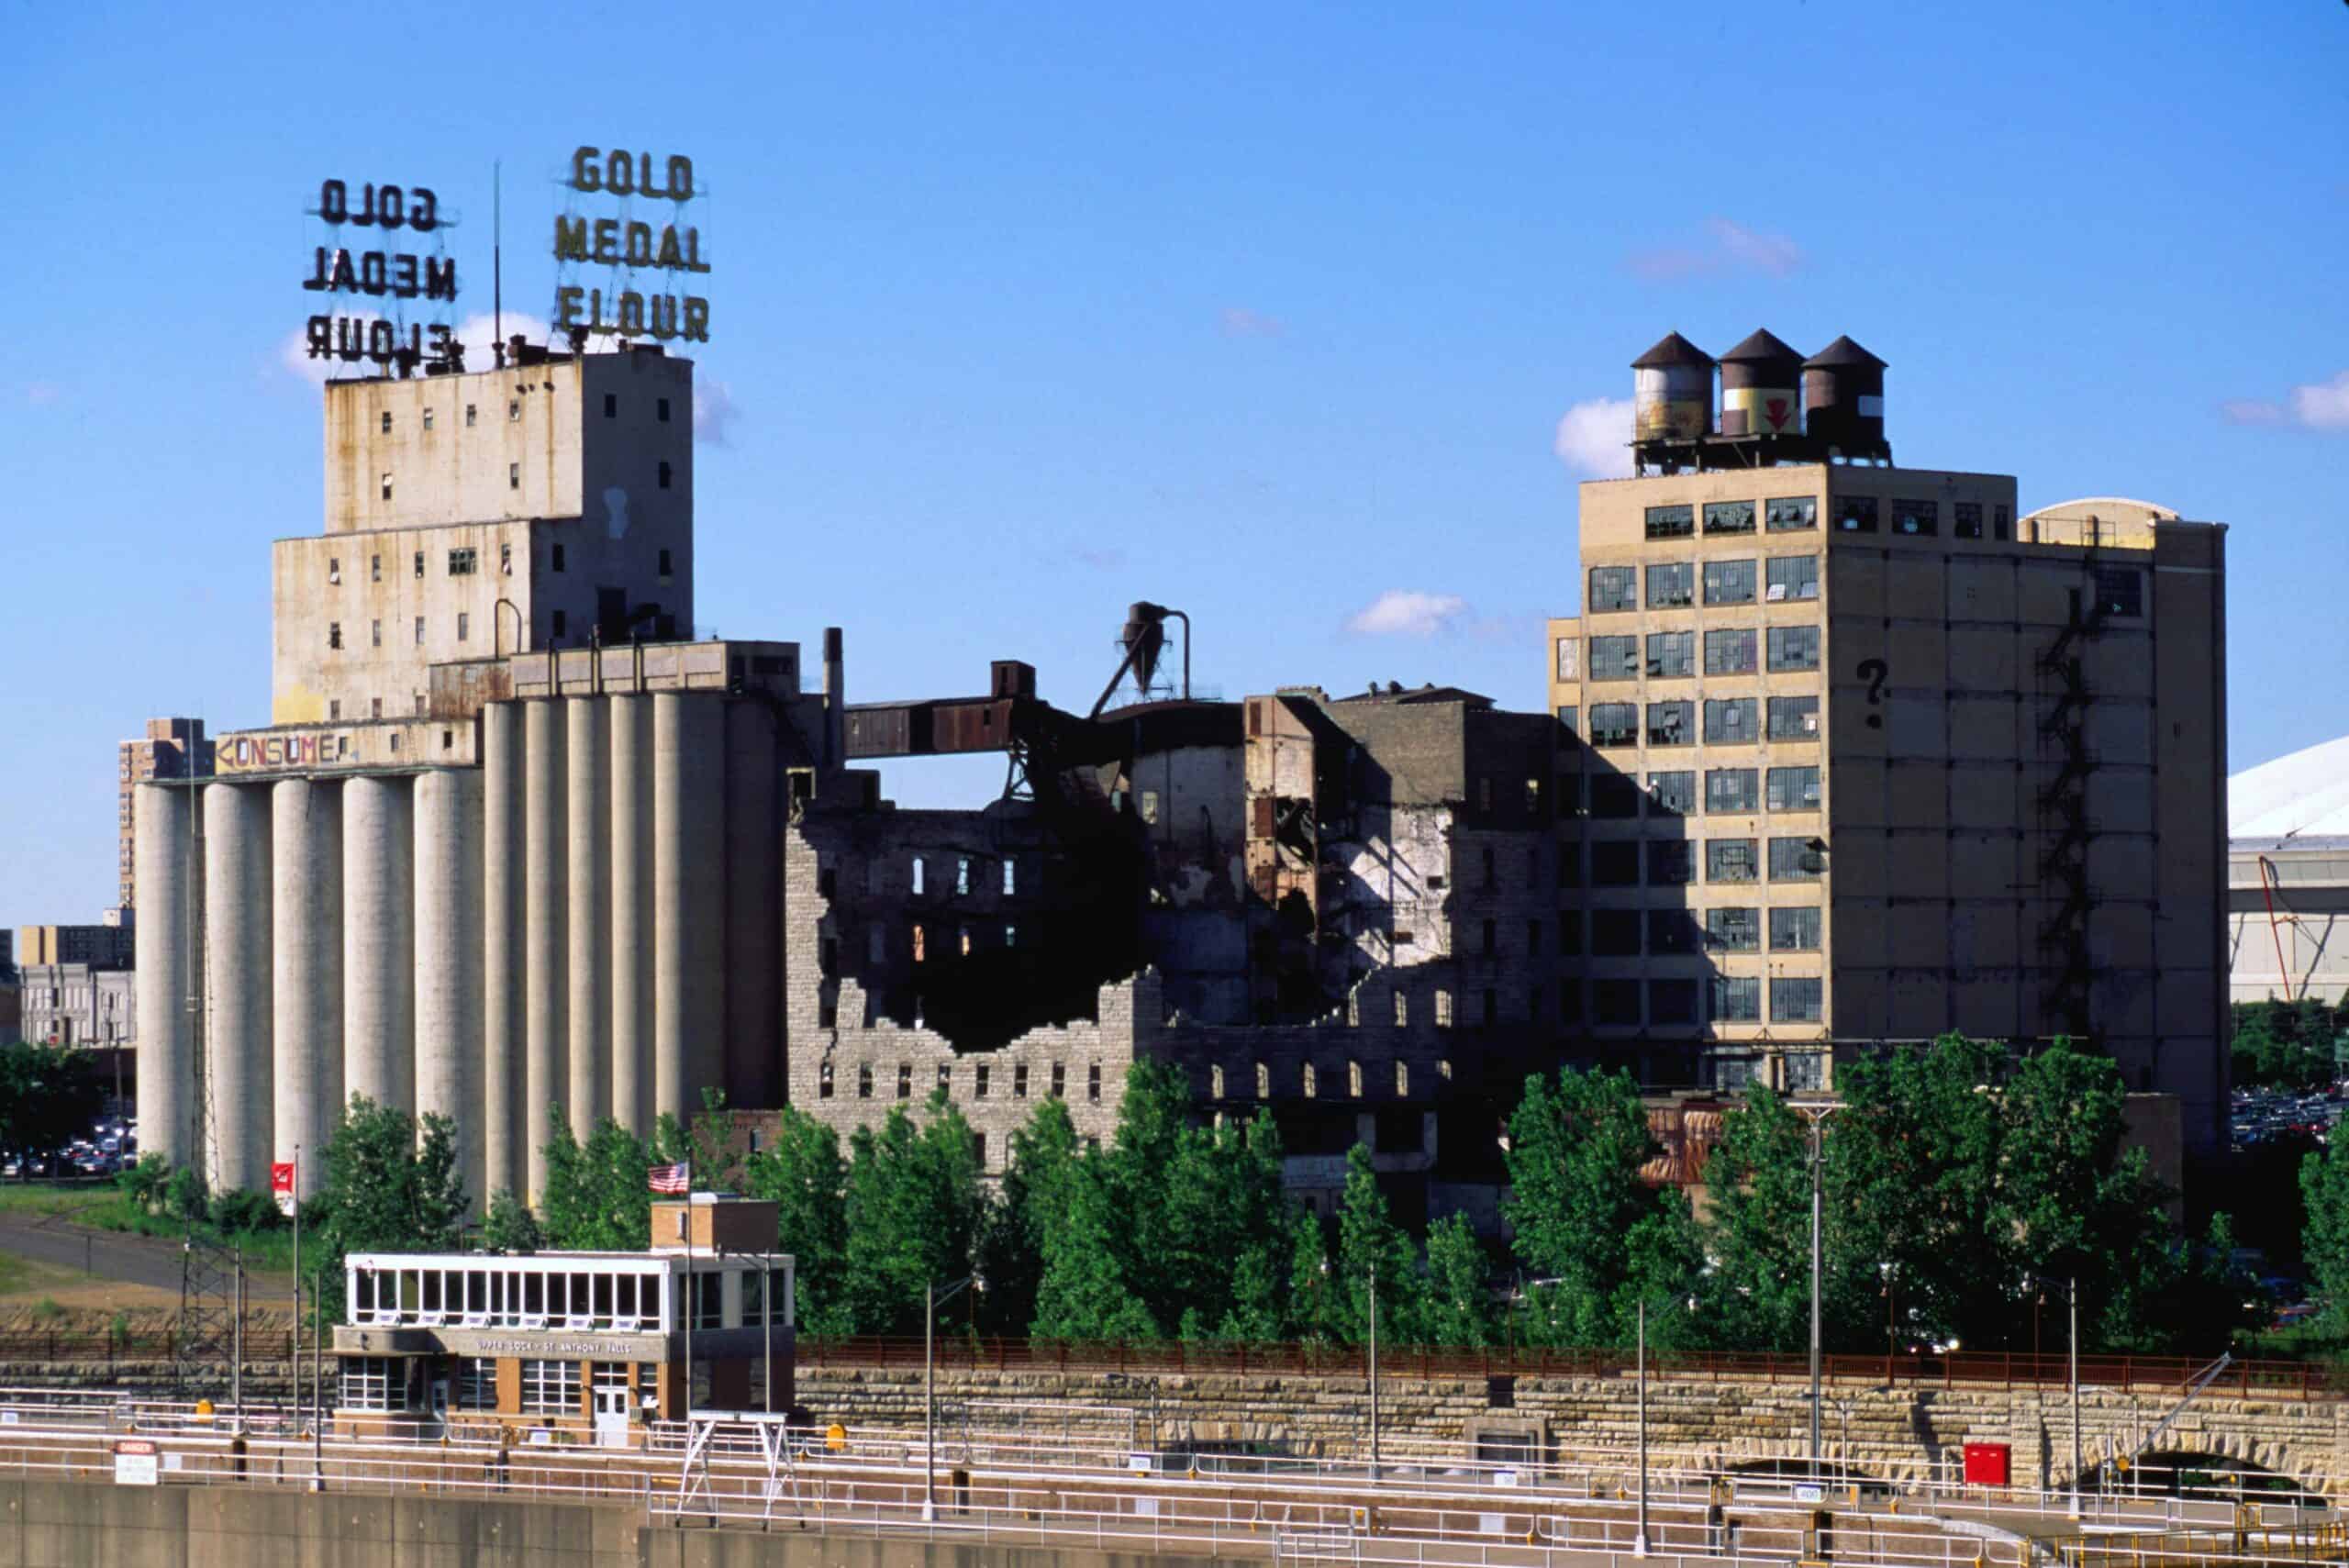
- Homeowner households making at least $1 million: 1,201 or 0.08% out of all households
- Millionaire households by generation: Millennials: 22.3%; Gen X: 40.7%; Baby boomers: 20.5%
- Main occupation of millionaire households: Chief executives and legislators
- Home values: metro median: $359,800 vs. millionaire avg.: $1,136,043
- Metro median household income, 2022: $96,945
18. Philadelphia-Camden-Wilmington, PA-NJ-DE-MD
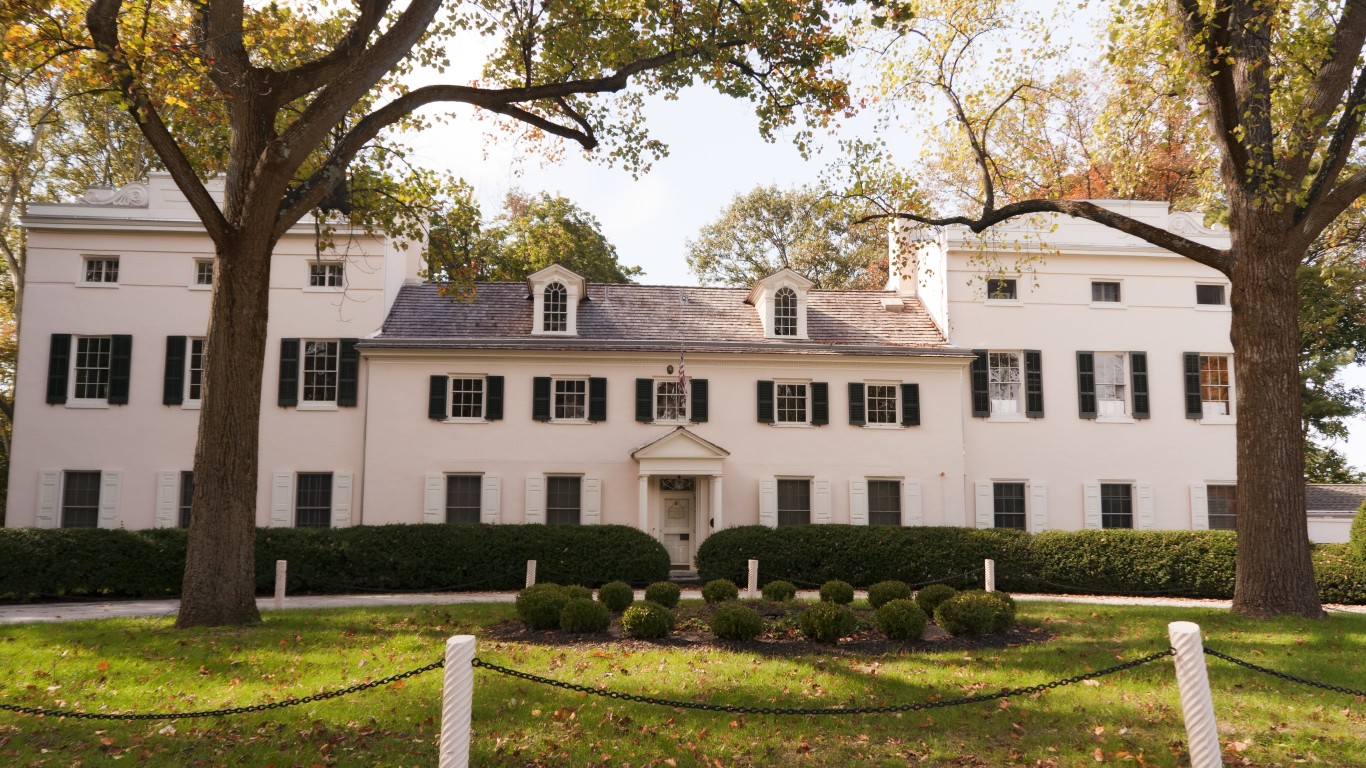
- Homeowner households making at least $1 million: 2,128 or 0.08% out of all households
- Millionaire households by generation: Millennials: 11.9%; Gen X: 40.9%; Baby boomers: 30.1%
- Main occupation of millionaire households: Physicians
- Home values: metro median: $332,600 vs. millionaire avg.: $1,071,193
- Metro median household income, 2022: $100,032
16. Atlanta-Sandy Springs-Alpharetta, GA
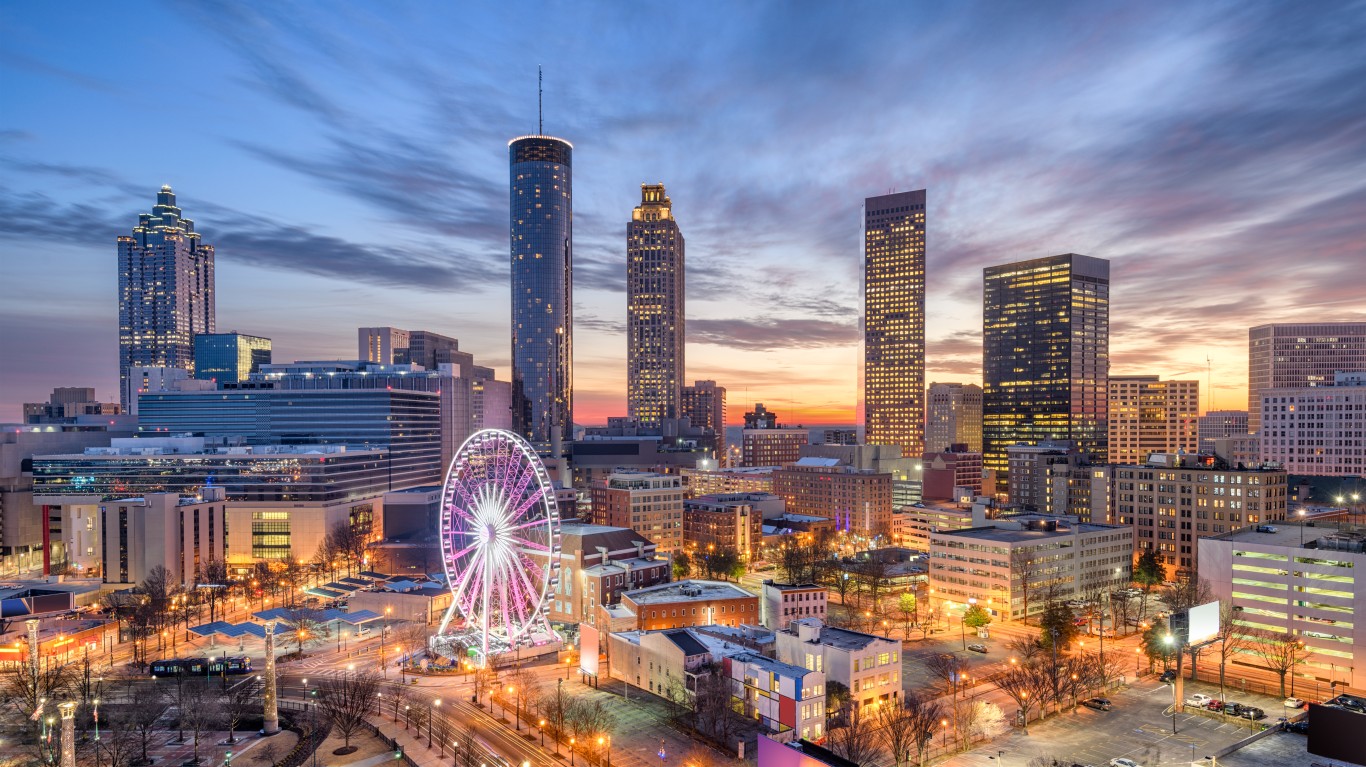
- Homeowner households making at least $1 million: 2,110 or 0.09% out of all households
- Millionaire households by generation: Millennials: 20.4%; Gen X: 48.2%; Baby boomers: 22.5%
- Main occupation of millionaire households: Chief executives and legislators
- Home values: metro median: $362,600 vs. millionaire avg.: $1,263,135
- Metro median household income, 2022: $99,405
15. Dallas-Fort Worth-Arlington, TX
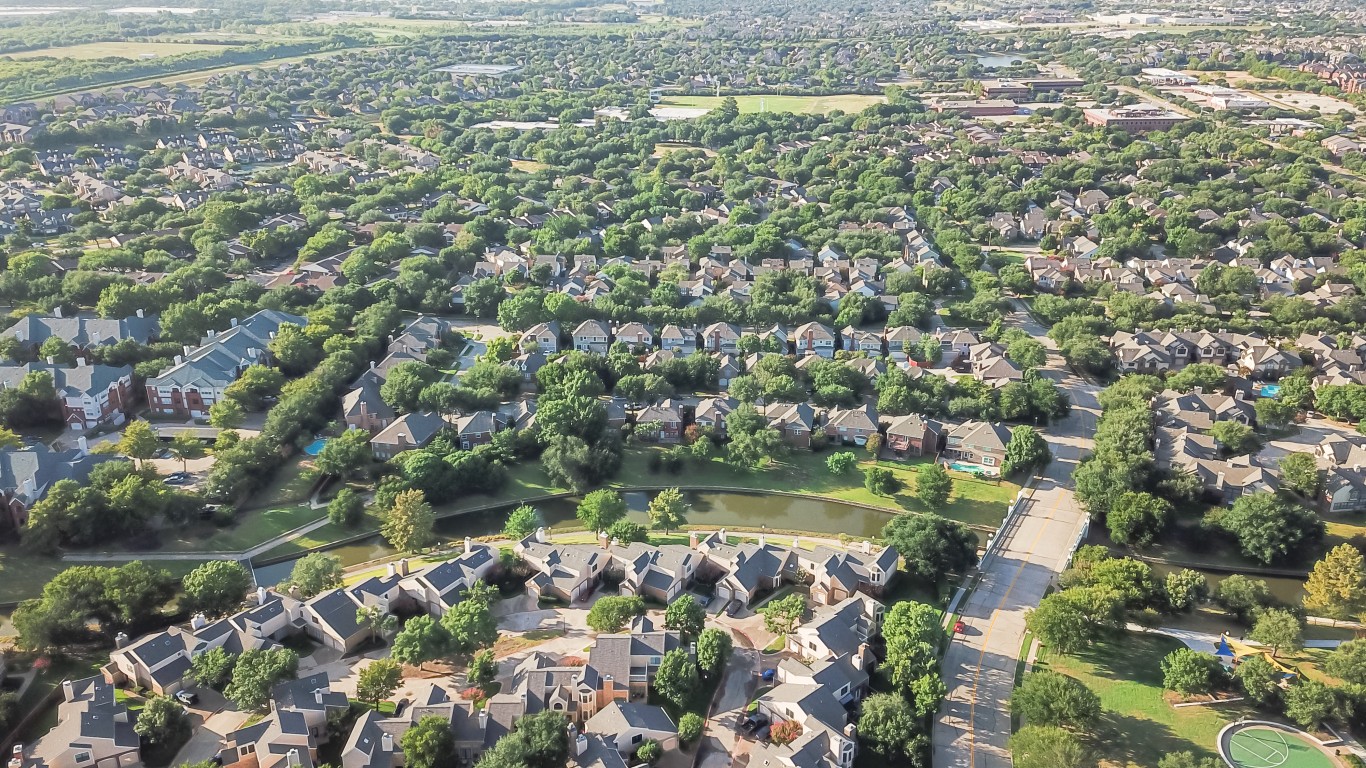
- Homeowner households making at least $1 million: 2,648 or 0.09% out of all households
- Millionaire households by generation: Millennials: 19.3%; Gen X: 44.1%; Baby boomers: 24.7%
- Main occupation of millionaire households: Chief executives and legislators
- Home values: metro median: $349,500 vs. millionaire avg.: $1,402,167
- Metro median household income, 2022: $95,220
15. Las Vegas-Henderson-Paradise, NV

- Homeowner households making at least $1 million: 871 or 0.10% out of all households
- Millionaire households by generation: Millennials: 17.5%; Gen X: 41.5%; Baby boomers: 23.5%
- Main occupation of millionaire households: Physicians
- Home values: metro median: $432,300 vs. millionaire avg.: $1,127,358
- Metro median household income, 2022: $77,939
14. Orlando-Kissimmee-Sanford, FL

- Homeowner households making at least $1 million: 997 or 0.10% out of all households
- Millionaire households by generation: Millennials: 8.1%; Gen X: 37.1%; Baby boomers: 40.7%
- Main occupation of millionaire households: Chief executives and legislators
- Home values: metro median: $361,100 vs. millionaire avg.: $1,728,810
- Metro median household income, 2022: $80,684
13. Tampa-St. Petersburg-Clearwater, FL
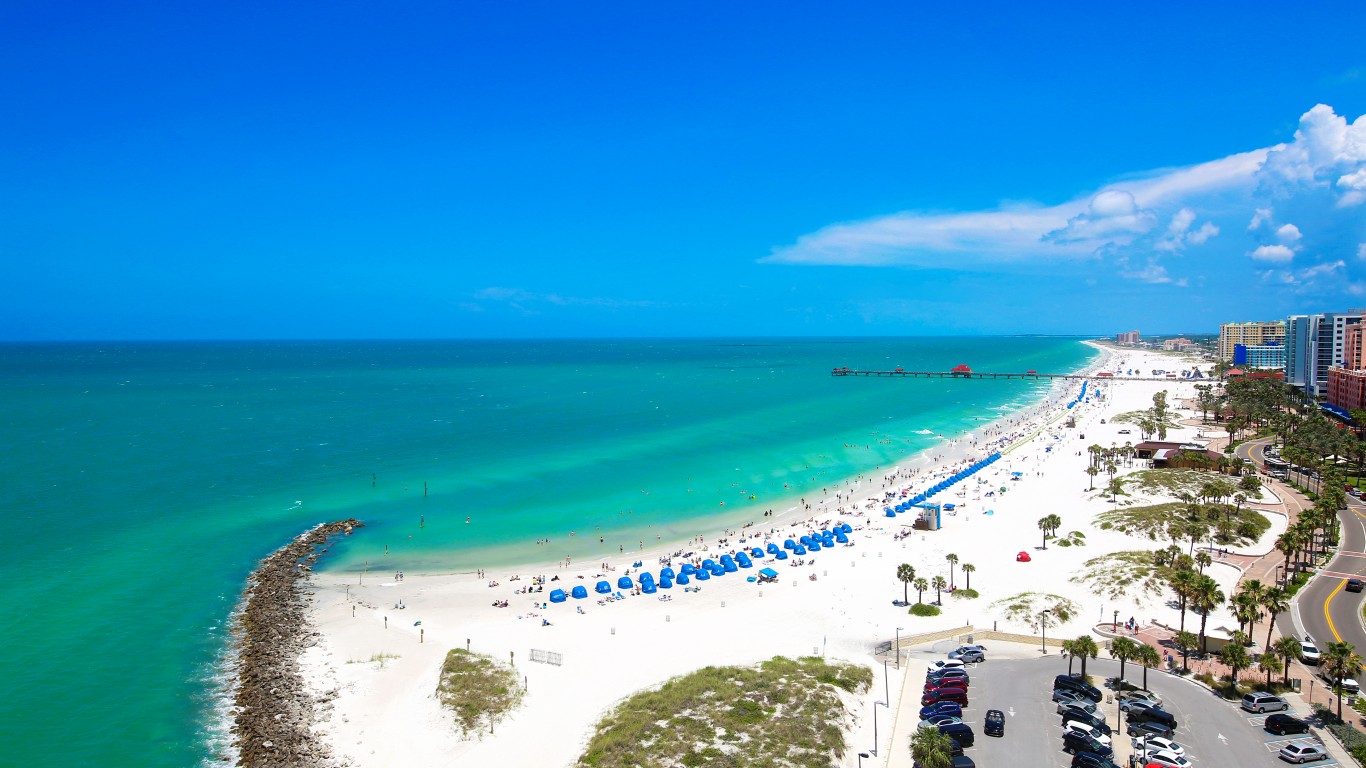
- Homeowner households making at least $1 million: 1,346 or 0.10% out of all households
- Millionaire households by generation: Millennials: 14.0%; Gen X: 41.8%; Baby boomers: 35.7%
- Main occupation of millionaire households: Other managers
- Home values: metro median: $344,400 vs. millionaire avg.: $1,700,049
- Metro median household income, 2022: $72,634
12. Baltimore-Columbia-Towson, MD

- Homeowner households making at least $1 million: 1,228 or 0.11% out of all households
- Millionaire households by generation: Millennials: 10.2%; Gen X: 35.6%; Baby boomers: 34.4%
- Main occupation of millionaire households: Physicians
- Home values: metro median: $371,200 vs. millionaire avg.: $1,058,444
- Metro median household income, 2022: $108,268
11. Houston-The Woodlands-Sugar Land, TX

- Homeowner households making at least $1 million: 2,863 or 0.11% out of all households
- Millionaire households by generation: Millennials: 21.5%; Gen X: 32.9%; Baby boomers: 28.9%
- Main occupation of millionaire households: Physicians
- Home values: metro median: $284,100 vs. millionaire avg.: $1,466,682
- Metro median household income, 2022: $92,476
10. Denver-Aurora-Lakewood, CO

- Homeowner households making at least $1 million: 1,426 or 0.12% out of all households
- Millionaire households by generation: Millennials: 29.2%; Gen X: 39.6%; Baby boomers: 22.6%
- Main occupation of millionaire households: Chief executives and legislators
- Home values: metro median: $596,800 vs. millionaire avg.: $1,534,607
- Metro median household income, 2022: $105,769
9. Chicago-Naperville-Elgin, IL-IN-WI
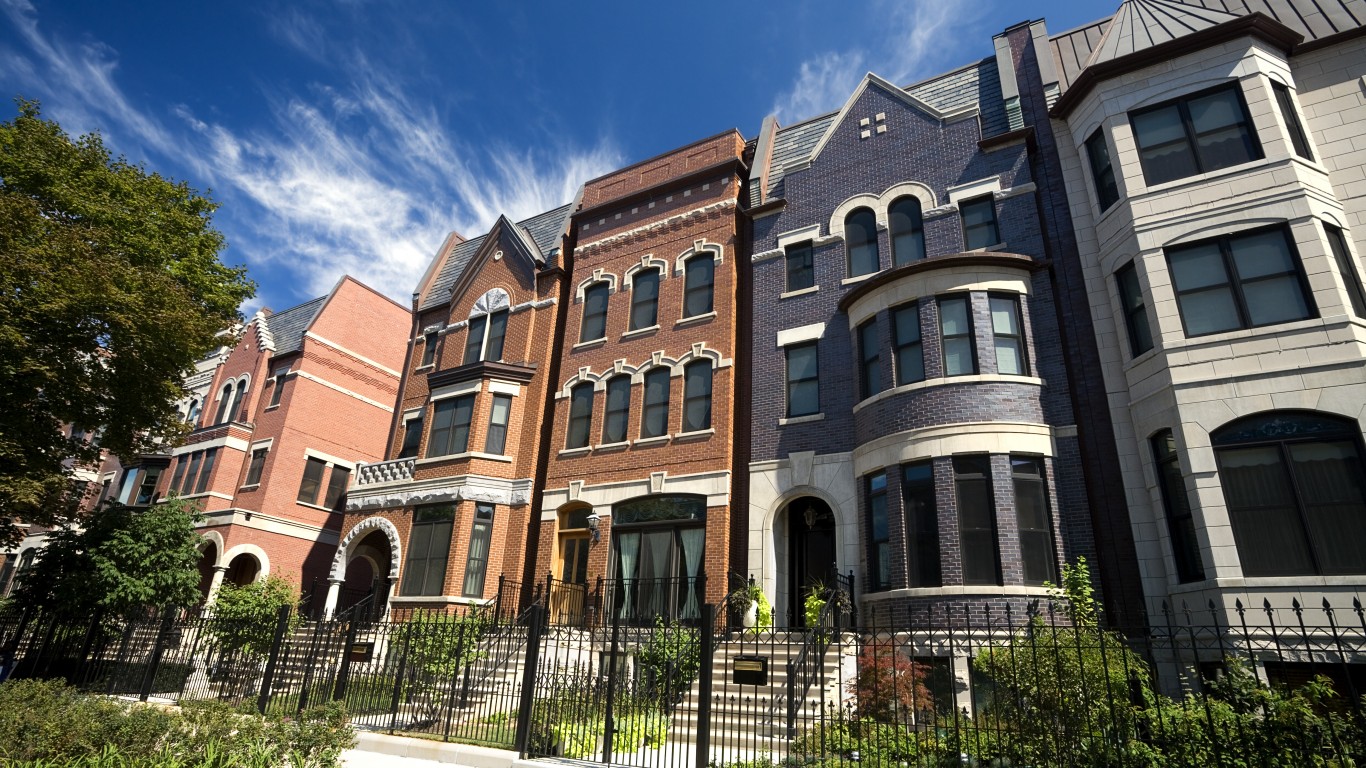
- Homeowner households making at least $1 million: 4,750 or 0.13% out of all households
- Millionaire households by generation: Millennials: 17.4%; Gen X: 40.3%; Baby boomers: 29.6%
- Main occupation of millionaire households: Chief executives and legislators
- Home values: metro median: $301,300 vs. millionaire avg.: $1,380,414
- Metro median household income, 2022: $95,861
8. San Diego-Chula Vista-Carlsbad, CA
- Homeowner households making at least $1 million: 1,739 or 0.14% out of all households
- Millionaire households by generation: Millennials: 24.4%; Gen X: 34.0%; Baby boomers: 28.6%
- Main occupation of millionaire households: Physicians
- Home values: metro median: $846,600 vs. millionaire avg.: $2,535,940
- Metro median household income, 2022: $107,657
7. Miami-Fort Lauderdale-Pompano Beach, FL
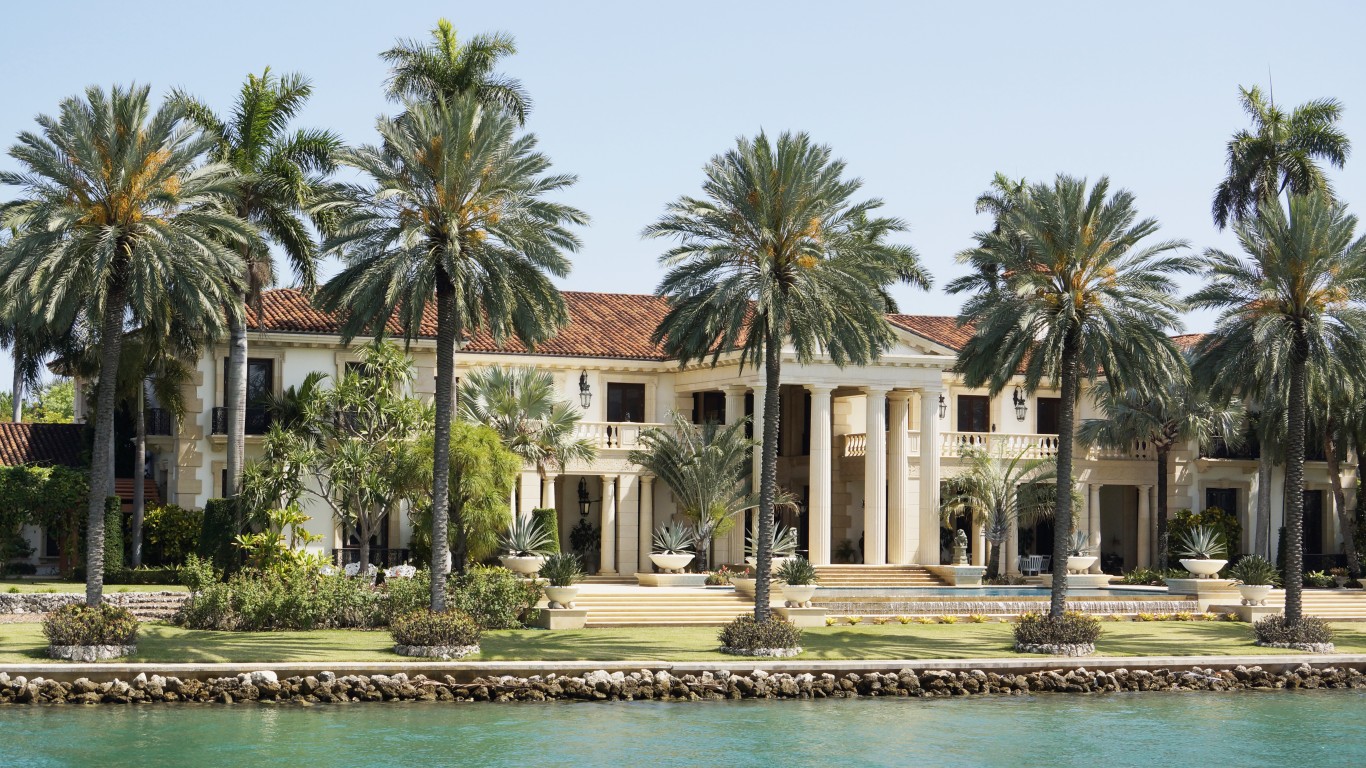
- Homeowner households making at least $1 million: 3,548 or 0.15% out of all households
- Millionaire households by generation: Millennials: 14.2%; Gen X: 32.4%; Baby boomers: 36.0%
- Main occupation of millionaire households: Chief executives and legislators
- Home values: metro median: $429,800 vs. millionaire avg.: $2,038,202
- Metro median household income, 2022: $81,433
6. Seattle-Tacoma-Bellevue, WA
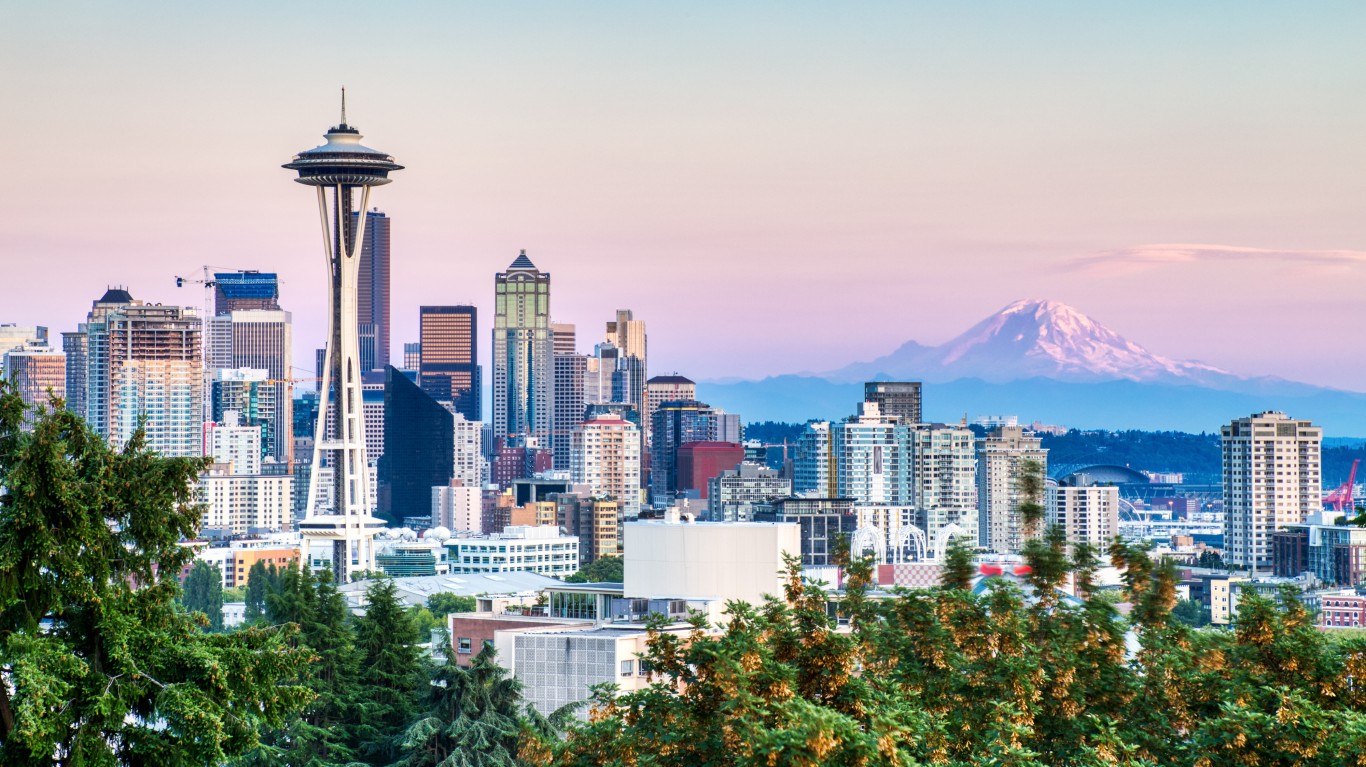
- Homeowner households making at least $1 million: 3,015 or 0.18% out of all households
- Millionaire households by generation: Millennials: 31.3%; Gen X: 43.4%; Baby boomers: 16.5%
- Main occupation of millionaire households: Software developers
- Home values: metro median: $718,100 vs. millionaire avg.: $2,097,815
- Metro median household income, 2022: $109,104
5. Los Angeles-Long Beach-Anaheim, CA
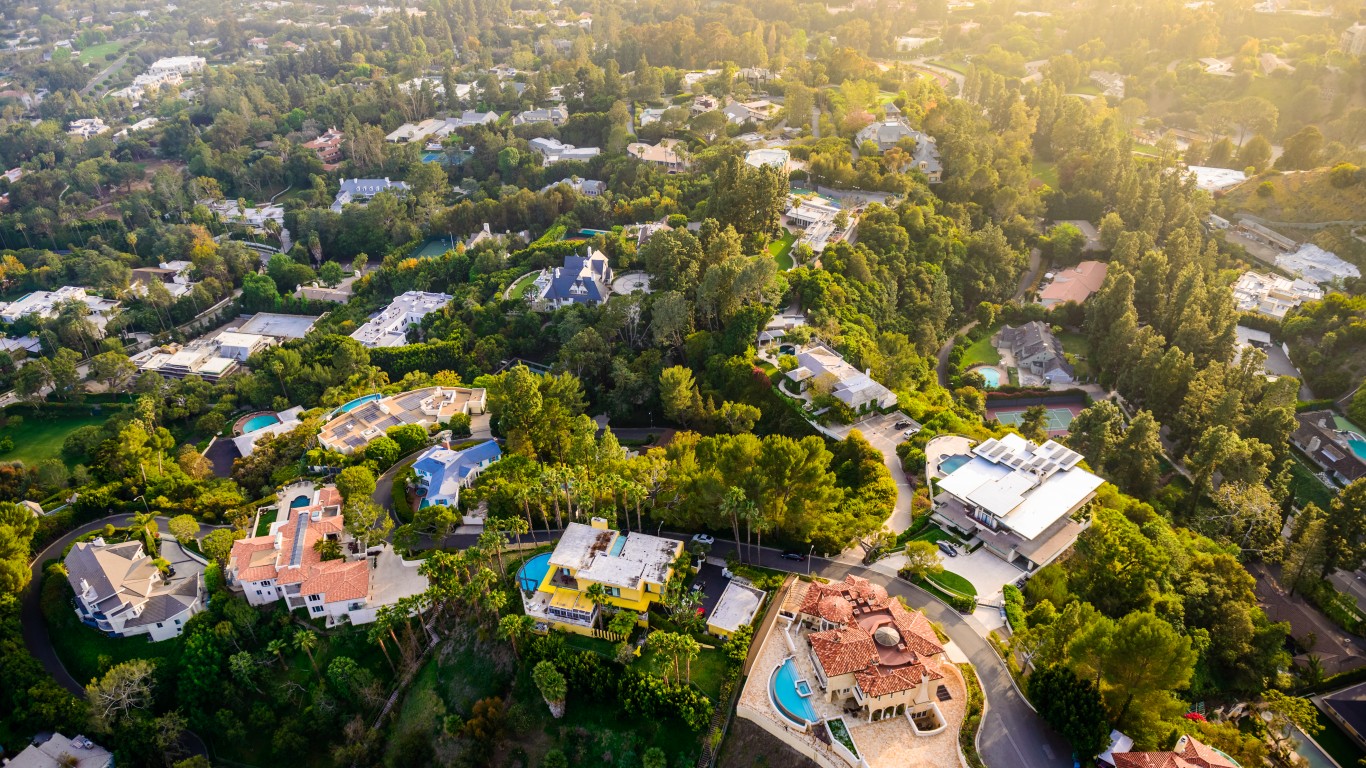
- Homeowner households making at least $1 million: 10,762 or 0.23% out of all households
- Millionaire households by generation: Millennials: 22.0%; Gen X: 35.1%; Baby boomers: 31.3%
- Main occupation of millionaire households: Chief executives and legislators
- Home values: metro median: $847,400 vs. millionaire avg.: $2,778,967
- Metro median household income, 2022: $105,024
4. Washington-Arlington-Alexandria, DC-VA-MD-WV

- Homeowner households making at least $1 million: 5,741 or 0.24% out of all households
- Millionaire households by generation: Millennials: 16.4%; Gen X: 37.9%; Baby boomers: 30.5%
- Main occupation of millionaire households: Lawyers, and judges, magistrates, and other judicial workers
- Home values: metro median: $553,100 vs. millionaire avg.: $1,675,972
- Metro median household income, 2022: $137,864
3. Boston-Cambridge-Newton, MA-NH
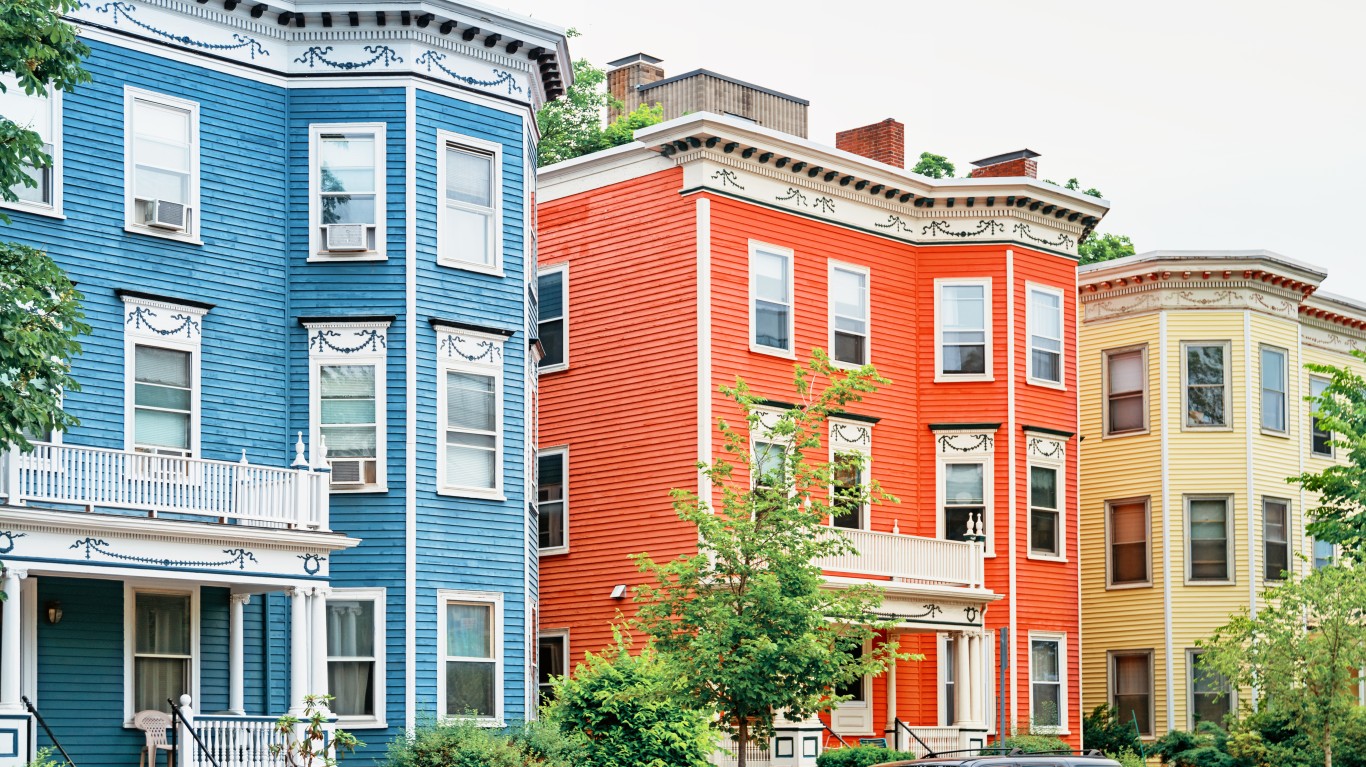
- Homeowner households making at least $1 million: 5,933 or 0.29% out of all households
- Millionaire households by generation: Millennials: 18.2%; Gen X: 38.3%; Baby boomers: 26.4%
- Main occupation of millionaire households: Chief executives and legislators
- Home values: metro median: $618,100 vs. millionaire avg.: $1,924,335
- Metro median household income, 2022: $112,603
2. New York-Newark-Jersey City, NY-NJ-PA

- Homeowner households making at least $1 million: 26,561 or 0.33% out of all households
- Millionaire households by generation: Millennials: 22.8%; Gen X: 38.6%; Baby boomers: 24.1%
- Main occupation of millionaire households: Lawyers, and judges, magistrates, and other judicial workers
- Home values: metro median: $578,800 vs. millionaire avg.: $2,055,099
- Metro median household income, 2022: $112,279
1. San Francisco-Oakland-Berkeley, CA
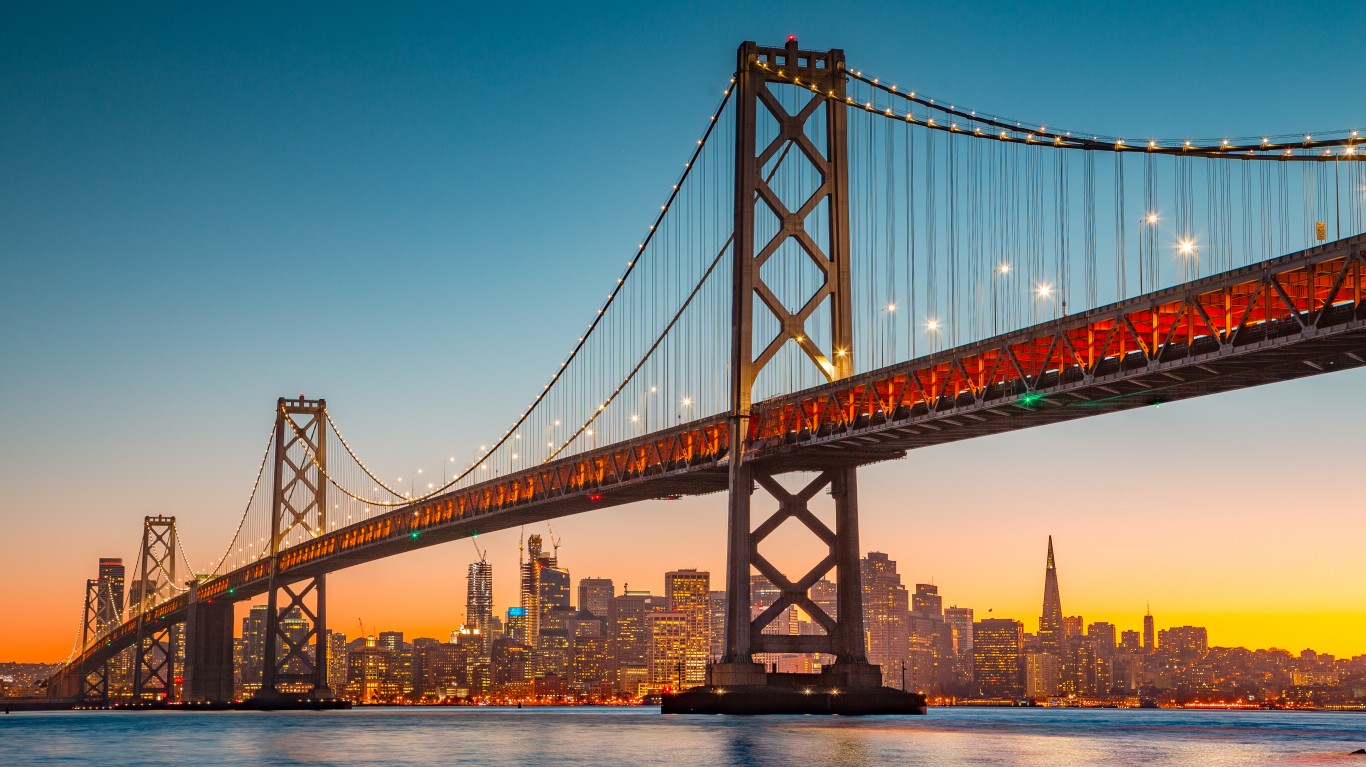
- Homeowner households making at least $1 million: 8,852 or 0.49% out of all households
- Millionaire households by generation: Millennials: 28.3%; Gen X: 40.3%; Baby boomers: 20.3%
- Main occupation of millionaire households: Chief executives and legislators
- Home values: metro median: $1,135,500 vs. millionaire avg.: $2,816,196
- Metro median household income, 2022: $142,246