When you hear that the bull market is closer to eight years old than seven, you have to wonder if even good things can last forever. Now throw in mixed to outright weak economic reports, as well as the wildest presidential election in most of our lifetimes. Despite investors having been buyers after every single sell-off, there seems to be a stealth stock market bear trend taking place inside of institutions.
The stock market selling streak has been strong in the past week or so, but the reality is that outflows in the equity market have been strong for three weeks. If Merrill Lynch’s data is gospel, then the selling panic is even worse: Institutional clients have now sold U.S. stocks for the past 21 consecutive weeks, with hedge funds selling stocks for the second consecutive week. The firm’s private clients were also net sellers last week after three weeks of buying.
Merrill Lynch clients were net sellers of U.S. stocks at a rate of $0.9 billion in the week ending October 28. That is after a $0.4 billion net outflow the prior week. All in all, this might not sound that bad. After all, that is barely one IPO’s worth of funds. Still, what is being sold may raise eyebrows. Merrill Lynch’s weekly fund flows tracking team also pointed to slower stock buybacks from companies by saying:
Clients continued to sell both large and small caps but buy mid-caps, which are the most expensive size segment. Buybacks by corporate clients slowed slightly vs. the prior week, and month-to-date are tracking the lowest of any October since 2010.
[nativounit]
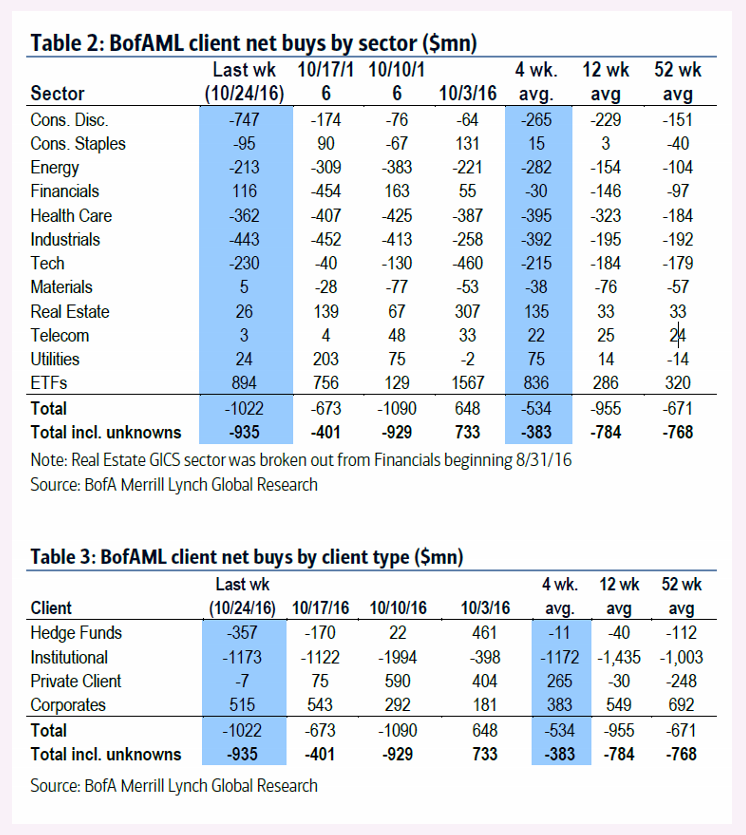
If you look at the tables below, it turns out that exchange traded funds (ETFs) in U.S. equities saw net inflows. The outflows were concentrated in consumer discretionary stocks, followed by industrials, health care and technology. But the four-week rolling average is now mostly negative as well, implying that the trends of prior buying are now being eroded by more aggressive selling recently. The points were shown by client type and by equity class:
- Hedge funds are now net sellers of stocks on a 4-week average basis after having been net buyers since early Sept.
- Institutional clients have been net sellers on a 4-week average basis since early Feb.
- Private clients are now net buyers of US stocks on a 4-week average basis, after having been net sellers since early January.
- The 4-week average trend for buybacks by corporate clients suggests a continued slowdown in S&P 500 buybacks in 3Q, and weak trends in 4Q to date.
- Large caps have seen net sales on a 4-week average basis since early Feb.
- Mid-caps have seen net sales on a 4-week average basis since late July.
- Small caps are now seeing net selling again on a 4-week average basis, after a brief spate of net buying.
Is it possible that the retail buyers and private clients are smarter than the institutions and hedge funds? Anything is possible, and note that hedge funds and institutions have had harder times achieving alpha lately. Just don’t expect solid answer if you ask hedge fund managers or institutional managers that question.
[wallst_email_signup]