[cnxvideo id=”655413″ placement=”ros”]When markets hit all-time highs and create even more milestones, sometimes there are interesting observations. The Dow Jones Industrial Average went above the 20,000 mark in the latest rally, only to eclipse 20,400 on Monday, February 13, 2017. The S&P 500 is far more important to investors because it is 500 of the largest U.S. companies, with a weighting by market cap, rather than just 30 stocks where the weighting is based on share price.
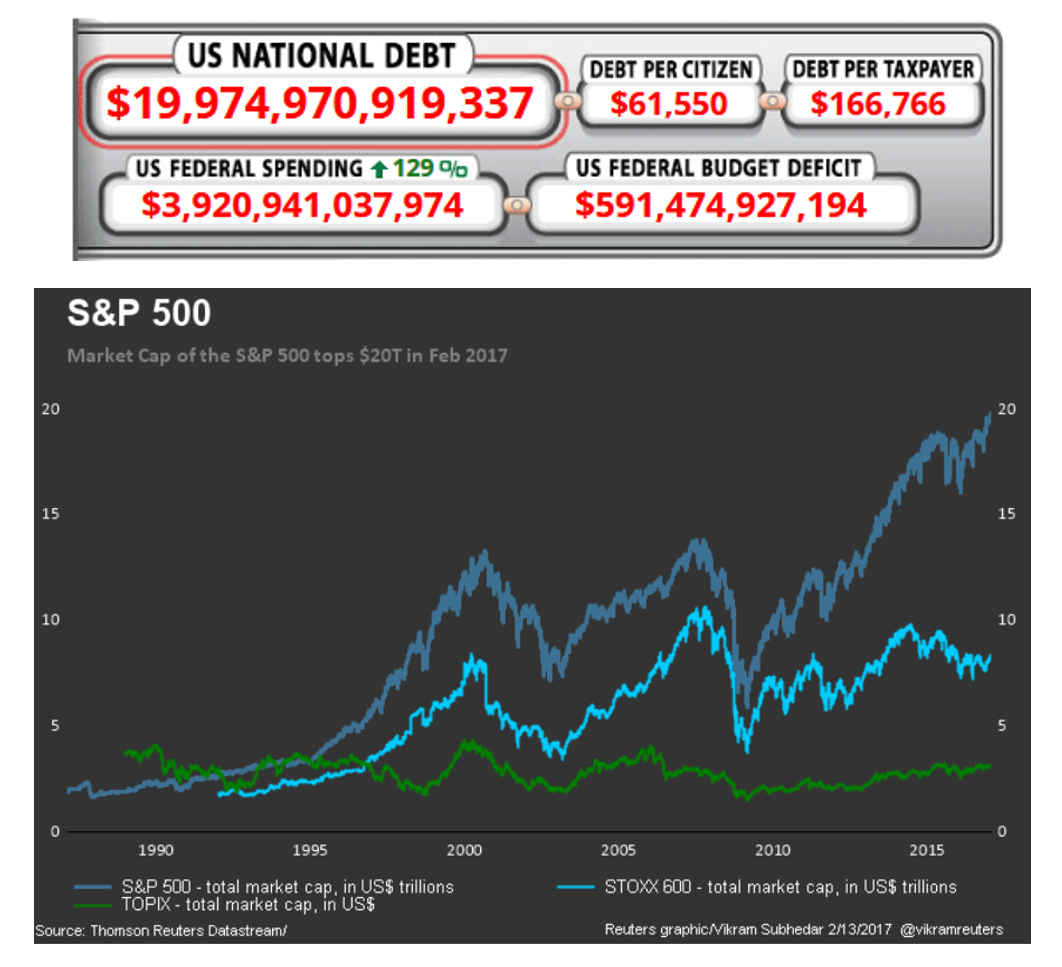
Now investors have to consider something new. The S&P 500 hit a market capitalization of $20 trillion, which means that the value of the S&P 500 is now just over the U.S. total debt. The U.S. Debt Clock shows that the U.S. national debt is just under the $19.975 trillion mark on February 13.
There are several other considerations here. We received an email from S&P that even on February 1, 2017, the S&P 500 was valued at 19.4 times 2016 earnings. The S&P was also valued at 17.4 times expected 2017 earnings (per share), a level hit in 2015 but not seen in a decade.
While many tech stocks like Apple have been winning here, the reality is that financials, materials, industrials and infrastructure have all continued to be the post-election winners. The no-growth dividend payers and defensive stocks have been laggards to mixed as investors have focused on growth and reflation.
[nativounit]
Now go back to the absolute lows when the S&P 500 hit 666 in March of 2009. This was the selling zenith, and that means they bull market is now eight years old. The S&P 500 has risen about 240% since the V-bottom of the market.
Apple shares are now challenging all-time highs, but other Dow stocks and S&P 500 stocks have hit all-time highs too: Allstate, Costco, Deere, EA, General Dynamics, Home Depot, Honeywell, JPMorgan, Netflix, Norfolk Southern, Southwest Air and many more.
The media Dow dividend yield is 2.85%, versus the yields on the 10-year Treasury at 2.44% and 3.04% on the 30-year Treasury. Gold was last seen trading down almost $7.00 at $1,223.11 per ounce and NYMEX West Texas Intermediate (WTI) crude oil was down $1.00 at $52.86.
S&P’s latest month-end data showed that there is over $7.8 trillion benchmarked to the S&P 500 Index, and the actual index assets were about $2.2 trillion in total.
BlackRock now manages $5 trillion in total assets around the world, followed by $4 trillion by Vanguard. Other asset managers with north of $2 trillion in assets under management (all classes that is) were last seen as UBS, State Street, Fidelity, Allianz and perhaps JPMorgan after a recent short-term asset win.
These two images from the U.S. Debt Clock and Reuters show that each crucial level is $20 trillion.
[wallst_email_signup]