Not every investor picks individual stocks. Some people prefer to buy ETFs that do portfolio diversification for them. While ETFs can fulfill many goals, such as low-volatility income or dividend growth, other ETFs aim to maximize investors’ returns in exchange for a higher level of risk.
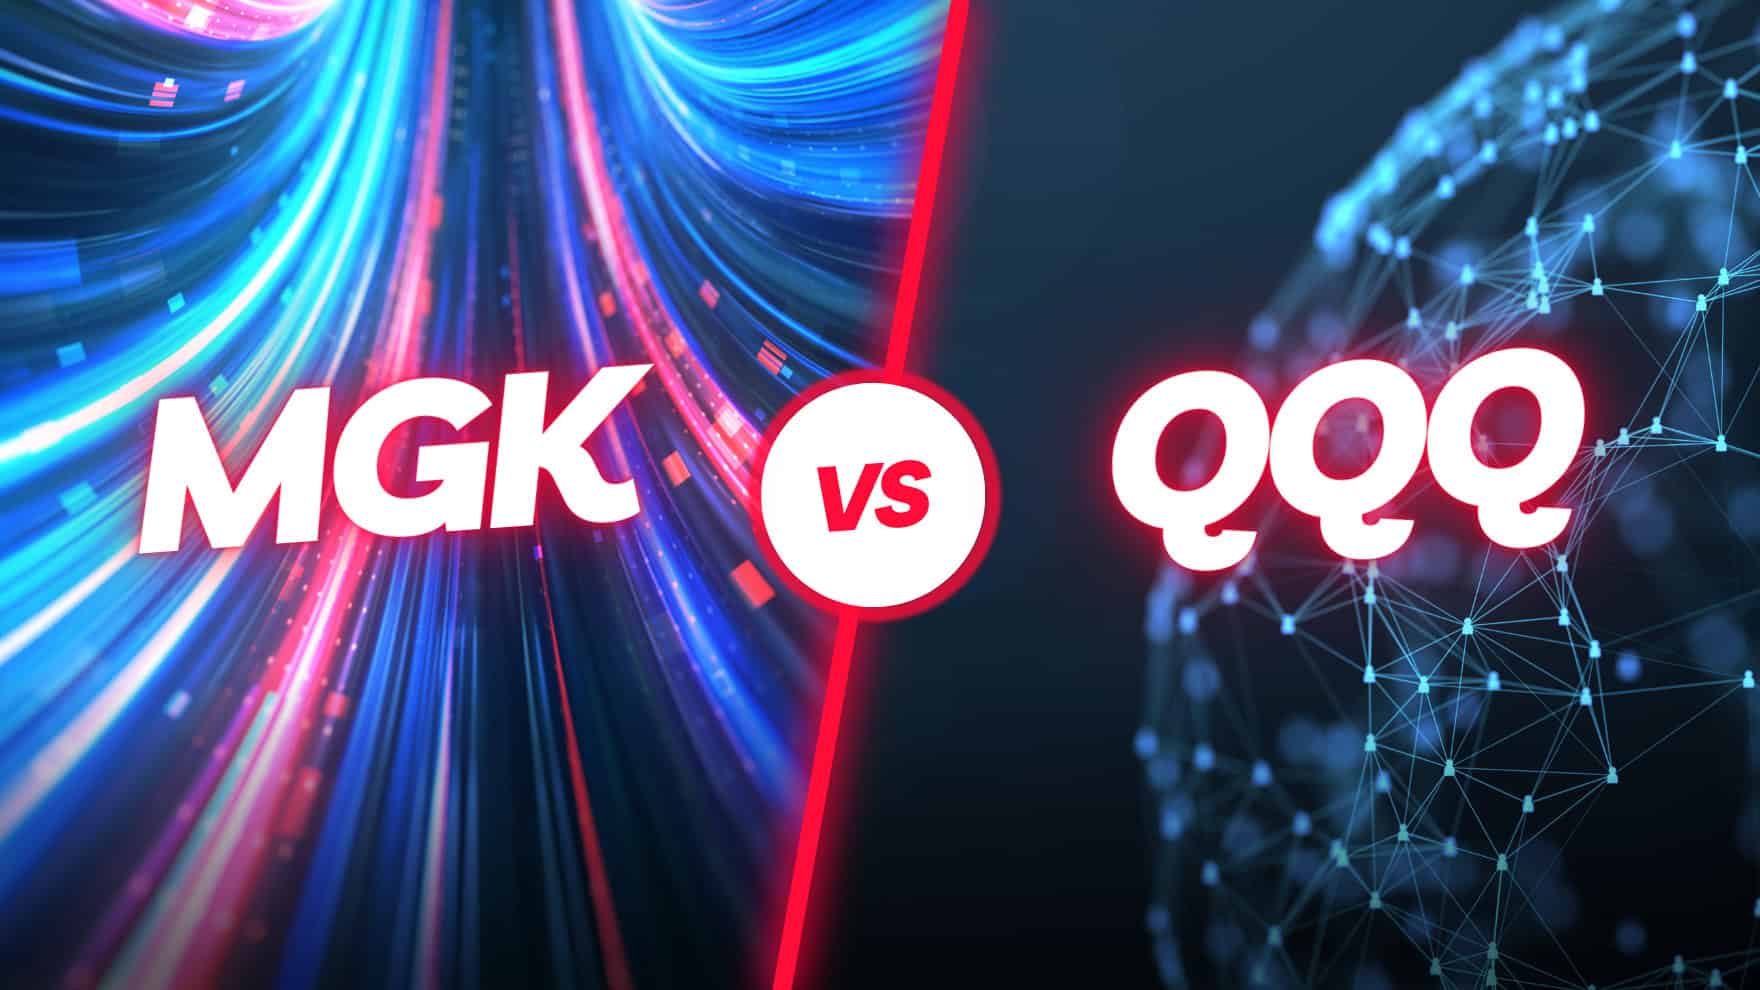
When it comes to high returns and consistency, few ETFs are better than the Invesco QQQ Trust (NASDAQ:QQQ | QQQ Price Prediction) or the Vanguard Mega Cap Growth Index Fund (NYSEARCA:MGK). You could theoretically buy both of these funds, but if you had an extra $1, which fund would deserve more of your money?
This analysis will explore what has helped QQQ and MGK stand out and deliver solid returns for long-term investors. Then, you will have a better idea of which ETF makes more sense for your portfolio.
Portfolio Allocations

QQQ mirrors the tech-heavy Nasdaq 100, while MGK prioritizes mega-cap stocks, primarily in the tech industry. MGK uses the CRSP US Mega Cap Growth Index as its benchmark.
MGK has 61.4% of its assets allocated to tech, while QQQ puts 59.5% of its assets into tech. MGK also has a smaller portfolio of only 69 stocks compared to the 100 holdings in QQQ.
Both funds have Apple (NASDAQ:AAPL), Microsoft (NASDAQ:MSFT), and Nvidia (NASDAQ:NVDA) as their top three holdings. However, MGK has more exposure to each of these stocks. If these three stocks continue to rally, MGK has a good chance of outperforming QQQ. However, QQQ offers more insulation in the event those three stocks waver.
Both funds are top-heavy. QQQ puts 51% of its holdings into its top 10 holdings. Meanwhile, MGK allocates 64% of its assets into its top 10 holdings.
Historical Returns

MGK has been the better performer in recent years, but QQQ has a long history of outperforming MGK. Both funds have regularly delivered double-digit annualized growth rates for their investors.
MGK edges QQQ in 1-year and 3-year returns. It’s delivered a 29.2% return over the past year and an annualized 15.4% return over the past three years. QQQ only has a 1-year return of 23.7% and an annualized 3-year return of 14.9%.
The sentiment shifts for annualized 5-year, 10-year, and 15-year returns. QQQ has delivered annualized returns of 19.4%, 18.8%, and 19.2% during those respective periods. On the other hand, MGK has only managed annualized returns of 18.6%, 16.9%, and 16.8% during those respective periods.
QQQ has long-term returns on its side, but investors may believe that MGK’s current portfolio gives it an edge. Most of the analysis really depends on how you feel about Apple, Microsoft, and Nvidia.
The funds even have similar expense ratios. QQQ has a higher 0.20% expense ratio, which is still manageable, while MGK has a sterling 0.07% expense ratio.
Volatility and Risk

Both funds are more volatile than the average ETF. However, MGK has more volatility due to its high concentration in tech ETFs, plus its top 10 holdings are growth stocks that make up roughly 64% of its total assets.
QQQ is also quite volatile, but it’s shockingly more diversified into other industries than MGK. That extra portfolio diversification means QQQ is less volatile. However, the volatility between these funds isn’t that different. MGK has a 5-year beta of 1.20, while QQQ has a 5-year beta of 1.18. A higher beta indicates more volatility, but the difference is minimal.
What to Consider Before Choosing an ETF to Buy

Investors should assess their financial goals and risk tolerance before investing in any ETF. MGK and QQQ are both for investors who aren’t afraid to take additional risk in exchange for a higher potential upside. These funds are great for long-term investors who want exposure to tech stocks. However, people who want less exposure to the tech sector may want tochoose other ETFs.