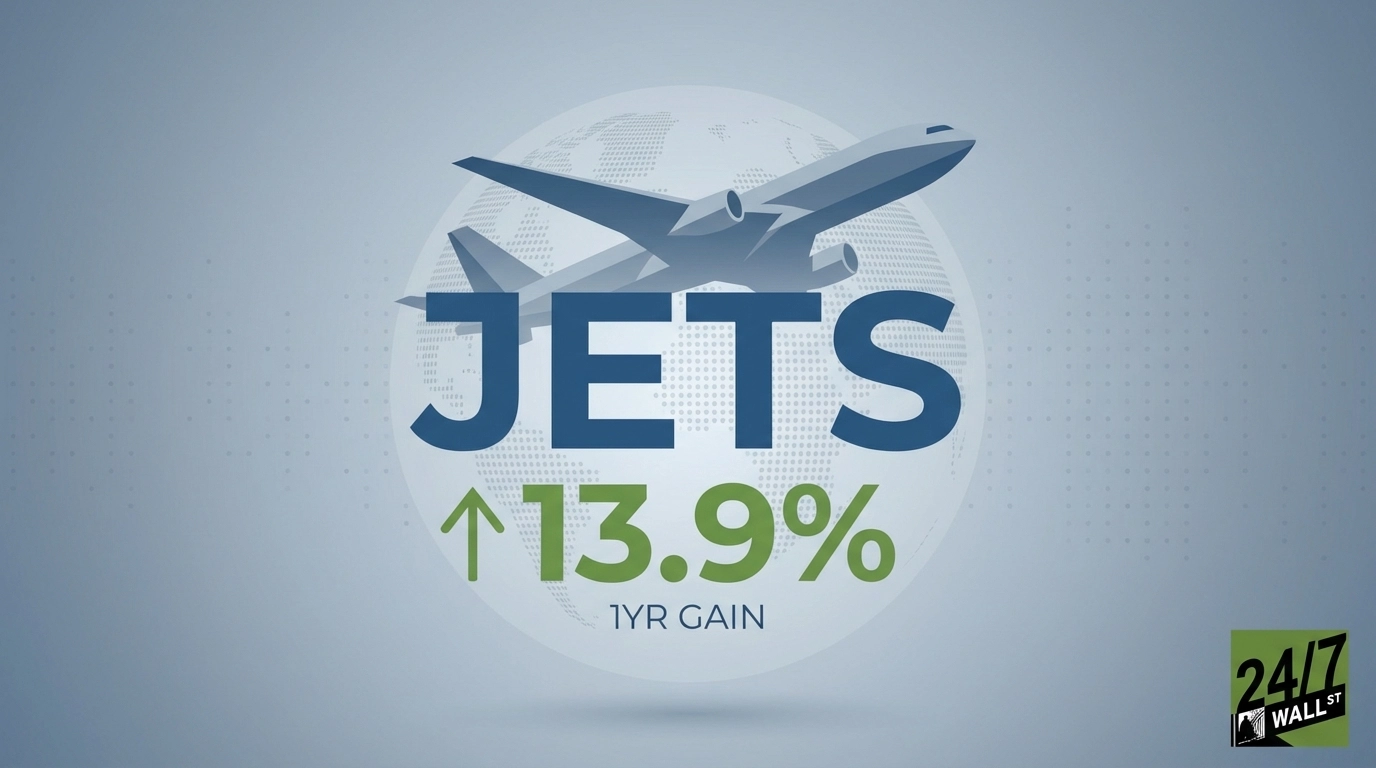
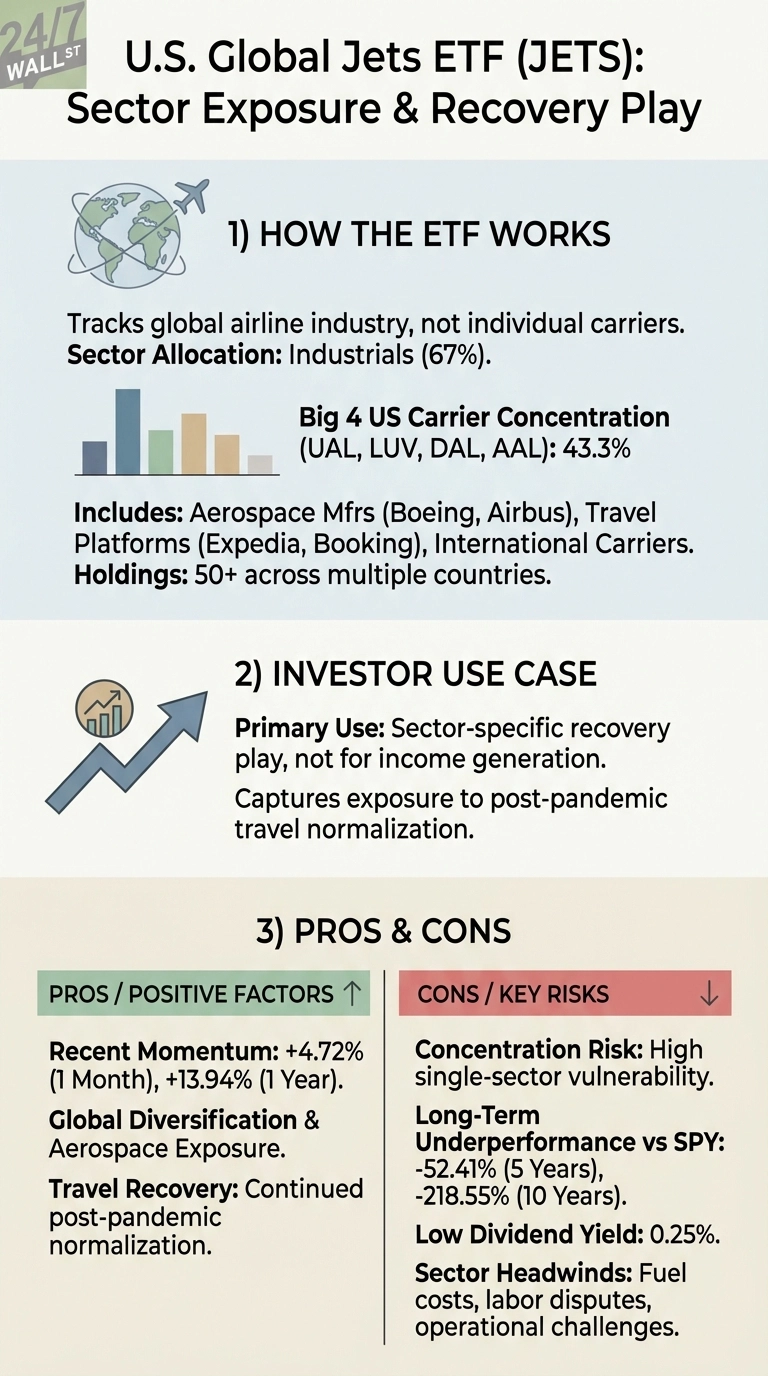
The U.S. Global Jets ETF (NYSEARCA:JETS) captures exposure to the global airline industry without picking individual carriers. The fund’s 13.9% gain over the past year signals recovery momentum after pandemic devastation, though the 0.60% expense ratio means investors pay a premium for this specialized exposure compared to broad market funds. With $797.6 million in assets, the portfolio spans traditional carriers, aerospace manufacturers, and travel platforms.
The ETF has gained momentum recently, climbing 4.7% over the past month as travel demand strengthens heading into 2026. This short-term strength stands in contrast to the fund’s longer-term underperformance versus the S&P 500, a gap that reflects the structural damage COVID-19 inflicted on airline economics. The minimal 0.25% dividend yield underscores that this remains a pure recovery play rather than an income investment.
Fuel Costs Will Drive Industry Margins
Jet fuel economics are shifting in airlines’ favor for 2026. The International Air Transport Association projects fuel prices will decline from $90 to $88 per barrel, and while a 2.4% decrease sounds modest, it translates to meaningful margin expansion when fuel represents up to 30% of operating costs for most carriers.
IATA projects the global airline industry will achieve a 3.9% net profit margin in 2026. Even small movements in fuel costs can swing margins dramatically. When oil prices drop below $60 per barrel, the economics of route planning fundamentally change as breakeven load factors for narrowbody aircraft can fall from above 80% to the high-60% range.
Monitor weekly Energy Information Administration petroleum status reports and monthly IATA fuel price updates. Watch the crack spread, the difference between crude oil and refined jet fuel prices, which is projected at $26 per barrel for 2026. A widening spread would pressure airlines despite stable crude prices.
Big Four Concentration Creates Earnings Volatility
The fund’s structure creates significant single-stock risk through its heavy weighting in U.S. carriers. United Airlines (NASDAQ:UAL | UAL Price Prediction) leads at 11.3%, followed closely by Southwest Airlines (NYSE:LUV), Delta Air Lines (NYSE:DAL), and American Airlines (NASDAQ:AAL), each holding between 10.6% and 10.8%. Together, these four stocks account for 43.3% of the portfolio, meaning any earnings disappointment from a major carrier will ripple through the entire ETF.
American Airlines reports earnings on January 22. With analysts expecting $0.41 per share and the stock trading at 18x earnings with only 1.1% profit margins, any disappointment could ripple through the ETF.
American’s fundamentals lag peers like Delta, which posted 7.4% profit margins and 10.2% earnings growth last quarter compared to American’s flat growth. Check the issuer’s monthly fact sheet at usglobaletfs.com and quarterly holdings updates to monitor any rebalancing.
Retail Investors Debate Travel Demand
Reddit discussions on r/investing show mixed sentiment on airline recovery prospects. One user wrote:
“Business travel still hasn’t recovered to pre-pandemic levels and I’m not convinced it ever will with remote work becoming permanent at so many companies.”
This skepticism reflects broader concerns about whether corporate travel demand will return to 2019 levels, which matters because business travelers historically generated disproportionate revenue for carriers.
Another investor on r/stocks observed:
“Leisure travel is booming but margins are compressed because everyone’s competing on price for vacation travelers who are much more price-sensitive than business flyers.”
This tension between volume growth and margin pressure explains why airline stocks have lagged despite strong passenger counts, and why JETS investors need to watch both load factors and yield metrics rather than just traffic numbers.
The Bottom Line
Watch jet fuel prices through EIA reports for the macro picture, and monitor American Airlines’ January 22 earnings for immediate ETF impact given the fund’s 43% concentration in four carriers.