America is home to several military bases that have been in operation since the Revolutionary War. There are more than 2.5 million active-duty members of the military today, and over 1 million of them are stationed across the 50 states and Washington DC. Some states have a higher concentration of military personnel, with five states home to 60% of all the troops stationed at home.
24/7 Wall St. reviewed personnel data from the Department of Defense Personnel, Workforce Reports & Publications, using their provided data from September 30, 2022, to determine the states with the most active-duty military personnel. These numbers were then adjusted over 100,000 state population. Data for the number of military sites in each state came from the U.S. Department of Transportation/Bureau of Transportation Statistics National Transportation Atlas Database from their May 2019 report. Census Bureau’s Annual Estimates of the Resident Population for July 1, 2022, provide our state population data. These are the most up-to-date statistics at the time of publication.
Why Are We Writing About Military Service?

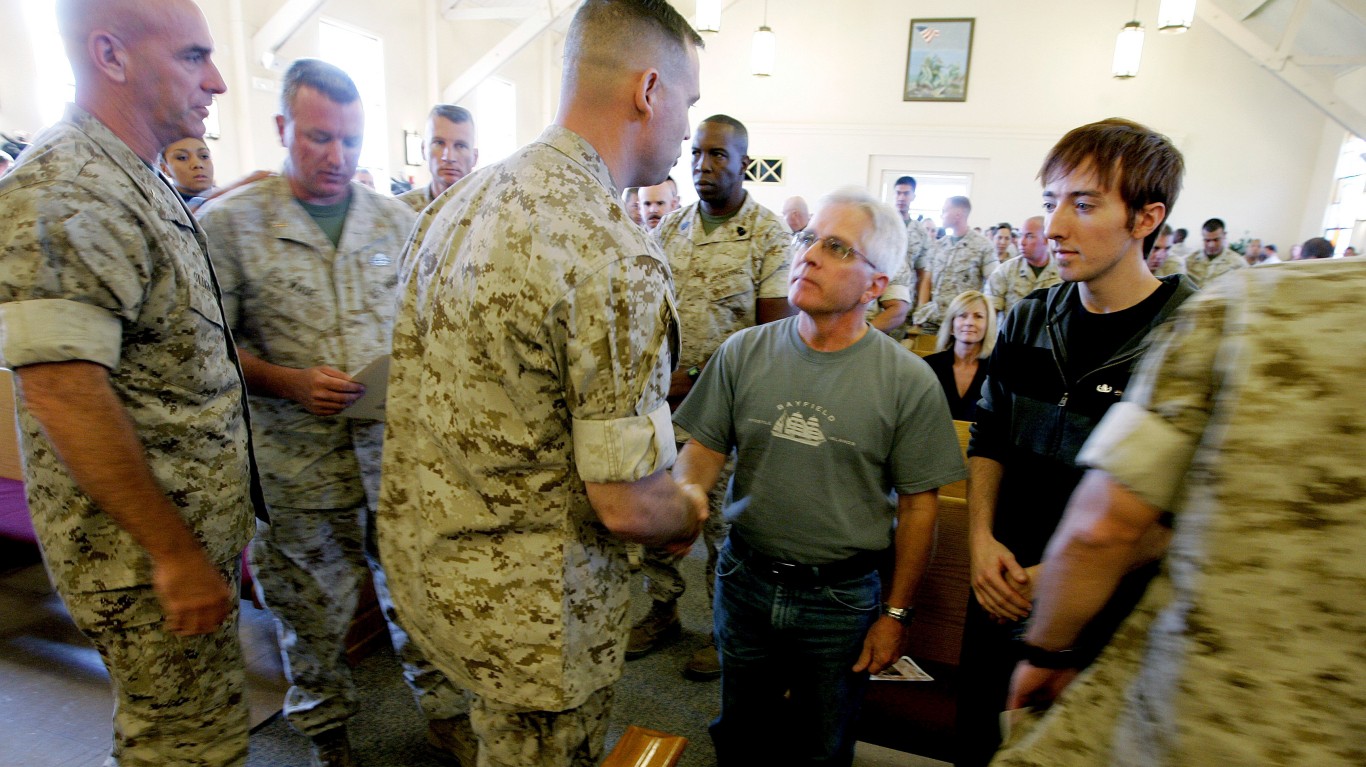
The military is essential to protecting our country. The Department of Defense is also the largest employer in the United States, with approximately 1.3 million active military service members and over 800,000 in reserves. Across the United States and worldwide, personnel are stationed and performing their duty for the country, for themselves, and their families.
Here are the U.S. States with the highest number of active-duty military personnel:
51. Iowa
- 2021 Per Capita Defense Spending: $805 (12th lowest nationwide)
- Active-Duty Military Personnel: 246 (8 per 100,000 residents)
- Military Sites: 5 (tied for 10th fewest)
50. West Virginia
- 2021 Per Capita Defense Spending: $496 (5th lowest)
- Active-Duty Military Personnel (September 2022): 177 (10 per 100,000)
- Military Sites: 8 (tied for 19th fewest)
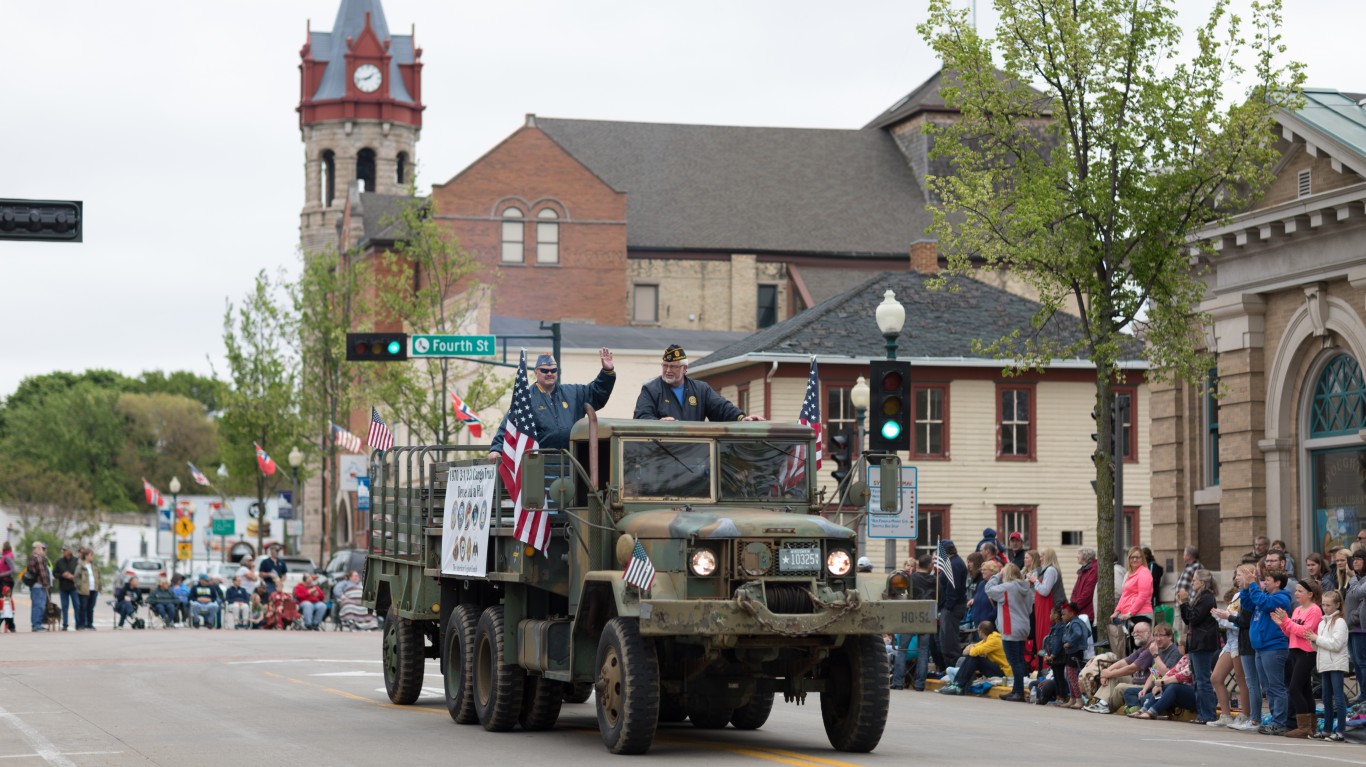
49. Minnesota
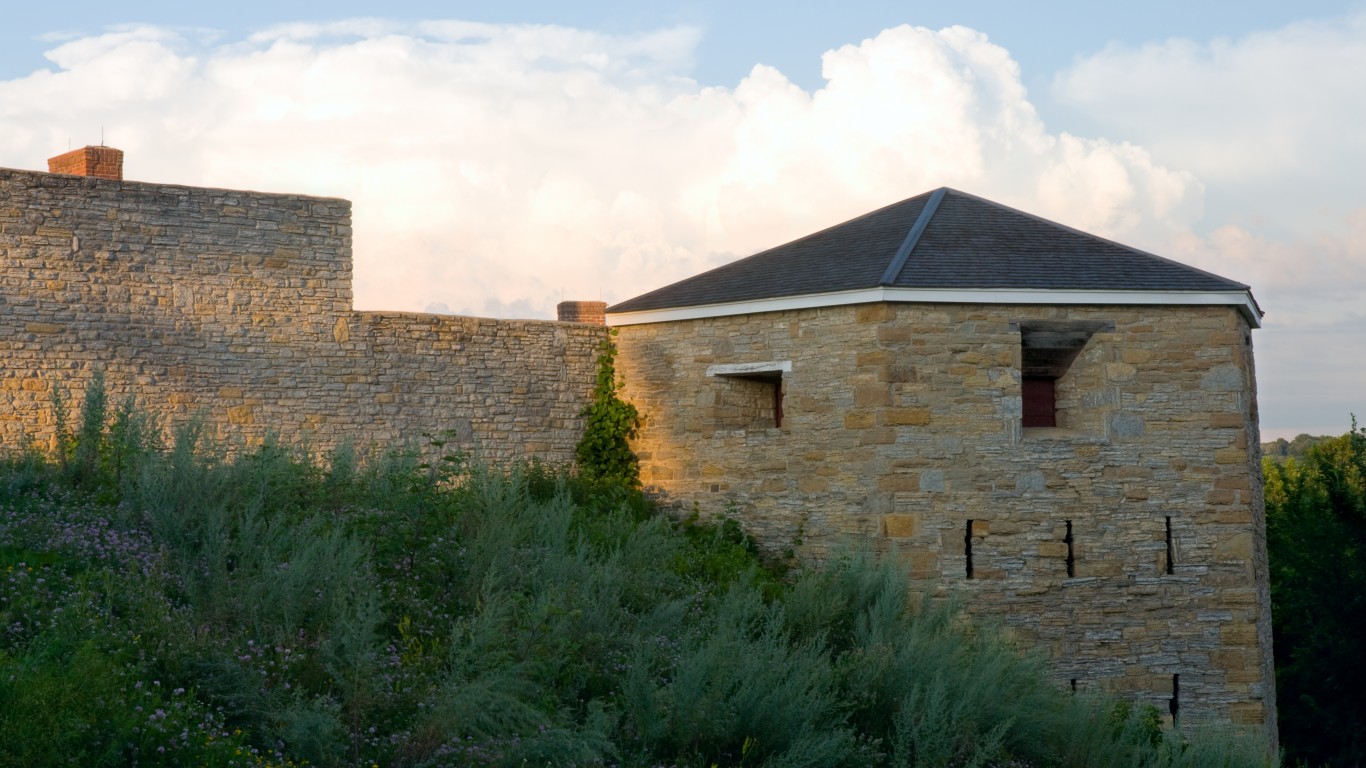
- 2021 Per Capita Defense Spending: $387 (3rd lowest)
- Active-Duty Military Personnel (September 2022): 580 (10 per 100,000)
- Military Sites: 3
48. Indiana
- 2021 Per Capita Defense Spending: $1,059 (21st lowest)
- Active-Duty Military Personnel (September 2022): 1,043 (15 per 100,000)
- Military Sites: 11
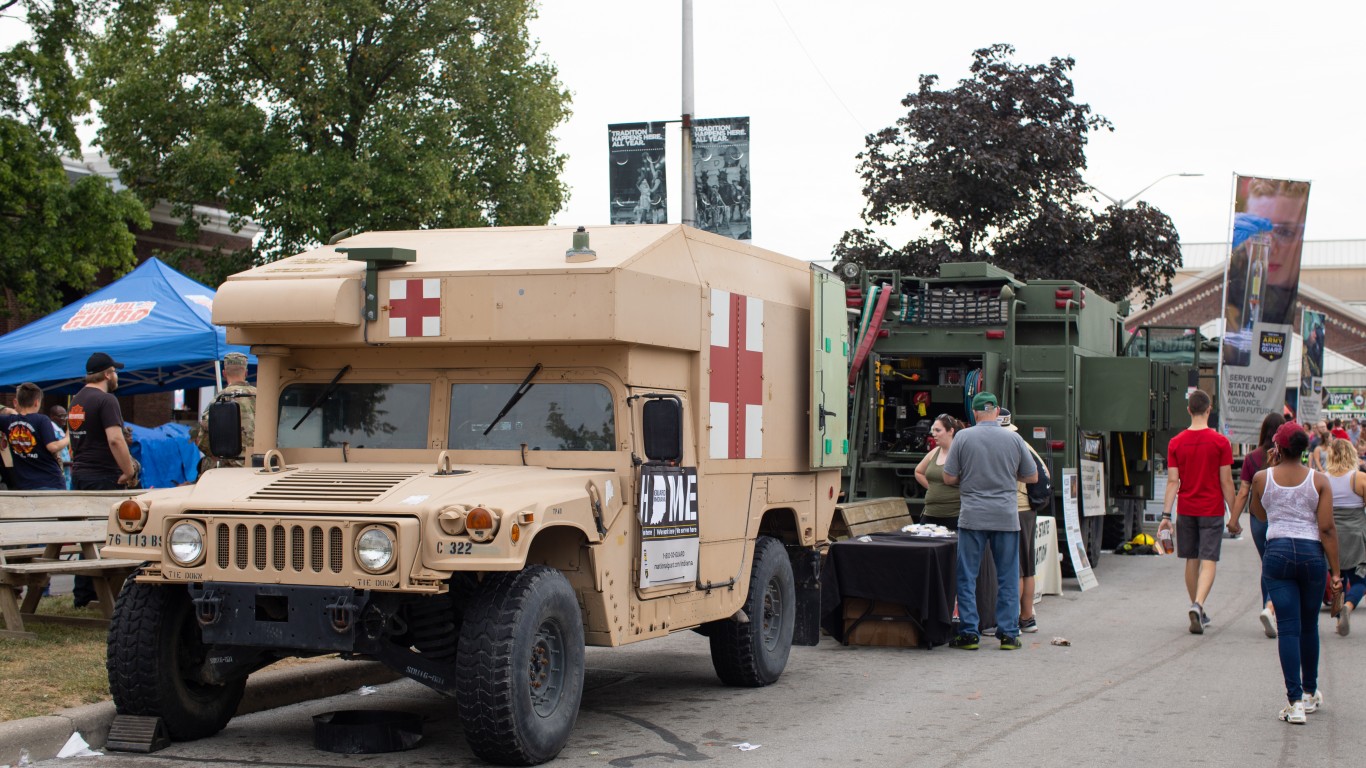
47. Wisconsin
- 2021 Per Capita Defense Spending: $857 (17th lowest)
- Active-Duty Military Personnel: 993 (17 per 100,000)
- Military Sites: 4
46. Michigan

- 2021 Per Capita Defense Spending: $649 (8th lowest)
- Active-Duty Military Personnel (September 2022): 1,900 (19 per 100,000)
- Military Sites: 9
45. Pennsylvania

- 2021 Per Capita Defense Spending: $1,272 (26th highest)
- Active-Duty Military Personnel (September 2022): 2,468 (19 per 100,000)
- Military Sites: 8
44. Vermont

- 2021 Per Capita Defense Spending: $845 (16th lowest)
- Active-Duty Military Personnel (September 2022): 141 (22 per 100,000)
- Military Sites: 5
43. Tennessee

- 2021 Per Capita Defense Spending: $462 (4th lowest)
- Active-Duty Military Personnel (September 2022): 2,378 (34 per 100,000)
- Military Sites: 15
42. Oregon

- 2021 Per Capita Defense Spending: $324 (lowest)
- Active-Duty Military Personnel (September 2022): 1,514 (36 per 100,000)
- Military Sites: 11
41. Massachusetts
- 2021 Per Capita Defense Spending: $3,057 (9th highest)
- Active-Duty Military Personnel (September 2022): 3,350 (48 per 100,000)
- Military Sites: 6
40. Maine

- 2021 Per Capita Defense Spending: $2,348 (11th highest)
- Active-Duty Military Personnel (September 2022): 797 (58 per 100,000)
- Military Sites: 7
39. Ohio

- 2021 Per Capita Defense Spending: $844 (15th lowest)
- Active-Duty Military Personnel (September 2022): 6,846 (58 per 100,000)
- Military Sites: 15
38. New Hampshire
- 2021 Per Capita Defense Spending: $1,671 (17th highest)
- Active-Duty Military Personnel (September 2022): 1,115 (80 per 100,000)
- Military Sites: 4
37. New Jersey
- 2021 Per Capita Defense Spending: $1,002 (20th lowest)
- Active-Duty Military Personnel (September 2022): 7,954 (86 per 100,000)
- Military Sites: 7
36. New York

- 2021 Per Capita Defense Spending: $1,557 (20th highest)
- Active-Duty Military Personnel (September 2022): 19,364 (98 per 100,000)
- Military Sites: 17
35. Arkansas
- 2021 Per Capita Defense Spending: $639 (7th lowest)
- Active-Duty Military Personnel (September 2022): 3,740 (123 per 100,000)
- Military Sites: 5
34. Utah

- 2021 Per Capita Defense Spending: $1,877 (16th highest)
- Active-Duty Military Personnel (September 2022): 4,503 (133 per 100,000)
- Military Sites: 11
33. Alabama
 - U.S. Army (Originally uploaded on en.wikipedia)")
- 2021 Per Capita Defense Spending: $3,123 (7th highest)
- Active-Duty Military Personnel (September 2022): 8,244 (162 per 100,000)
- Military Sites: 8
32. Connecticut

- 2021 Per Capita Defense Spending: $5,347 (4th highest)
- Active-Duty Military Personnel (September 2022): 6,224 (172 per 100,000)
- Military Sites: 5
31. Illinois

- 2021 Per Capita Defense Spending: $749 (10th lowest)
- Active-Duty Military Personnel (September 2022): 22,679 (180 per 100,000)
- Military Sites: 14
30. Idaho
- 2021 Per Capita Defense Spending: $356 (2nd lowest)
- Active-Duty Military Personnel (September 2022): 3,511 (181 per 100,000)
- Military Sites: 7
29. Missouri

- 2021 Per Capita Defense Spending: $1,979 (14th highest)
- Active-Duty Military Personnel (September 2022): 14,409 (233 per 100,000)
- Military Sites: 5
28. Arizona
- 2021 Per Capita Defense Spending: $2,013 (13th highest)
- Active-Duty Military Personnel (September 2022): 17,482 (238 per 100,000)
- Military Sites: 19
27. Montana
- 2021 Per Capita Defense Spending: $586 (6th lowest)
- Active-Duty Military Personnel (September 2022): 3,253 (290 per 100,000)
- Military Sites: 5
26. Florida
 arrives a... by Official U.S. Navy Page")
- 2021 Per Capita Defense Spending: $1,384 (24th highest)
- Active-Duty Military Personnel (September 2022): 66,971 (301 per 100,000)
- Military Sites: 41
25. Louisiana
- 2021 Per Capita Defense Spending: $768 (11th lowest)
- Active-Duty Military Personnel (September 2022): 14,910 (325 per 100,000)
- Military Sites: 14
24. Nebraska

- 2021 Per Capita Defense Spending: $844 (15th lowest)
- Active-Duty Military Personnel (September 2022): 6,499 (330 per 100,000)
- Military Sites: 8
23. Delaware
- 2021 Per Capita Defense Spending: $947 (18th lowest)
- Active-Duty Military Personnel (September 2022): 3,490 (343 per 100,000)
- Military Sites: 4
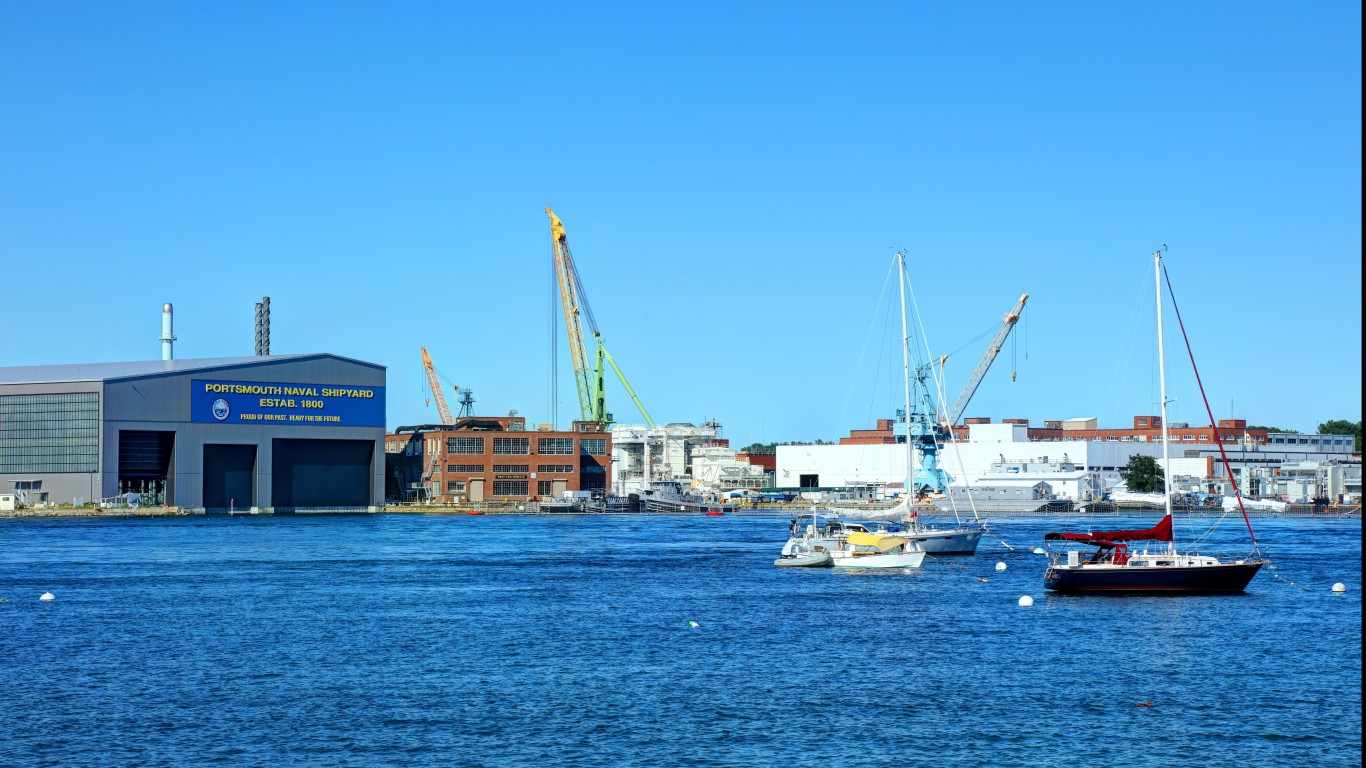
22. Rhode Island
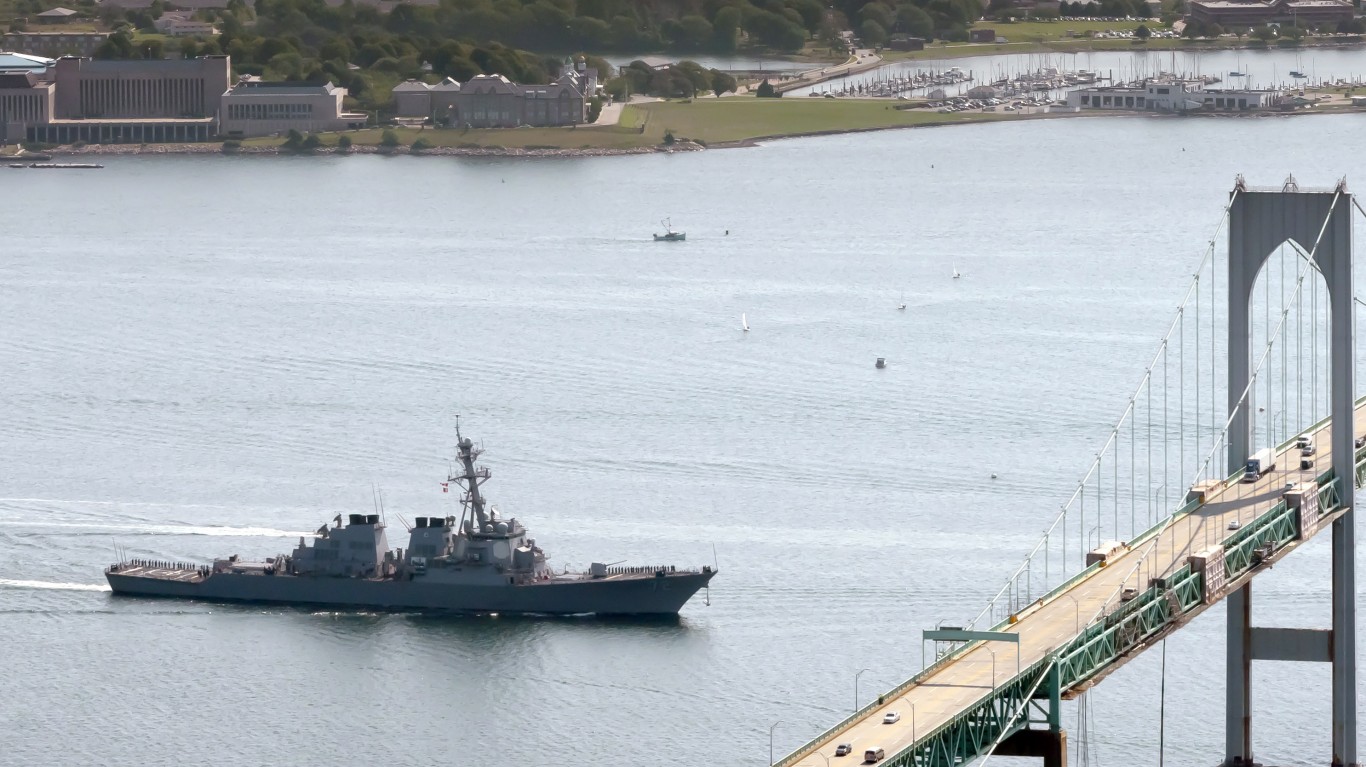
- 2021 Per Capita Defense Spending: $1,533 (22nd highest)
- Active-Duty Military Personnel (September 2022): 3,793 (347 per 100,000)
- Military Sites: 5
21. South Dakota

- 2021 Per Capita Defense Spending: $718 (9th lowest)
- Active-Duty Military Personnel (September 2022): 3,388 (372 per 100,000)
- Military Sites: 7
20. Mississippi
- 2021 Per Capita Defense Spending: $1,911 (15th highest)
- Active-Duty Military Personnel (September 2022): 11,067 (376 per 100,000)
- Military Sites: 12
19. Texas
- 2021 Per Capita Defense Spending: $1,601 (18th highest)
- Active-Duty Military Personnel (September 2022): 114,245 (380 per 100,000)
- Military Sites: 42
18. Nevada

- 2021 Per Capita Defense Spending: $974 (19th lowest)
- Active-Duty Military Personnel (September 2022): 12,275 (386 per 100,000)
- Military Sites: 13
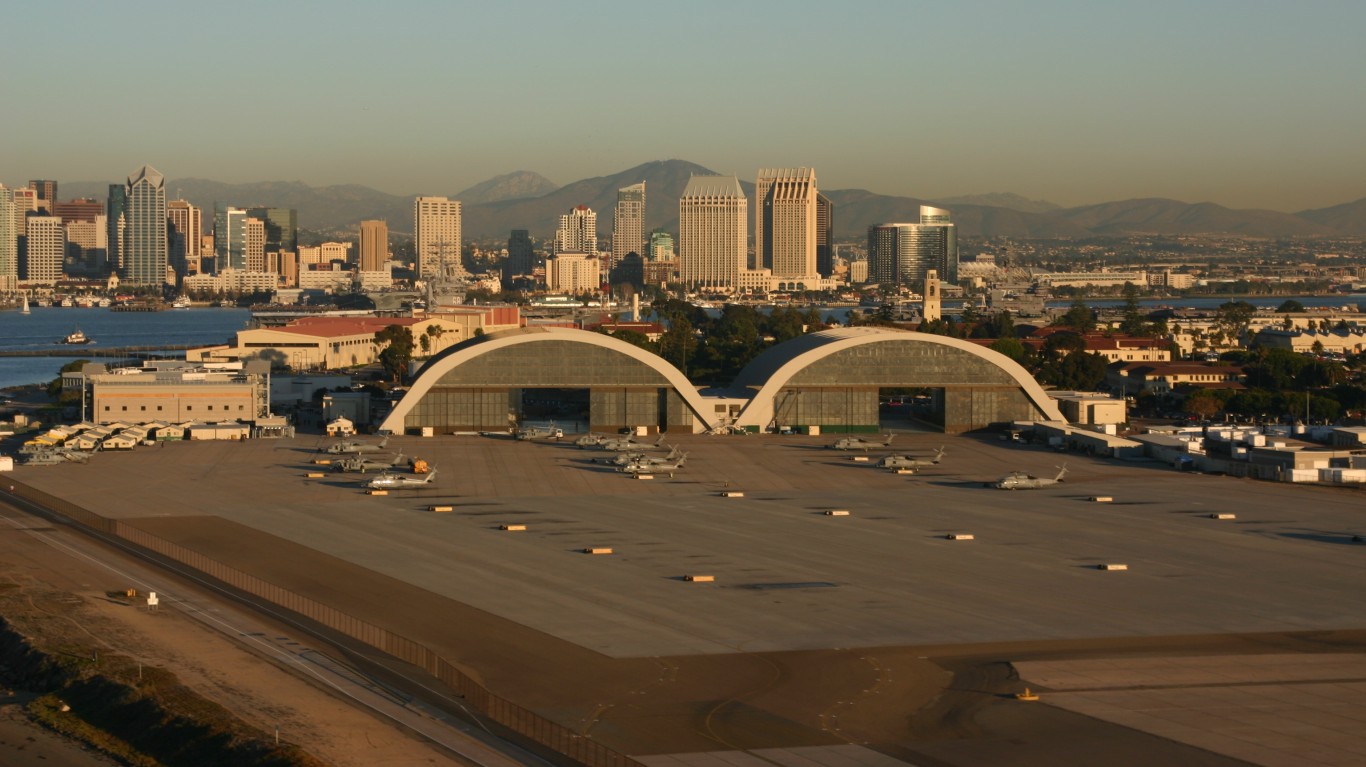
17. California
- 2021 Per Capita Defense Spending: $1,463 (23rd highest)
- Active-Duty Military Personnel (September 2022): 1,463,393 (419 per 100,000)
- Military Sites: 73
16. Maryland

- 2021 Per Capita Defense Spending: $4,258 (6th highest)
- Active-Duty Military Personnel (September 2022): 29,599 (480 per 100,000)
- Military Sites: 25
15. Oklahoma
- 2021 Per Capita Defense Spending: $1,582 (19th highest)
- Active-Duty Military Personnel (September 2022): 21,114 (525 per 100,000)
- Military Sites: 14
14. Wyoming
- 2021 Per Capita Defense Spending: $822 (13th lowest)
- Active-Duty Military Personnel (September 2022): 3,148 (541 per 100,000)
- Military Sites: 3
13. Georgia

- 2021 Per Capita Defense Spending: $1,378 (25th highest)
- Active-Duty Military Personnel (September 2022): 63,873 (585 per 100,000)
- Military Sites: 20
12. New Mexico
- 2021 Per Capita Defense Spending: $1,547 (21st highest)
- Active-Duty Military Personnel (September 2022): 13,437 (636 per 100,000)
- Military Sites: 10
11. Colorado
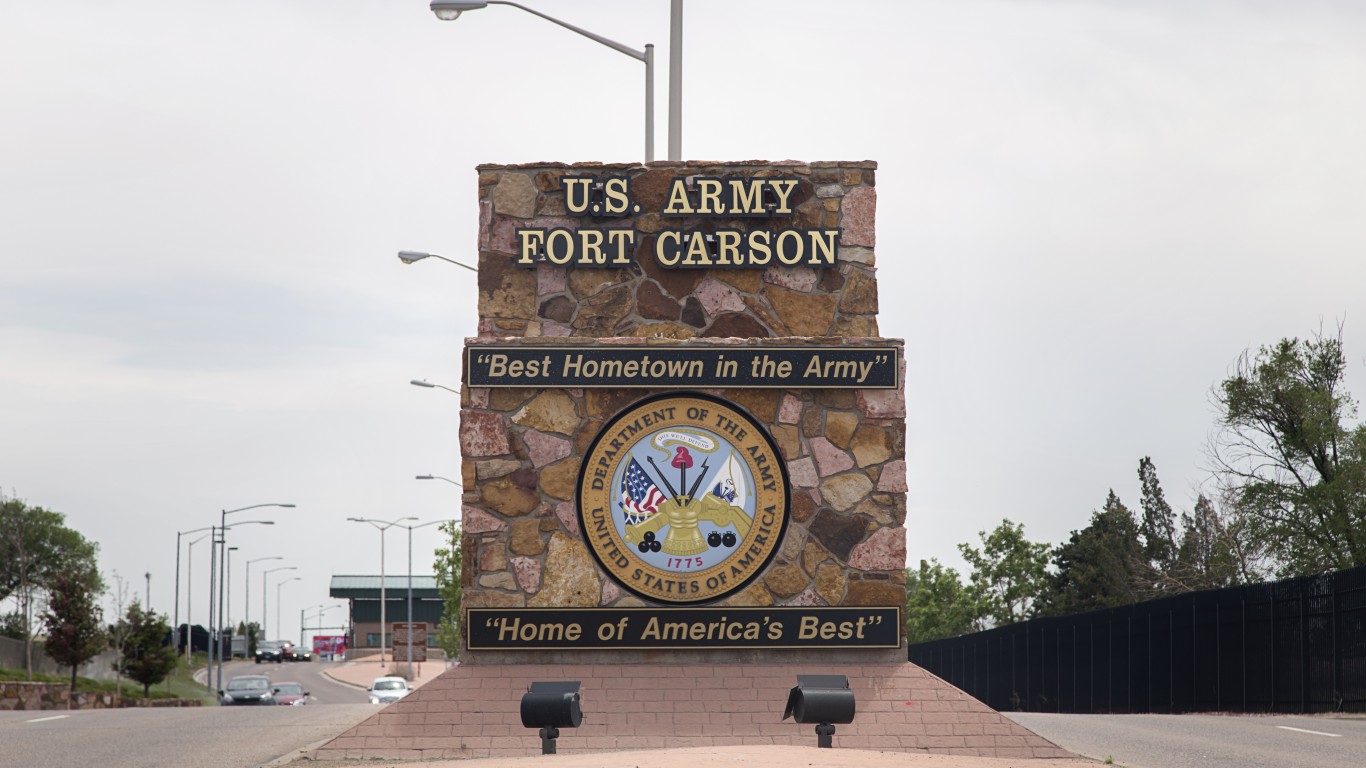
- 2021 Per Capita Defense Spending: $2,138 (12th highest)
- Active-Duty Military Personnel (September 2022): 37,990 (651 per 100,000)
- Military Sites: 10
10. Kansas
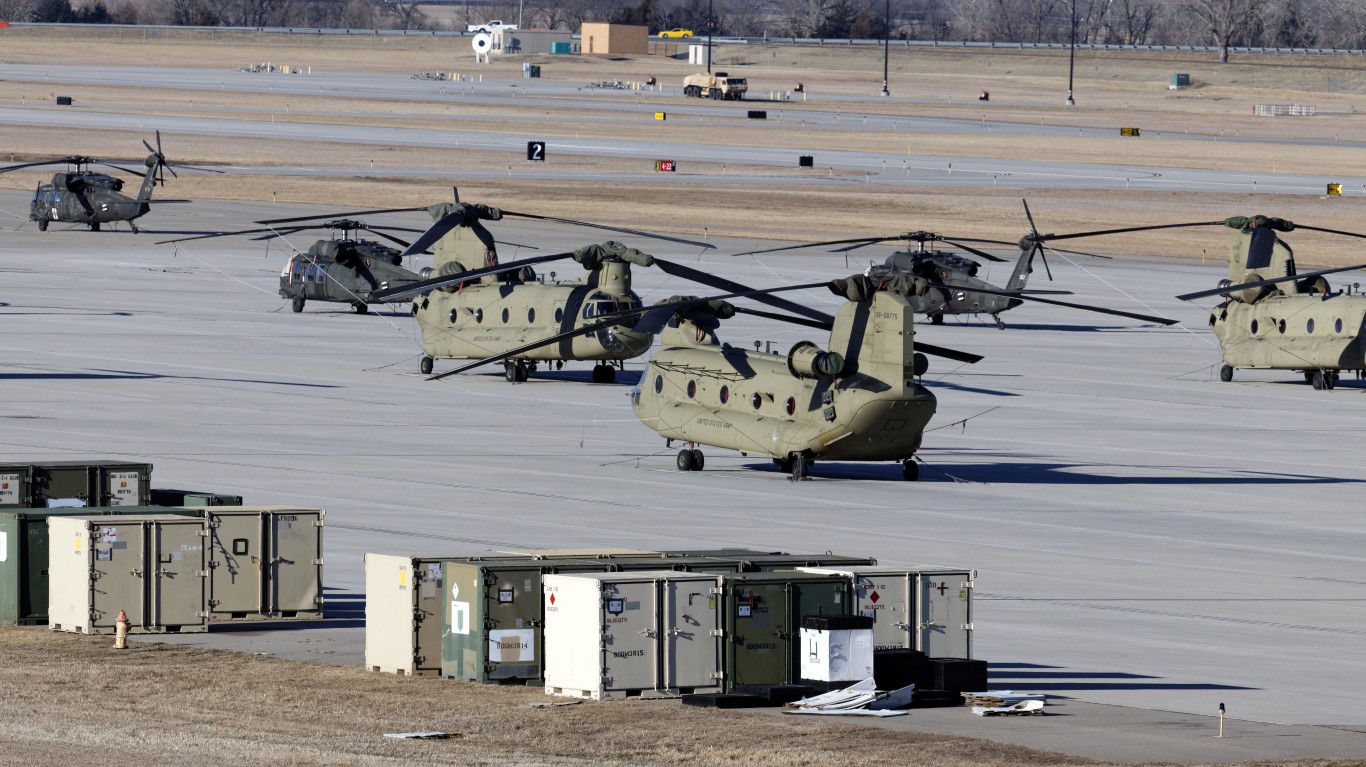
- 2021 Per Capita Defense Spending: $1,263 (25th lowest)
- Active-Duty Military Personnel (September 2022): 20,566 (700 per 100,000)
- Military Sites: 7
9. South Carolina

- 2021 Per Capita Defense Spending: $1,179 (24th lowest)
- Active-Duty Military Personnel (September 2022): 38,322 (725 per 100,000)
- Military Sites: 14
8. Kentucky

- 2021 Per Capita Defense Spending: $3,068 (8th highest)
- Active-Duty Military Personnel (September 2022): 34,608 (767 per 100,000)
- Military Sites: 6
7. Washington

- 2021 Per Capita Defense Spending: $2,470 (10th highest)
- Active-Duty Military Personnel (September 2022): 62,130 (798 per 100,000)
- Military Sites: 20
6. North Carolina
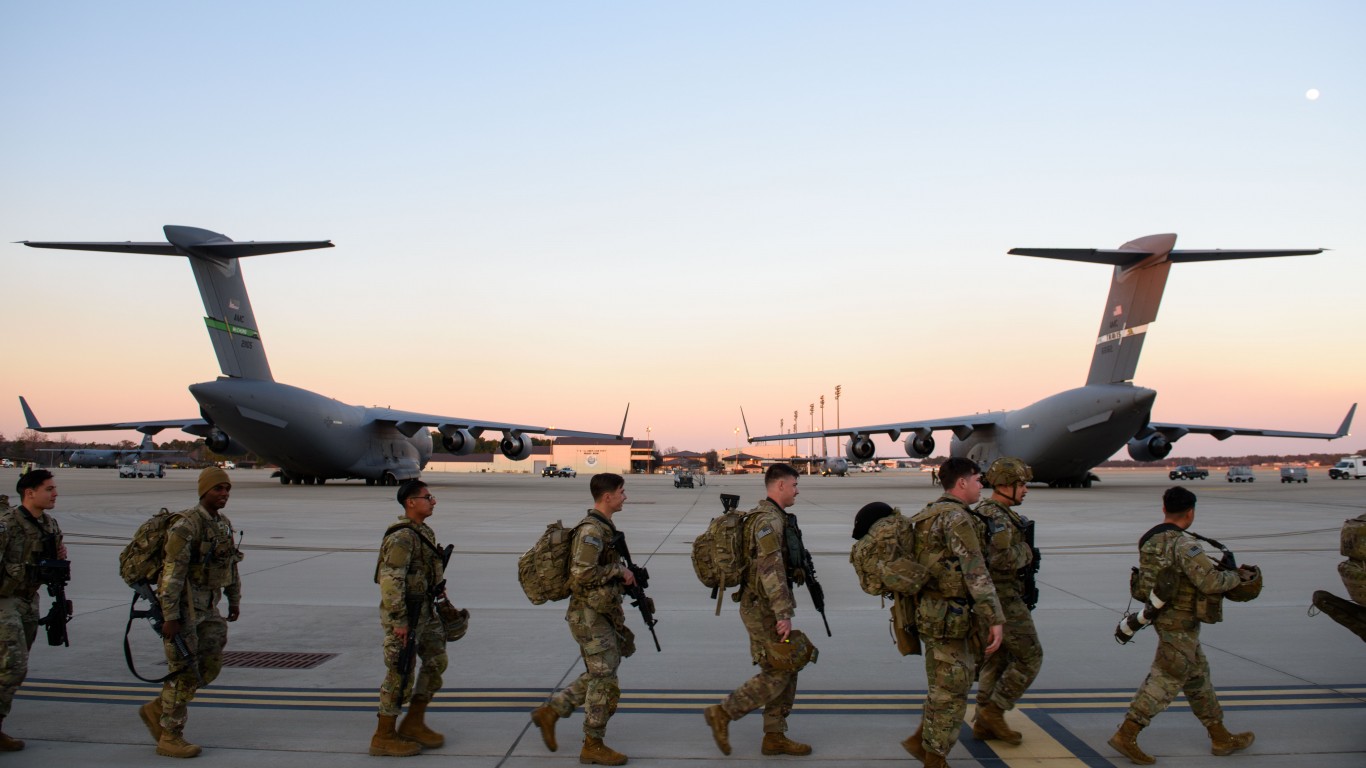
- 2021 Per Capita Defense Spending: $1,113 (22nd lowest)
- Active-Duty Military Personnel (September 2022): 95,999 (897 per 100,000)
- Military Sites: 16
5. North Dakota
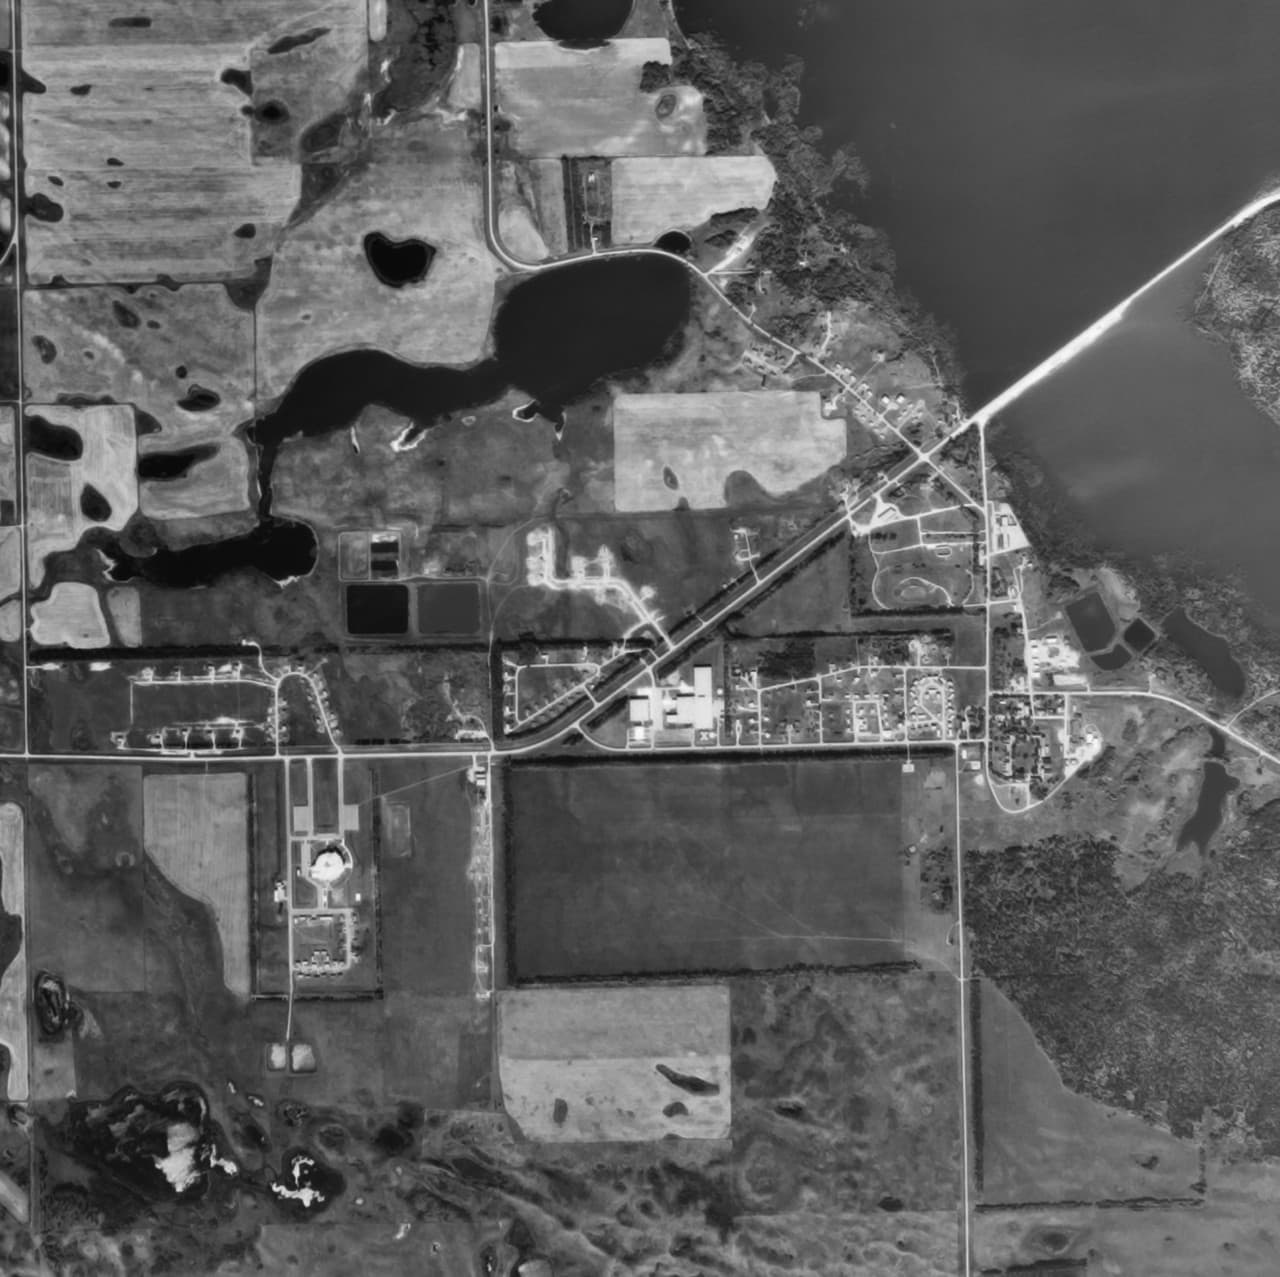
- 2021 Per Capita Defense Spending: $1,165 (23rd lowest)
- Active-Duty Military Personnel (September 2022): 7,272 (933 per 100,000)
- Military Sites: 7
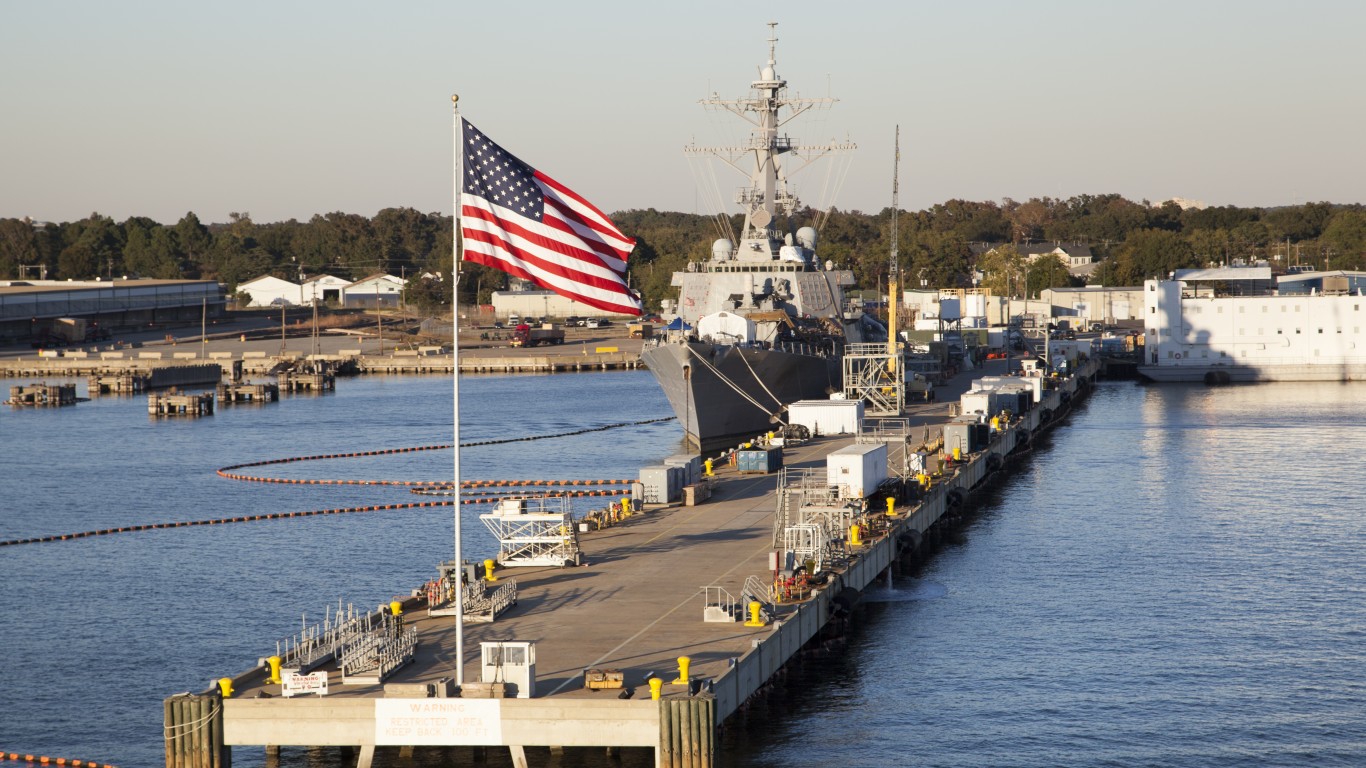
4. Virginia
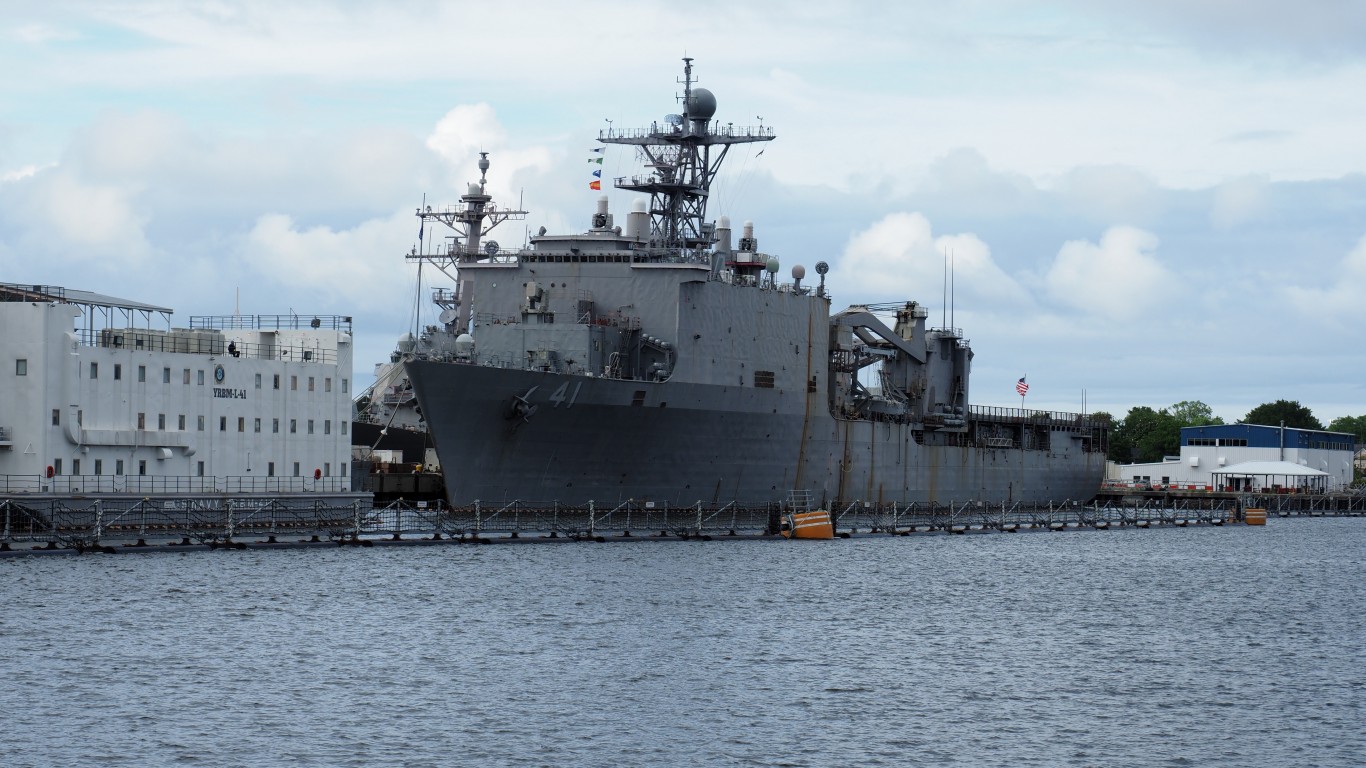
- 2021 Per Capita Defense Spending: $7,259 (2nd highest)
- Active-Duty Military Personnel (September 2022): 129,492 (1,491 per 100,000)
- Military Sites: 42
3. District Of Columbia

- 2021 Per Capita Defense Spending: $14,614 (highest)
- Active-Duty Military Personnel (September 2022): 11,024 (1,641 per 100,000)
- Military Sites: 5
2. Alaska
")
- 2021 Per Capita Defense Spending: $4,916 (5th highest)
- Active-Duty Military Personnel (September 2022): 20,206 (2,754 per 100,000)
- Military Sites: 39
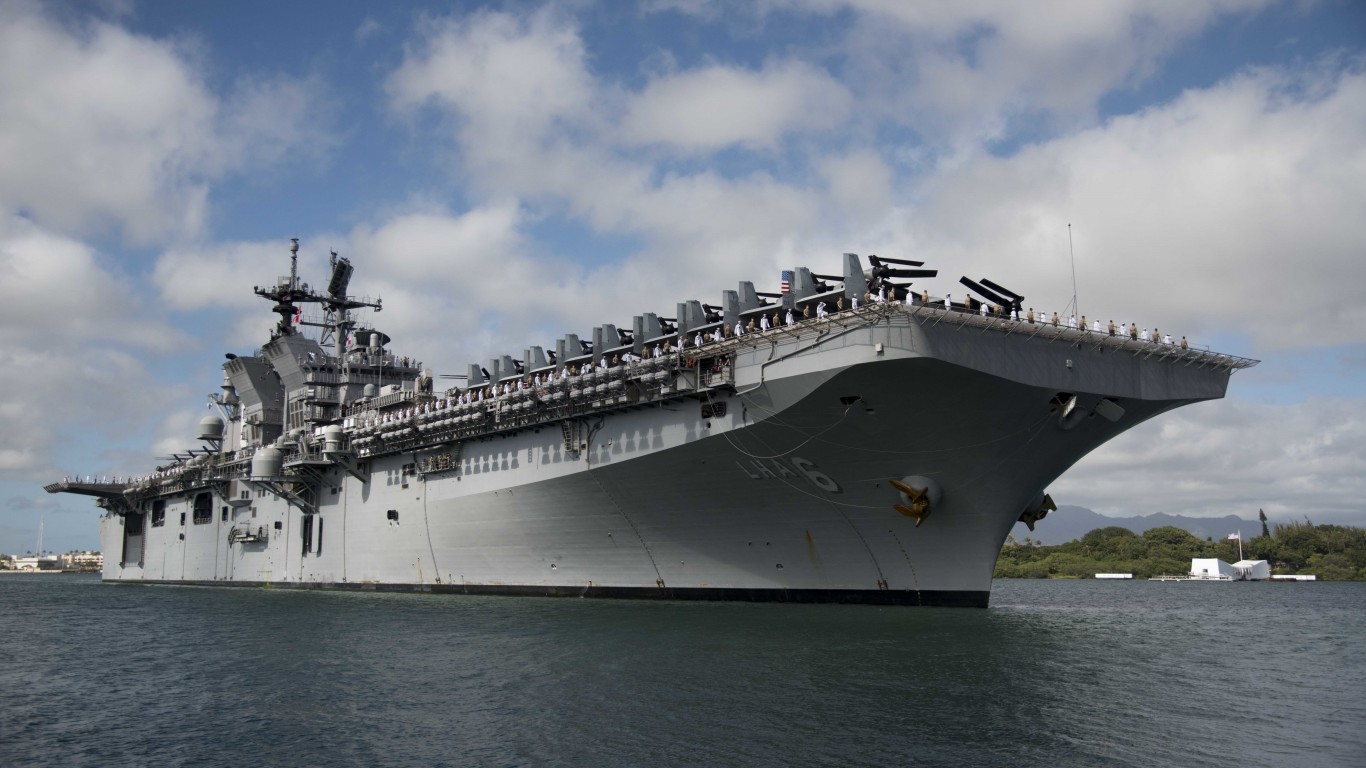
1. Hawaii
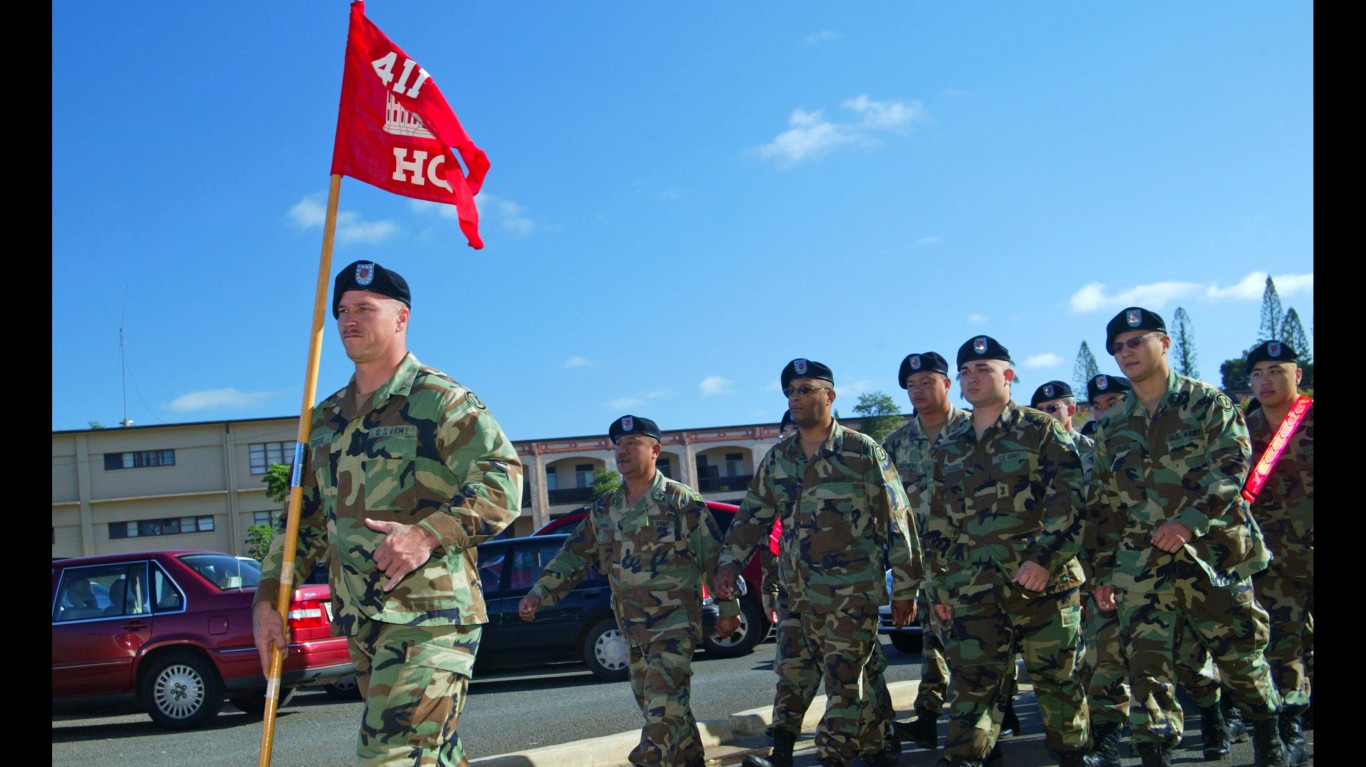
- 2021 Per Capita Defense Spending: $5,465 (3rd highest)
- Active-Duty Military Personnel (September 2022): 40,485 (2,811 per 100,000)
- Military Sites: 39