
24/7 Wall St. Insights
- Although they can begin receiving full retirement benefits at age 66 to 67, many seniors are staying in the workforce.
- Many seniors are working past retirement due to financial need, but others enjoy working and often live in wealthier areas.
- Also: 2 Dividend Legends To Hold Forever
While much of the United States has an obsession with youth, Baby Boomers are making a comeback even in their senior years as they continue to work well past the traditional retirement age. Financial necessity is a factor for some, but many seniors simply enjoy working. In addition, thanks to advancements in healthcare, today’s seniors are healthier than they have been historically, which means they can share their valuable experience in the workplace for much longer than ever before.
These days, you can become eligible for partial Social Security retirement benefits at age 62 and reach full retirement age for 100% benefits at 66 to 67 years old, depending on the year you were born. But not everyone retires in their 60s of course, as some retiree-aged individuals need to work to supplement their income. However, others simply prefer to remain in the workforce. In fact, 18.3% of 65+ Americans were in the labor force in 2023, which is nearly double the share 35 years ago. What’s more, 62% of older workers are working full time, compared with 47% in 1987, according to Pew Research.
So, where in the country are most older Americans still working? To find out, 24/7 Wall St. reviewed five-year data on age and employment status from the U.S. Census Bureau’s 2022 American Community Survey. Cities, towns, and census-designated places were ranked based on the percentage of the population 65 years and older in the labor force, either as employed workers or unemployed workers seeking jobs. These are listed in ascending order of the percentage of senior workers in each city. (This is the Best County in Each State to Retire in.)
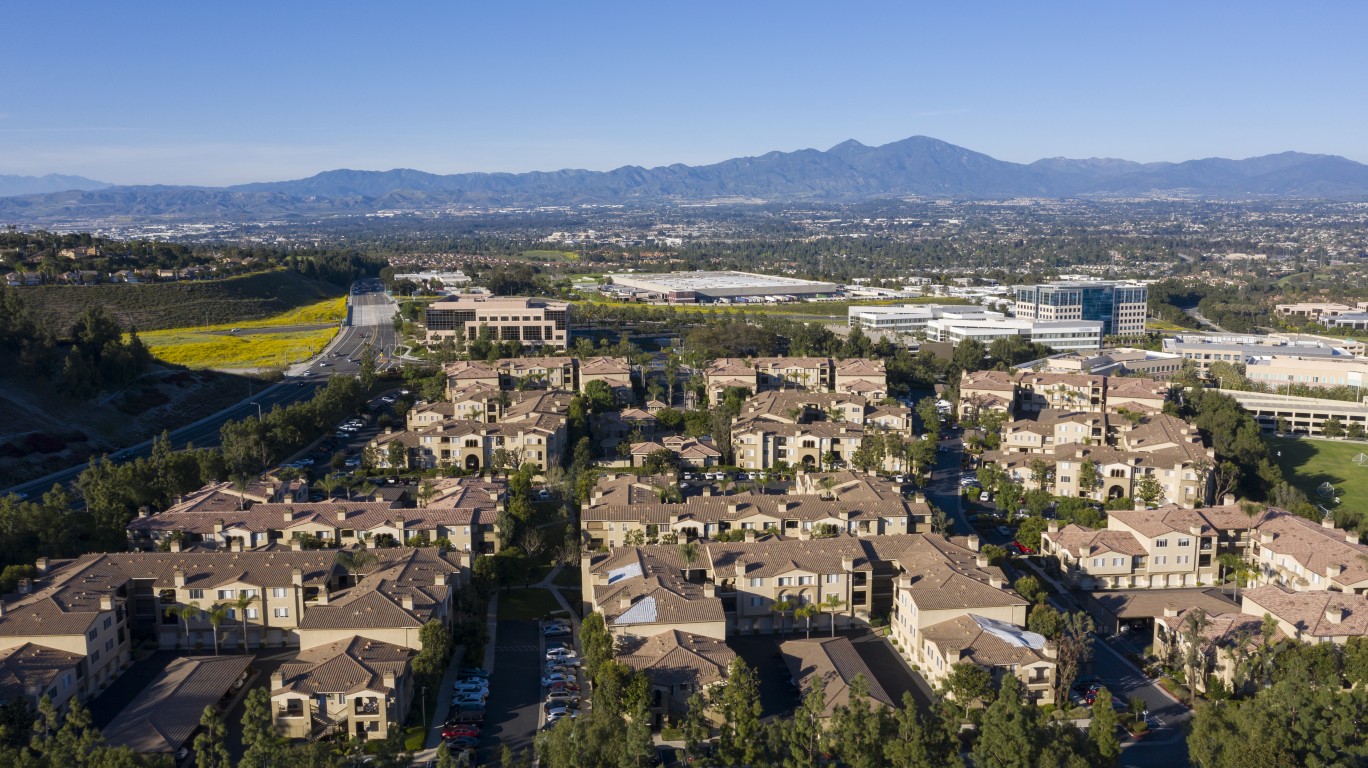
In the 50 cities on the list, at least one in four of those 65 and older are in the labor force. These cities are mostly wealthy — 41 have median household incomes above the comparable national median of $75,149. Similarly, in 45 of these cities, the median income among the 65+ population is higher than the comparable national median of $54,699. Many of these cities also tend to have a large share of white-collar jobs that are not as physically demanding. (This is what it costs to retire in every state.)
Most of the cities on this list are in the South. For example, eight are in Texas, seven in Maryland, and five in Virginia. In the West, California leads with six cities on the list, while Massachusetts in the Northeast has four. (These are the most and least expensive states to retire in.)
Why This Matters

These cities are home to the most older Americans still in the workforce.
50. Nashua, New Hampshire

- Population 65 years and over in labor force, 2022: 25.6%
- Median household income 65 years and over, 2022: $57,993
- Median household income overall, 2022: $88,766
- Population 65 years and over, 2022: 14,953 or 16.4% of total pop
- Total population, 2022: 90,943
49. Centennial, Colorado

- Population 65 years and over in labor force, 2022: 25.7%
- Median household income 65 years and over, 2022: $88,530
- Median household income overall, 2022: $124,617
- Population 65 years and over, 2022: 19,244 or 17.9% of total pop
- Total population, 2022: 107,702
48. Wichita Falls, Texas

- Population 65 years and over in labor force, 2022: 25.7%
- Median household income 65 years and over, 2022: $45,617
- Median household income overall, 2022: $55,584
- Population 65 years and over, 2022: 14,382 or 14.0% of total pop
- Total population, 2022: 102,482
47. Richardson, Texas

- Population 65 years and over in labor force, 2022: 25.8%
- Median household income 65 years and over, 2022: $70,627
- Median household income overall, 2022: $94,362
- Population 65 years and over, 2022: 14,931 or 12.6% of total pop
- Total population, 2022: 118,063
46. Kenner, Louisiana

- Population 65 years and over in labor force, 2022: 25.9%
- Median household income 65 years and over, 2022: $49,223
- Median household income overall, 2022: $60,557
- Population 65 years and over, 2022: 11,469 or 17.4% of total pop
- Total population, 2022: 65,785
45. Irvine, California
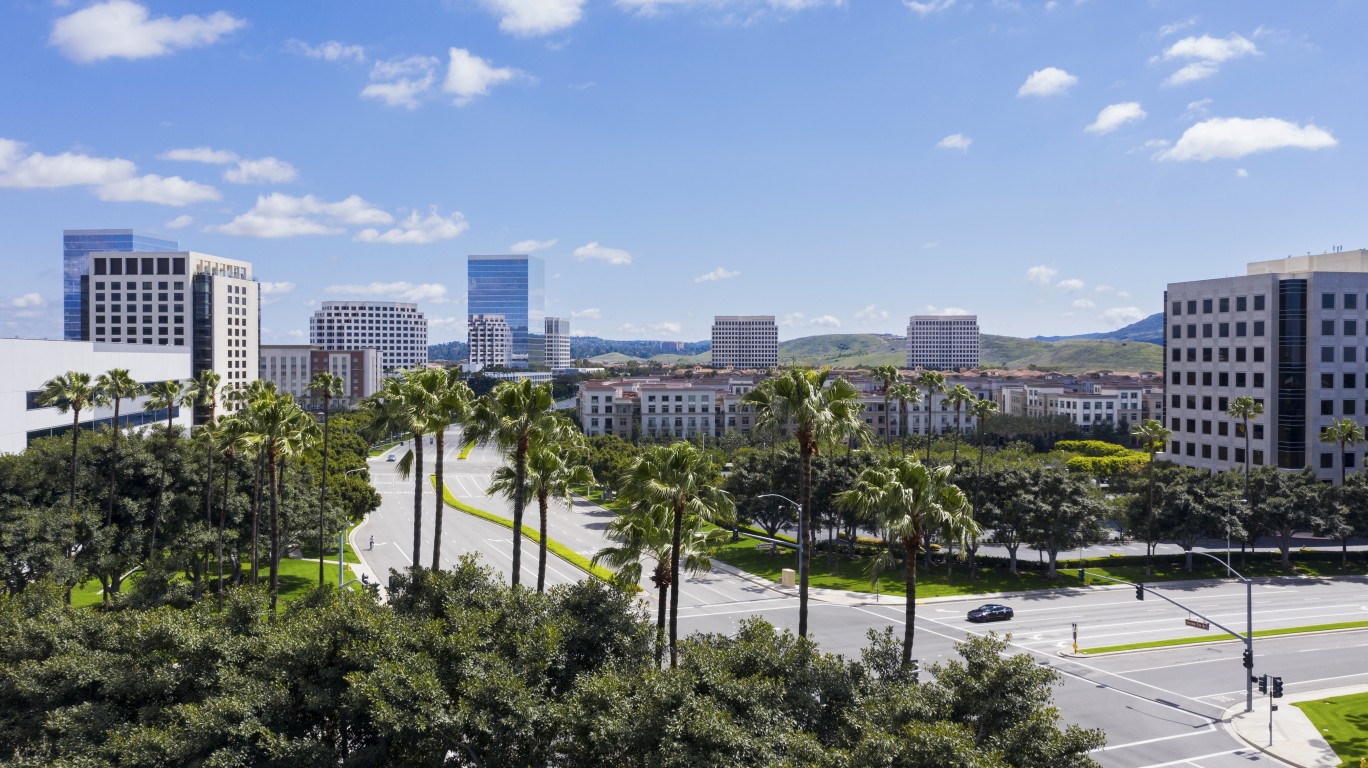
- Population 65 years and over in labor force, 2022: 25.9%
- Median household income 65 years and over, 2022: $90,158
- Median household income overall, 2022: $122,948
- Population 65 years and over, 2022: 31,799 or 10.4% of total pop
- Total population, 2022: 304,527
44. Columbia, Maryland
- Population 65 years and over in labor force, 2022: 25.9%
- Median household income 65 years and over, 2022: $101,563
- Median household income overall, 2022: $124,537
- Population 65 years and over, 2022: 17,359 or 16.3% of total pop
- Total population, 2022: 106,600
43. Costa Mesa, California

- Population 65 years and over in labor force, 2022: 26.1%
- Median household income 65 years and over, 2022: $66,155
- Median household income overall, 2022: $104,981
- Population 65 years and over, 2022: 14,448 or 13.0% of total pop
- Total population, 2022: 111,490
42. Allen, Texas
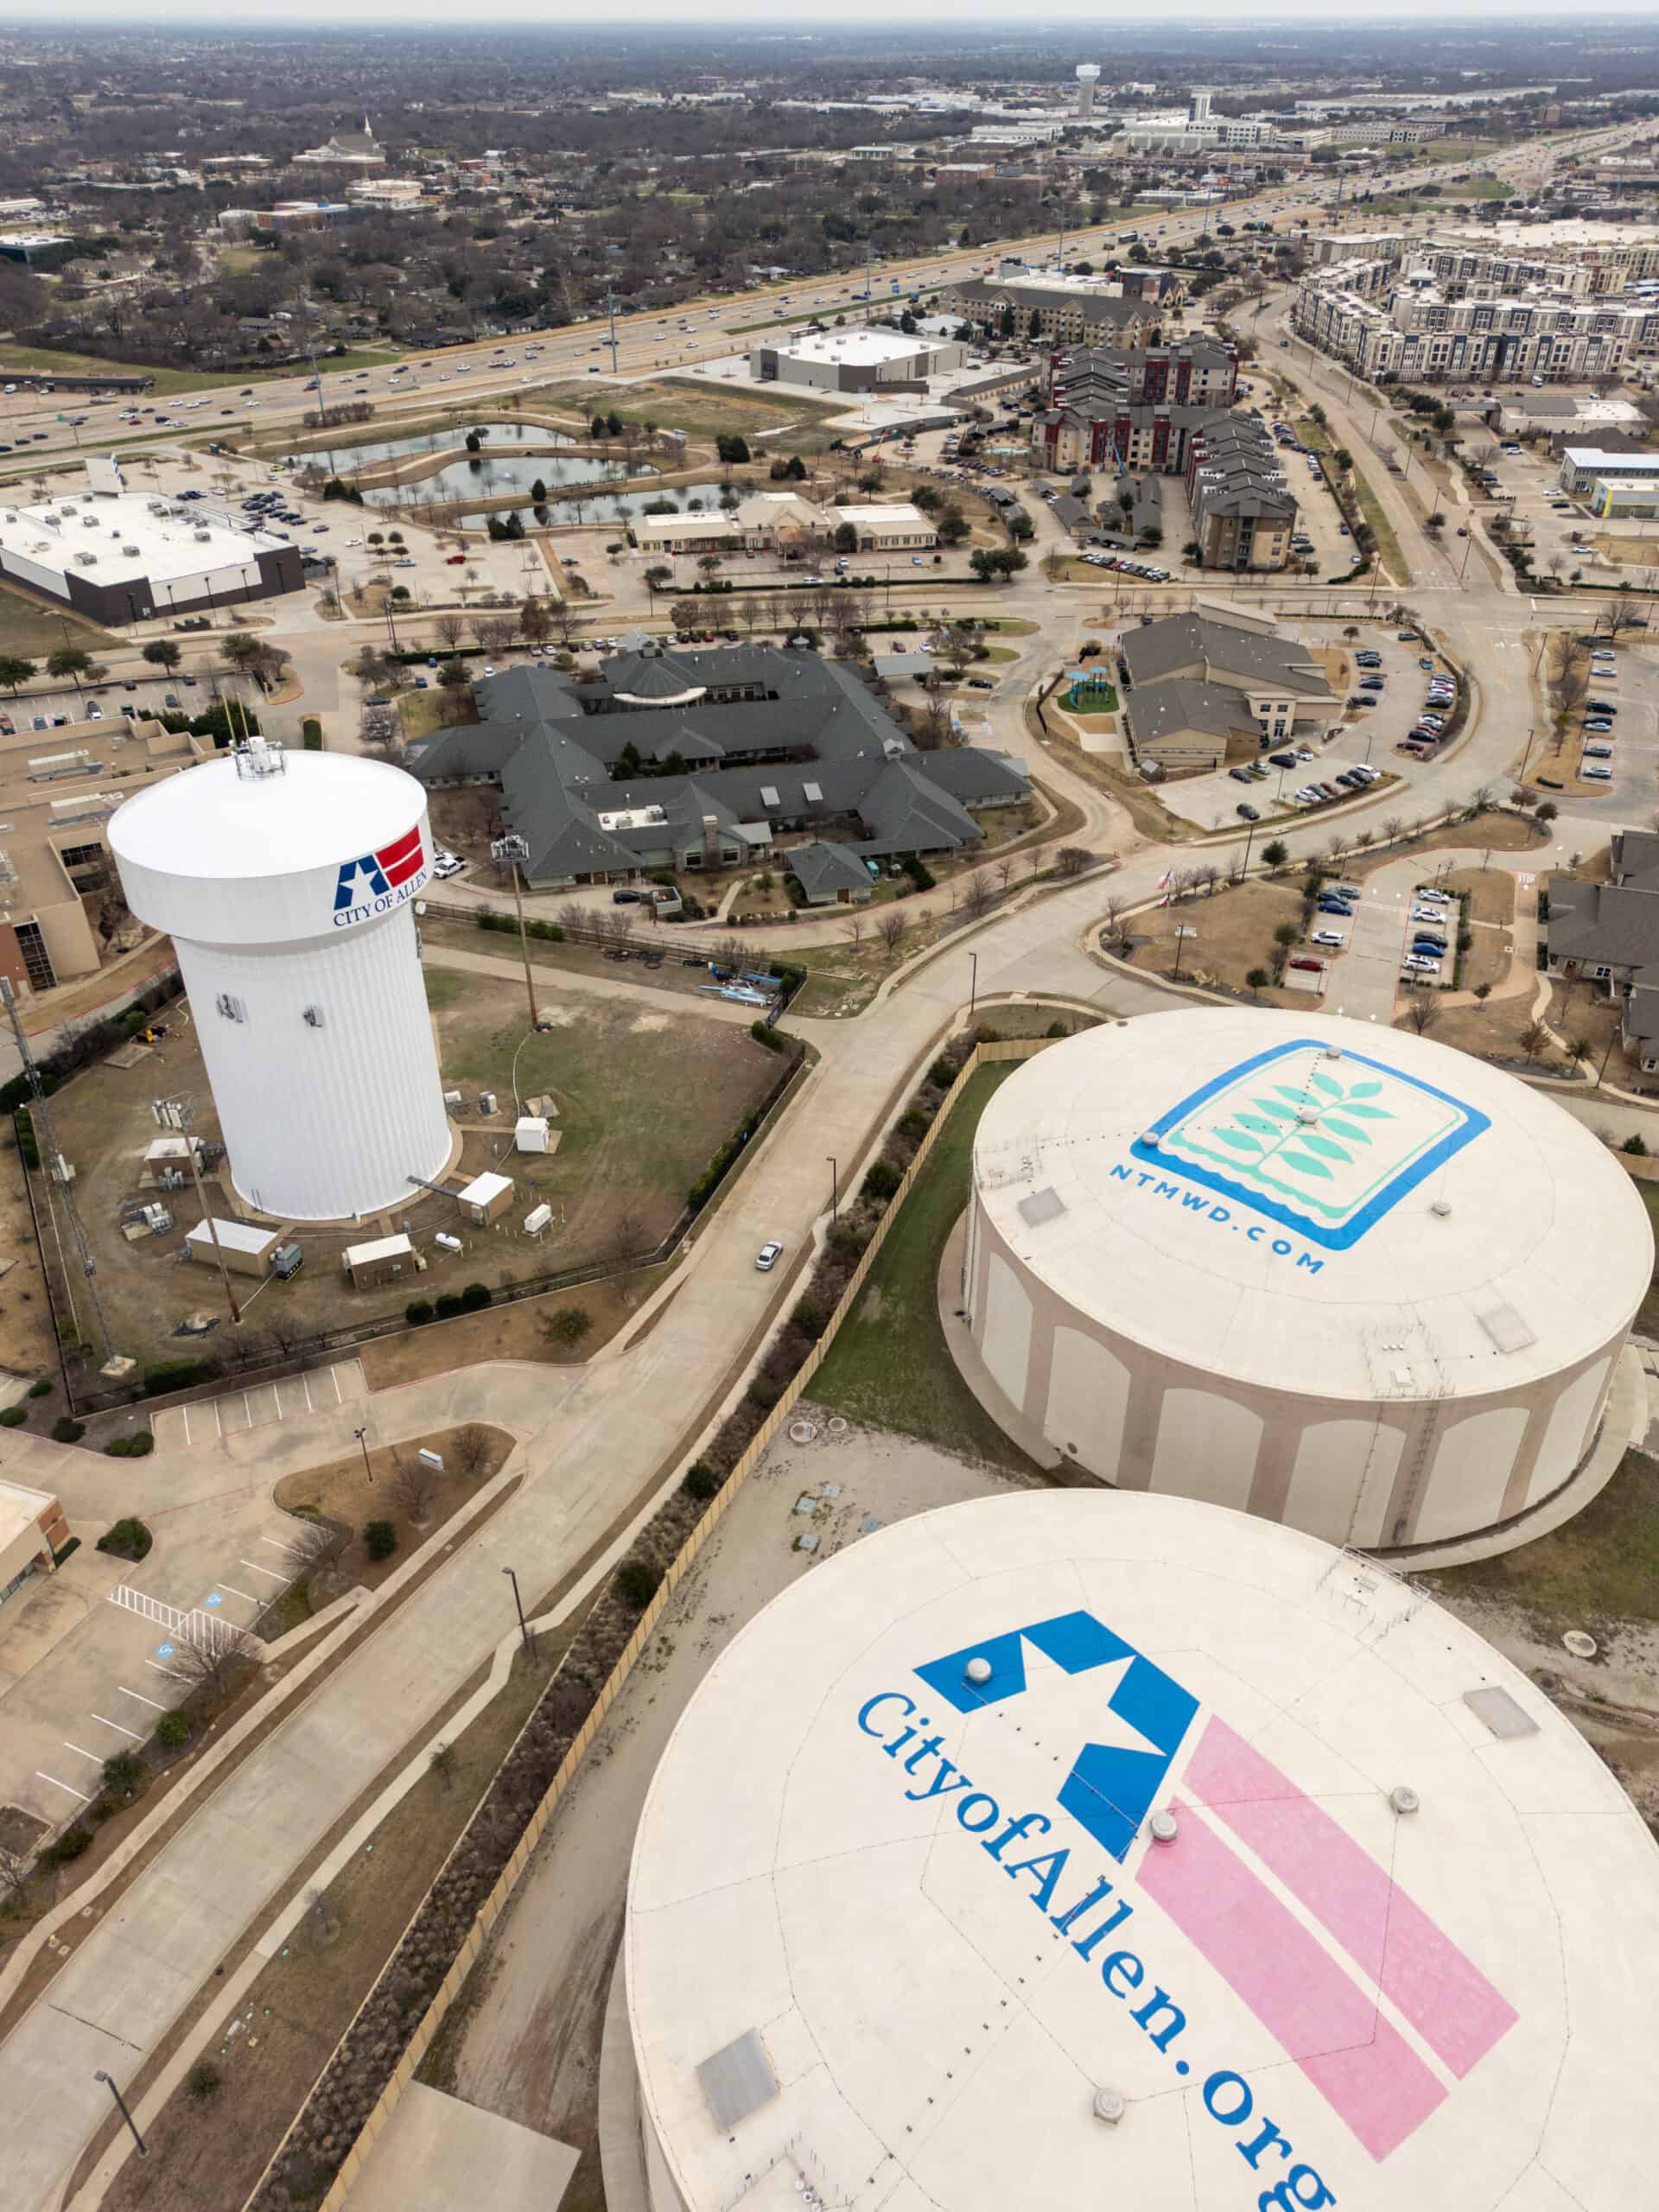
- Population 65 years and over in labor force, 2022: 26.1%
- Median household income 65 years and over, 2022: $74,283
- Median household income overall, 2022: $121,259
- Population 65 years and over, 2022: 10,980 or 10.4% of total pop
- Total population, 2022: 105,444
41. Norwalk, Connecticut

- Population 65 years and over in labor force, 2022: 26.1%
- Median household income 65 years and over, 2022: $65,934
- Median household income overall, 2022: $97,879
- Population 65 years and over, 2022: 14,373 or 15.8% of total pop
- Total population, 2022: 91,050
40. Hoffman Estates, Illinois
- Population 65 years and over in labor force, 2022: 26.3%
- Median household income 65 years and over, 2022: $85,291
- Median household income overall, 2022: $107,428
- Population 65 years and over, 2022: 6,917 or 13.4% of total pop
- Total population, 2022: 51,744
39. Miami Beach, Florida

- Population 65 years and over in labor force, 2022: 26.4%
- Median household income 65 years and over, 2022: $35,881
- Median household income overall, 2022: $65,116
- Population 65 years and over, 2022: 14,986 or 18.2% of total pop
- Total population, 2022: 82,400
38. Metairie, Louisiana

- Population 65 years and over in labor force, 2022: 26.5%
- Median household income 65 years and over, 2022: $61,017
- Median household income overall, 2022: $72,070
- Population 65 years and over, 2022: 30,139 or 21.5% of total pop
- Total population, 2022: 140,046
37. Euless, Texas

- Population 65 years and over in labor force, 2022: 26.5%
- Median household income 65 years and over, 2022: $69,134
- Median household income overall, 2022: $77,403
- Population 65 years and over, 2022: 6,427 or 10.6% of total pop
- Total population, 2022: 60,360
36. Harrisonburg, Virginia

- Population 65 years and over in labor force, 2022: 26.6%
- Median household income 65 years and over, 2022: $59,409
- Median household income overall, 2022: $56,050
- Population 65 years and over, 2022: 4,975 or 9.6% of total pop
- Total population, 2022: 51,784
35. Santa Monica, California

- Population 65 years and over in labor force, 2022: 26.6%
- Median household income 65 years and over, 2022: $56,928
- Median household income overall, 2022: $106,797
- Population 65 years and over, 2022: 17,340 or 18.8% of total pop
- Total population, 2022: 92,168
34. Reston, Virginia

- Population 65 years and over in labor force, 2022: 26.7%
- Median household income 65 years and over, 2022: $99,727
- Median household income overall, 2022: $135,503
- Population 65 years and over, 2022: 10,378 or 16.6% of total pop
- Total population, 2022: 62,339
33. Bowie, Maryland
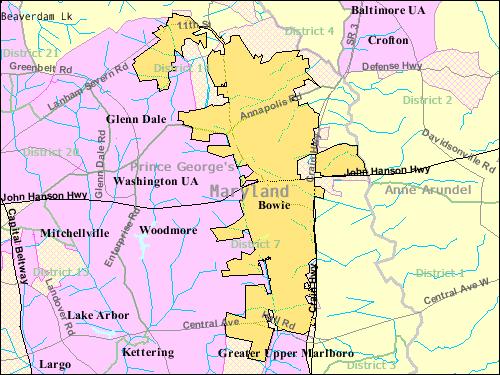
- Population 65 years and over in labor force, 2022: 26.8%
- Median household income 65 years and over, 2022: $88,328
- Median household income overall, 2022: $138,797
- Population 65 years and over, 2022: 8,579 or 14.8% of total pop
- Total population, 2022: 57,922
32. Alpharetta, Georgia
- Population 65 years and over in labor force, 2022: 26.8%
- Median household income 65 years and over, 2022: $58,237
- Median household income overall, 2022: $141,402
- Population 65 years and over, 2022: 7,111 or 10.8% of total pop
- Total population, 2022: 65,884
31. Lafayette, Louisiana

- Population 65 years and over in labor force, 2022: 27.0%
- Median household income 65 years and over, 2022: $49,795
- Median household income overall, 2022: $58,850
- Population 65 years and over, 2022: 20,336 or 16.7% of total pop
- Total population, 2022: 121,706
30. Newport Beach, California

- Population 65 years and over in labor force, 2022: 27.0%
- Median household income 65 years and over, 2022: $120,214
- Median household income overall, 2022: $149,471
- Population 65 years and over, 2022: 19,825 or 23.3% of total pop
- Total population, 2022: 85,159
29. Lakewood, New Jersey

- Population 65 years and over in labor force, 2022: 27.1%
- Median household income 65 years and over, 2022: $40,776
- Median household income overall, 2022: $54,826
- Population 65 years and over, 2022: 3,651 or 5.3% of total pop
- Total population, 2022: 68,555
28. Arlington, Virginia

- Population 65 years and over in labor force, 2022: 27.1%
- Median household income 65 years and over, 2022: $97,795
- Median household income overall, 2022: $137,387
- Population 65 years and over, 2022: 26,573 or 11.3% of total pop
- Total population, 2022: 235,845
27. Stamford, Connecticut

- Population 65 years and over in labor force, 2022: 27.3%
- Median household income 65 years and over, 2022: $69,187
- Median household income overall, 2022: $100,718
- Population 65 years and over, 2022: 20,725 or 15.3% of total pop
- Total population, 2022: 135,413
26. Collierville, Tennessee

- Population 65 years and over in labor force, 2022: 27.4%
- Median household income 65 years and over, 2022: $84,339
- Median household income overall, 2022: $129,729
- Population 65 years and over, 2022: 7,496 or 14.6% of total pop
- Total population, 2022: 51,170
25. Plano, Texas

- Population 65 years and over in labor force, 2022: 27.4%
- Median household income 65 years and over, 2022: $75,838
- Median household income overall, 2022: $105,679
- Population 65 years and over, 2022: 38,963 or 13.7% of total pop
- Total population, 2022: 284,948
24. Gaithersburg, Maryland
- Population 65 years and over in labor force, 2022: 27.6%
- Median household income 65 years and over, 2022: $96,250
- Median household income overall, 2022: $104,544
- Population 65 years and over, 2022: 9,160 or 13.3% of total pop
- Total population, 2022: 69,016
23. Palatine, Illinois

- Population 65 years and over in labor force, 2022: 27.6%
- Median household income 65 years and over, 2022: $72,563
- Median household income overall, 2022: $93,383
- Population 65 years and over, 2022: 10,420 or 15.5% of total pop
- Total population, 2022: 67,223
22. Plainfield, New Jersey

- Population 65 years and over in labor force, 2022: 27.7%
- Median household income 65 years and over, 2022: $68,005
- Median household income overall, 2022: $70,712
- Population 65 years and over, 2022: 5,846 or 10.8% of total pop
- Total population, 2022: 54,358
21. Framingham, Massachusetts
- Population 65 years and over in labor force, 2022: 27.8%
- Median household income 65 years and over, 2022: $71,250
- Median household income overall, 2022: $94,909
- Population 65 years and over, 2022: 11,914 or 16.6% of total pop
- Total population, 2022: 71,805
20. Irving, Texas

- Population 65 years and over in labor force, 2022: 27.9%
- Median household income 65 years and over, 2022: $57,727
- Median household income overall, 2022: $76,686
- Population 65 years and over, 2022: 21,229 or 8.3% of total pop
- Total population, 2022: 254,962
19. Eden Prairie, Minnesota
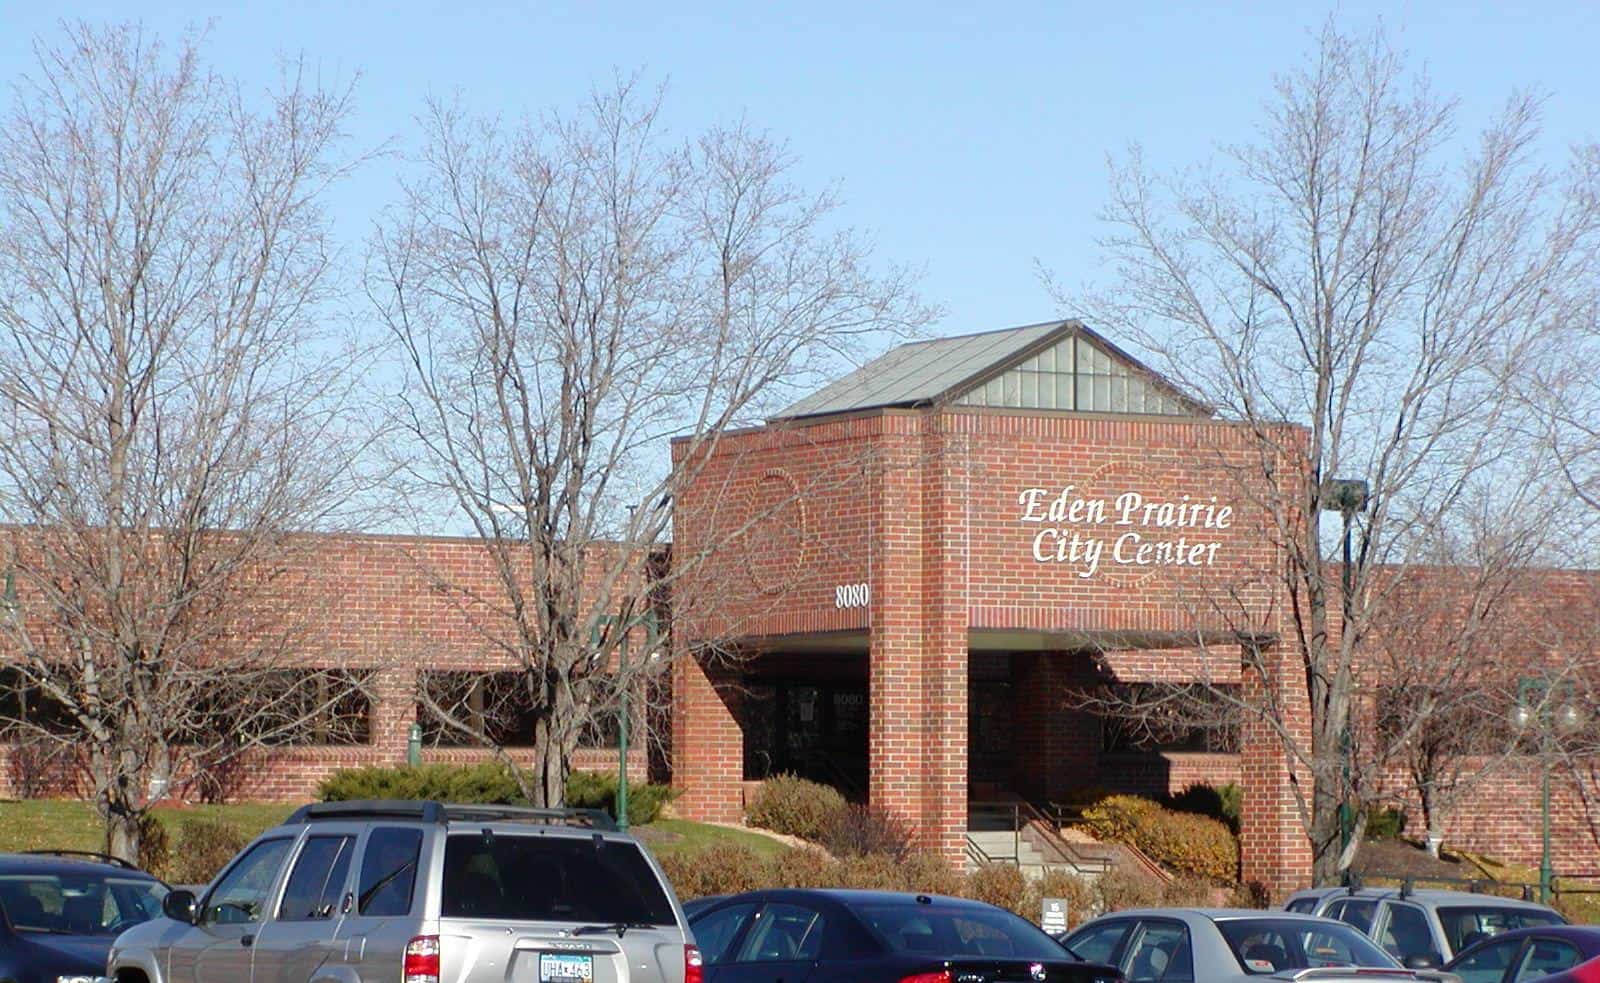
- Population 65 years and over in labor force, 2022: 28.0%
- Median household income 65 years and over, 2022: $85,446
- Median household income overall, 2022: $129,345
- Population 65 years and over, 2022: 9,117 or 14.3% of total pop
- Total population, 2022: 63,623
18. Wheaton, Maryland

- Population 65 years and over in labor force, 2022: 28.1%
- Median household income 65 years and over, 2022: $89,688
- Median household income overall, 2022: $101,229
- Population 65 years and over, 2022: 6,418 or 12.2% of total pop
- Total population, 2022: 52,775
17. Doral, Florida
- Population 65 years and over in labor force, 2022: 28.2%
- Median household income 65 years and over, 2022: $57,381
- Median household income overall, 2022: $83,823
- Population 65 years and over, 2022: 6,029 or 8.1% of total pop
- Total population, 2022: 74,891
16. Grapevine, Texas

- Population 65 years and over in labor force, 2022: 28.8%
- Median household income 65 years and over, 2022: $68,601
- Median household income overall, 2022: $107,165
- Population 65 years and over, 2022: 6,628 or 13.1% of total pop
- Total population, 2022: 50,763
15. Minnetonka, Minnesota

- Population 65 years and over in labor force, 2022: 28.9%
- Median household income 65 years and over, 2022: $81,355
- Median household income overall, 2022: $114,867
- Population 65 years and over, 2022: 11,445 or 21.4% of total pop
- Total population, 2022: 53,529
14. Lawrence, Kansas
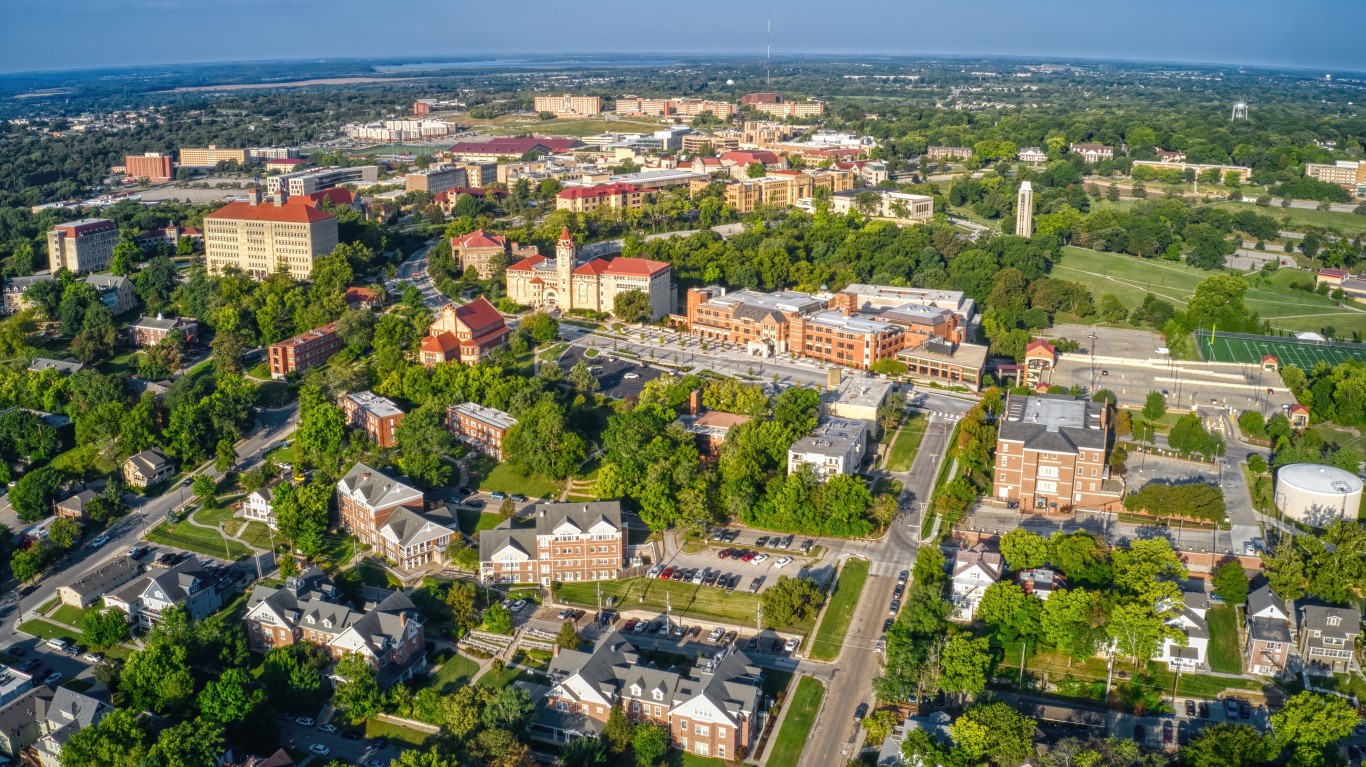
- Population 65 years and over in labor force, 2022: 28.9%
- Median household income 65 years and over, 2022: $64,902
- Median household income overall, 2022: $59,834
- Population 65 years and over, 2022: 11,754 or 12.4% of total pop
- Total population, 2022: 95,103
13. Sandy Springs, Georgia

- Population 65 years and over in labor force, 2022: 29.2%
- Median household income 65 years and over, 2022: $77,395
- Median household income overall, 2022: $93,303
- Population 65 years and over, 2022: 15,195 or 14.2% of total pop
- Total population, 2022: 107,221
12. Centreville, Virginia

- Population 65 years and over in labor force, 2022: 29.5%
- Median household income 65 years and over, 2022: $94,207
- Median household income overall, 2022: $136,679
- Population 65 years and over, 2022: 7,711 or 10.6% of total pop
- Total population, 2022: 72,680
11. Evanston, Illinois
- Population 65 years and over in labor force, 2022: 30.0%
- Median household income 65 years and over, 2022: $85,567
- Median household income overall, 2022: $93,188
- Population 65 years and over, 2022: 13,333 or 17.3% of total pop
- Total population, 2022: 77,181
10. Laguna Niguel, California

- Population 65 years and over in labor force, 2022: 30.6%
- Median household income 65 years and over, 2022: $109,317
- Median household income overall, 2022: $135,822
- Population 65 years and over, 2022: 13,063 or 20.3% of total pop
- Total population, 2022: 64,259
9. Bethesda, Maryland

- Population 65 years and over in labor force, 2022: 31.7%
- Median household income 65 years and over, 2022: $161,932
- Median household income overall, 2022: $185,546
- Population 65 years and over, 2022: 12,410 or 18.7% of total pop
- Total population, 2022: 66,316
8. Alexandria, Virginia

- Population 65 years and over in labor force, 2022: 31.7%
- Median household income 65 years and over, 2022: $94,017
- Median household income overall, 2022: $113,179
- Population 65 years and over, 2022: 19,445 or 12.3% of total pop
- Total population, 2022: 157,594
7. Aliso Viejo, California
- Population 65 years and over in labor force, 2022: 31.8%
- Median household income 65 years and over, 2022: $74,671
- Median household income overall, 2022: $131,708
- Population 65 years and over, 2022: 5,054 or 9.7% of total pop
- Total population, 2022: 51,896
6. Newton, Massachusetts
- Population 65 years and over in labor force, 2022: 32.6%
- Median household income 65 years and over, 2022: $116,518
- Median household income overall, 2022: $176,373
- Population 65 years and over, 2022: 16,540 or 18.7% of total pop
- Total population, 2022: 88,453
5. Carrollton, Texas

- Population 65 years and over in labor force, 2022: 32.9%
- Median household income 65 years and over, 2022: $65,048
- Median household income overall, 2022: $95,380
- Population 65 years and over, 2022: 17,122 or 12.9% of total pop
- Total population, 2022: 132,284
4. Brookline, Massachusetts

- Population 65 years and over in labor force, 2022: 33.3%
- Median household income 65 years and over, 2022: $96,643
- Median household income overall, 2022: $130,600
- Population 65 years and over, 2022: 9,931 or 15.8% of total pop
- Total population, 2022: 62,698
3. Silver Spring, Maryland

- Population 65 years and over in labor force, 2022: 33.6%
- Median household income 65 years and over, 2022: $86,200
- Median household income overall, 2022: $95,213
- Population 65 years and over, 2022: 9,683 or 11.8% of total pop
- Total population, 2022: 81,808
2. Cambridge, Massachusetts

- Population 65 years and over in labor force, 2022: 33.7%
- Median household income 65 years and over, 2022: $85,079
- Median household income overall, 2022: $121,539
- Population 65 years and over, 2022: 14,020 or 11.9% of total pop
- Total population, 2022: 117,962
1. Germantown, Maryland
- Population 65 years and over in labor force, 2022: 35.6%
- Median household income 65 years and over, 2022: $84,447
- Median household income overall, 2022: $109,268
- Population 65 years and over, 2022: 9,617 or 10.7% of total pop
- Total population, 2022: 90,210