
Unemployment in the United States has declined nearly continuously for seven years straight. With an unemployment rate of 4.4% as of this July, the last time such a small share of the nation’s labor force was unemployed was roughly a decade ago.
A rising tide does not raise all boats, however, and there remain large parts of the country with economies mired in unemployment and vanishing job opportunities. There are four metropolitan areas in California alone where the July unemployment rate exceeds 10%. This includes El Centro, where a staggering 24% of the labor force is out of work.
To determine the worst places to find a job, 24/7 Wall St. reviewed the U.S. metropolitan areas that either had severe employment declines over the past year, extremely high unemployment, or both. These metropolitan areas are not just to be found in California, but are in a number of states throughout the West, Midwest, South, and Northeast.
Click here to see the worst cities to find a job.
Click here to see our detailed findings and methodology.
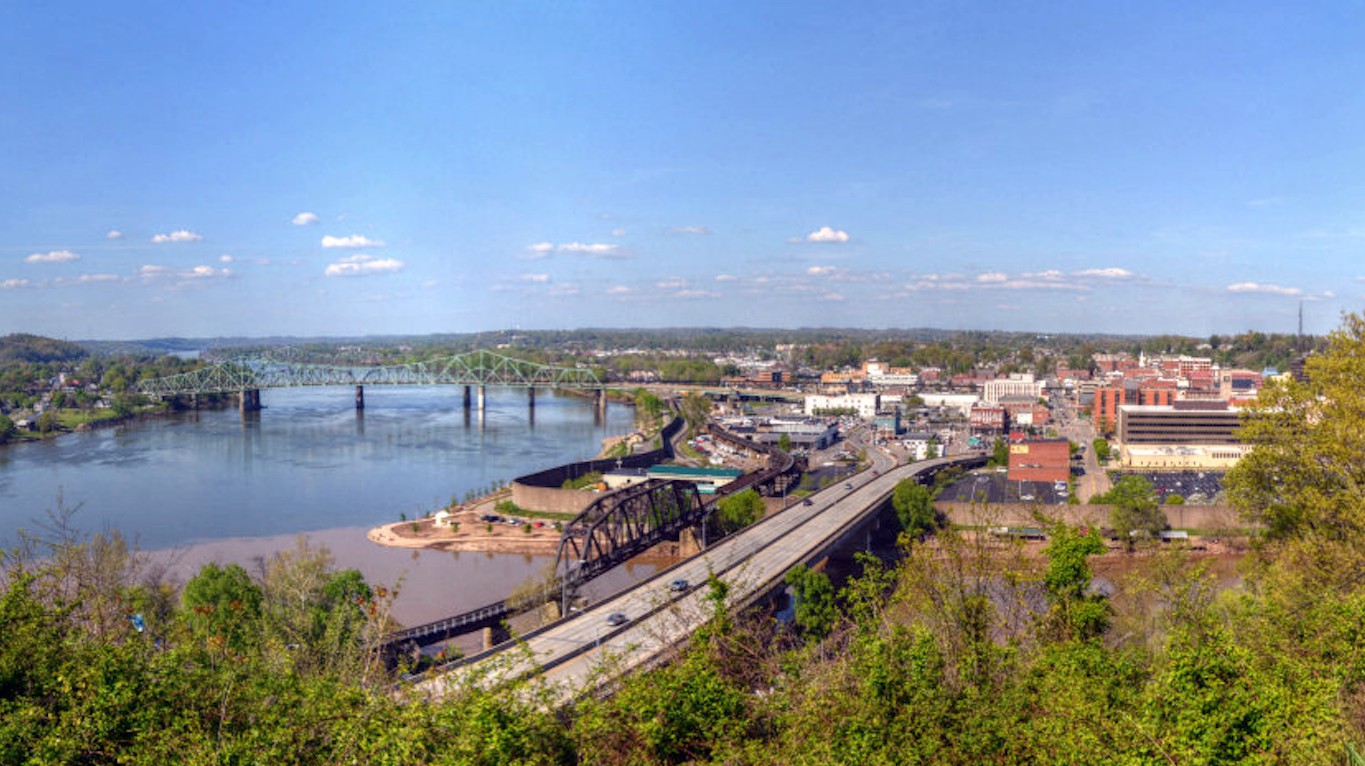
25. Parkersburg-Vienna, West Virginia
> July 2017 unemployment: 5.4%
> Labor force: 39,080
> Number unemployed: 2,112
> 1-year employment change: -0.7%
[in-text-ad]

24. Beaumont-Port Arthur, Texas
> July 2017 unemployment: 6.8%
> Labor force: 171,551
> Number unemployed: 11,720
> 1-year employment change: -0.2%
[recirclink id=405812]

23. Williamsport, Pennsylvania
> July 2017 unemployment: 5.9%
> Labor force: 57,452
> Number unemployed: 3,363
> 1-year employment change: -0.6%

22. Texarkana, Texas
> July 2017 unemployment: 4.7%
> Labor force: 64,952
> Number unemployed: 3,044
> 1-year employment change: -1.2%
[in-text-ad-2]
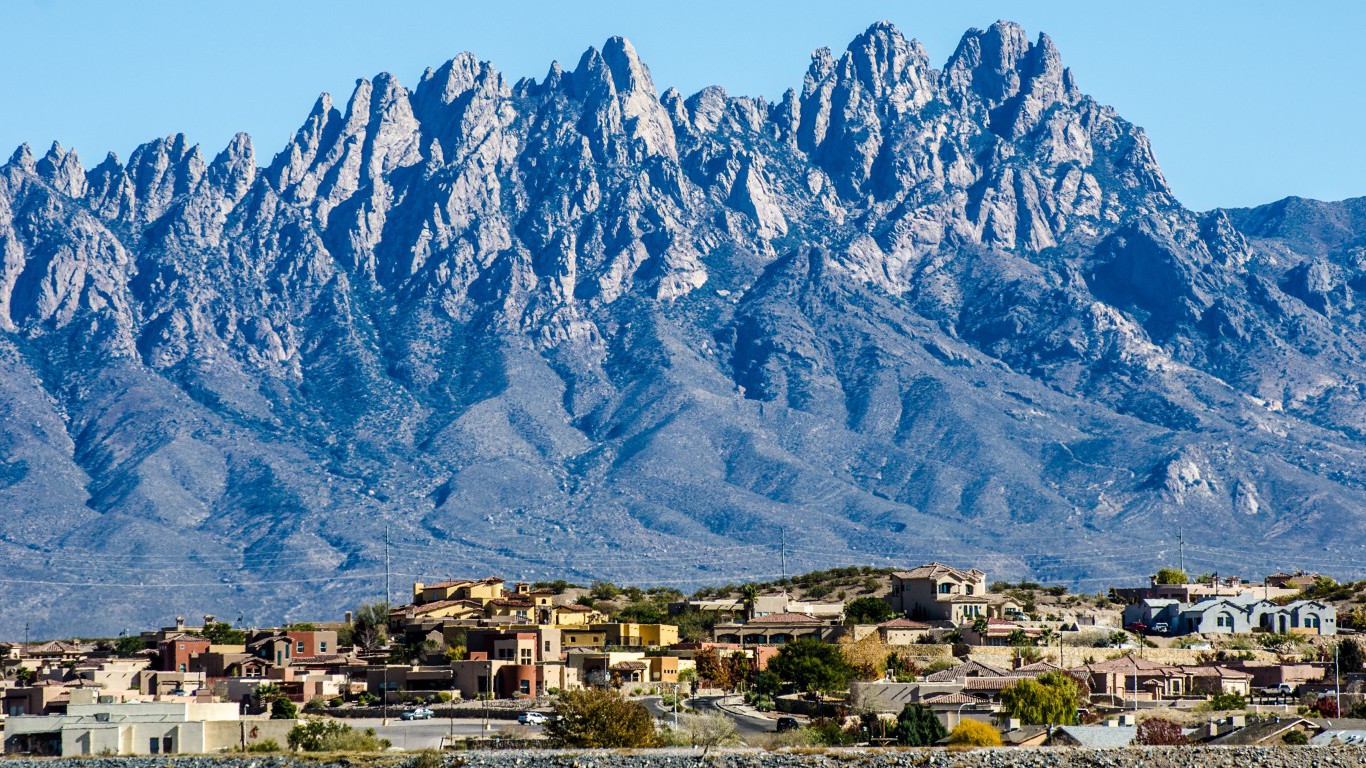
21. Las Cruces, New Mexico
> July 2017 unemployment: 7.7%
> Labor force: 94,258
> Number unemployed: 7,238
> 1-year employment change: 0.0%
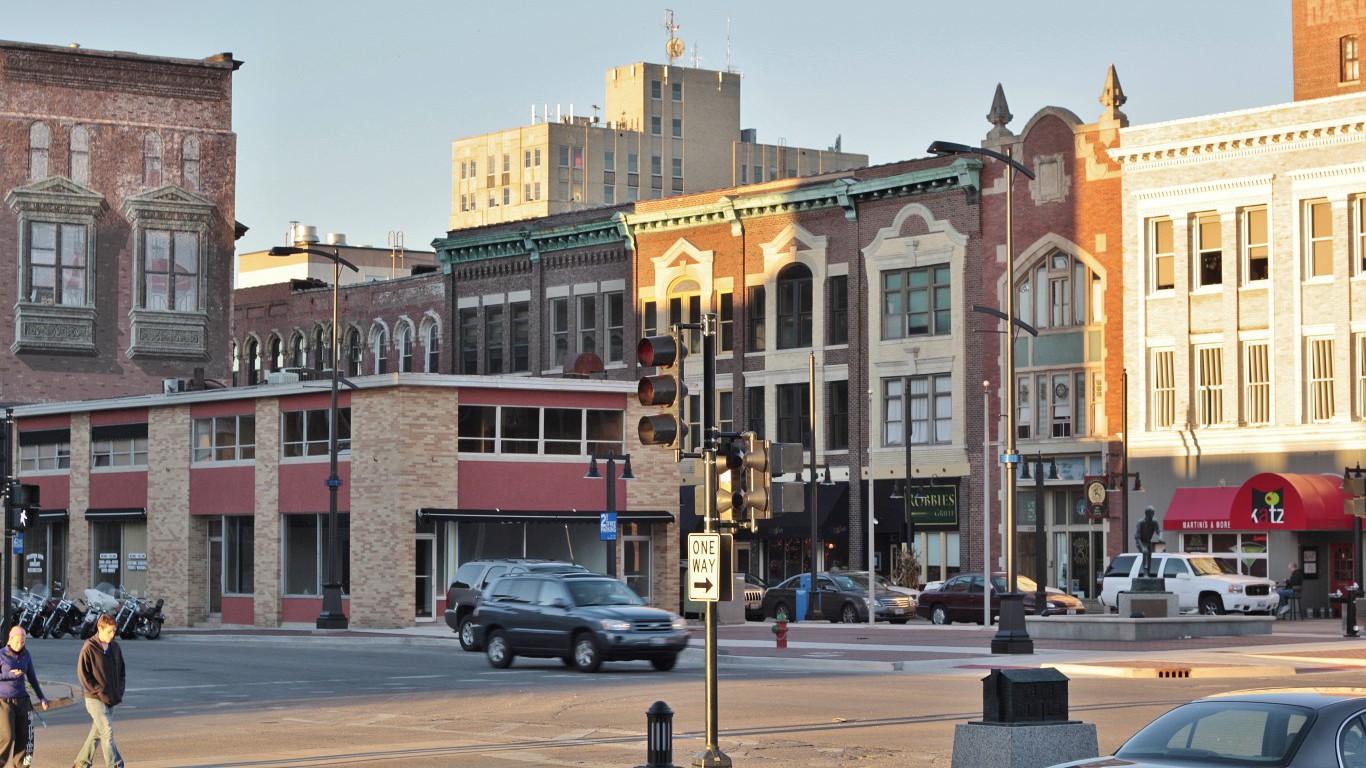
20. Decatur, Illinois
> July 2017 unemployment: 5.9%
> Labor force: 49,811
> Number unemployed: 2,956
> 1-year employment change: -0.8%
[in-text-ad]

19. Lafayette, Louisiana
> July 2017 unemployment: 6.0%
> Labor force: 212,232
> Number unemployed: 12,666
> 1-year employment change: -0.8%
[recirclink id=413864]
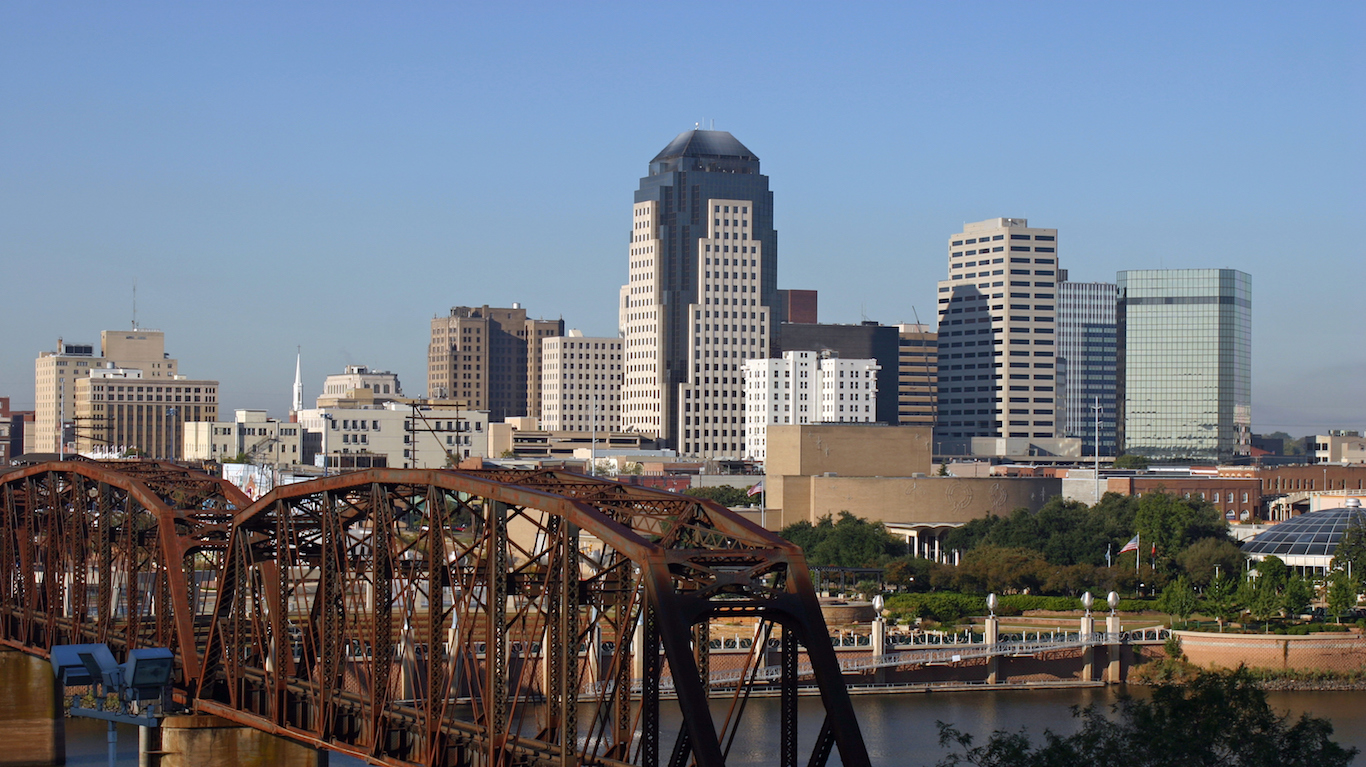
18. Shreveport-Bossier City, Louisiana
> July 2017 unemployment: 6.0%
> Labor force: 188,279
> Number unemployed: 11,310
> 1-year employment change: -1.1%
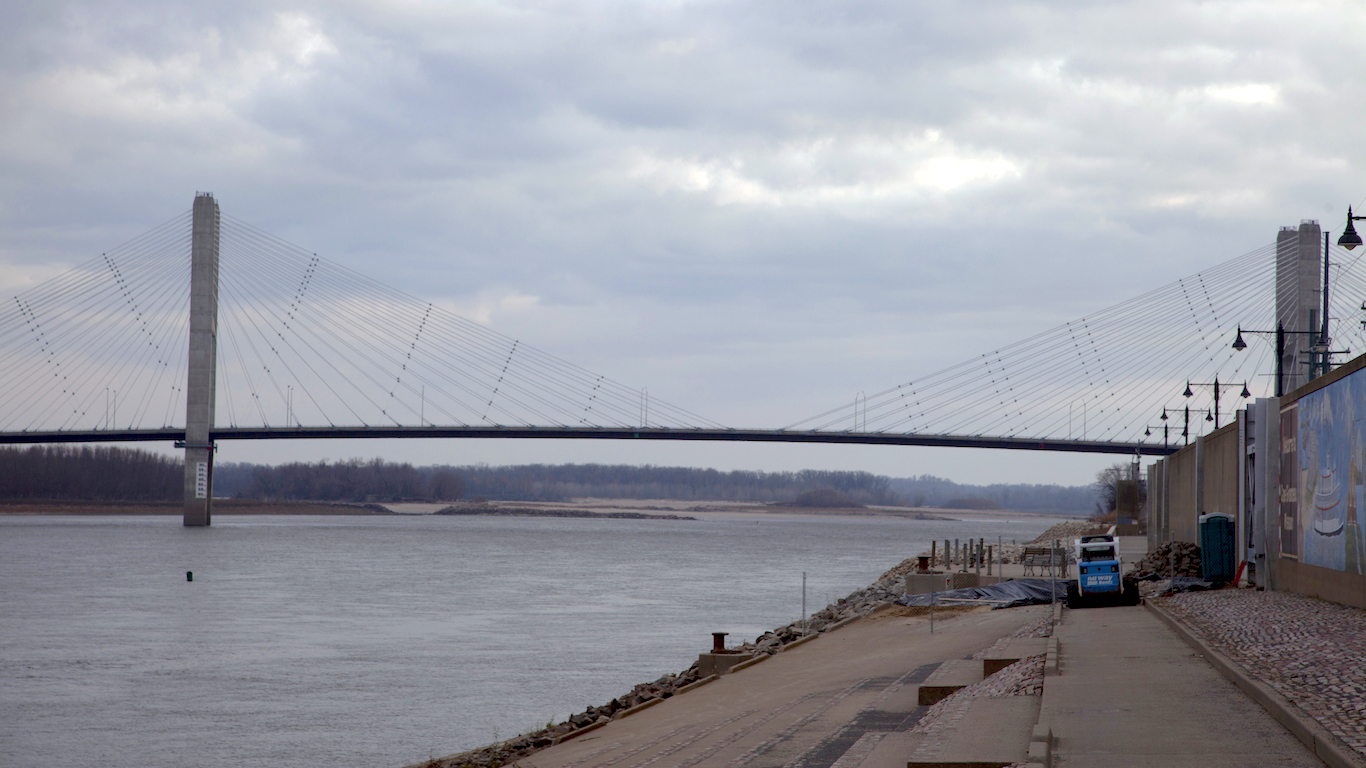
17. Cape Girardeau, Missouri
> July 2017 unemployment: 4.2%
> Labor force: 46,544
> Number unemployed: 1,967
> 1-year employment change: -1.9%
[in-text-ad-2]

16. Elmira, New York
> July 2017 unemployment: 5.4%
> Labor force: 35,814
> Number unemployed: 1,930
> 1-year employment change: -1.4%
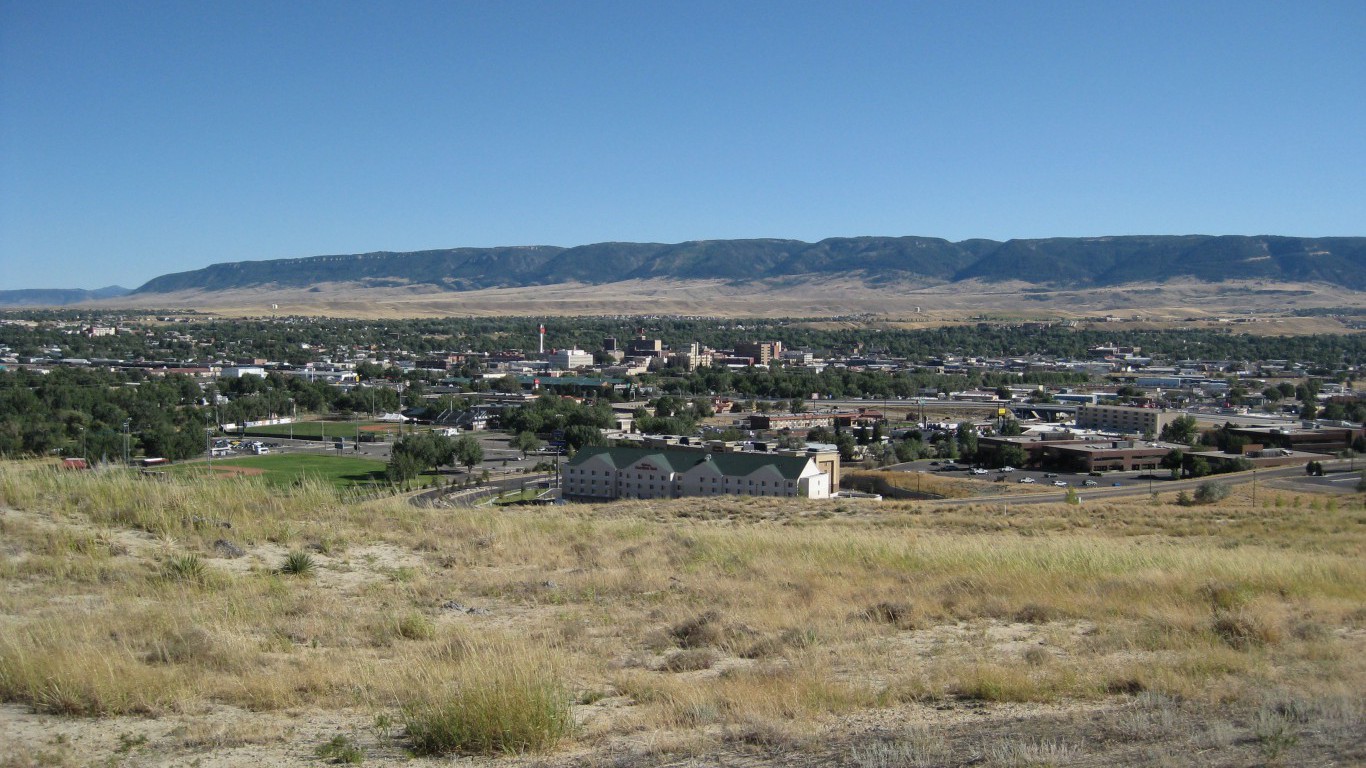
15. Casper, Wyoming
> July 2017 unemployment: 5.0%
> Labor force: 38,919
> Number unemployed: 1,942
> 1-year employment change: -1.6%
[in-text-ad]

14. Alexandria, Louisiana
> July 2017 unemployment: 6.2%
> Labor force: 65,646
> Number unemployed: 4,067
> 1-year employment change: -1.1%
[recirclink id=405297]

13. Farmington, New Mexico
> July 2017 unemployment: 8.2%
> Labor force: 51,114
> Number unemployed: 4,195
> 1-year employment change: -0.4%

12. Fairbanks, Alaska
> July 2017 unemployment: 5.8%
> Labor force: 47,191
> Number unemployed: 2,736
> 1-year employment change: -1.5%
[in-text-ad-2]

11. Weirton-Steubenville, Ohio
> July 2017 unemployment: 6.8%
> Labor force: 51,347
> Number unemployed: 3,489
> 1-year employment change: -1.2%

10. Bay City, Michigan
> July 2017 unemployment: 6.0%
> Labor force: 51,594
> Number unemployed: 3,091
> 1-year employment change: -1.7%
[in-text-ad]

9. Rocky Mount, North Carolina
> July 2017 unemployment: 6.6%
> Labor force: 65,282
> Number unemployed: 4,305
> 1-year employment change: -1.6%
[recirclink id=413864]
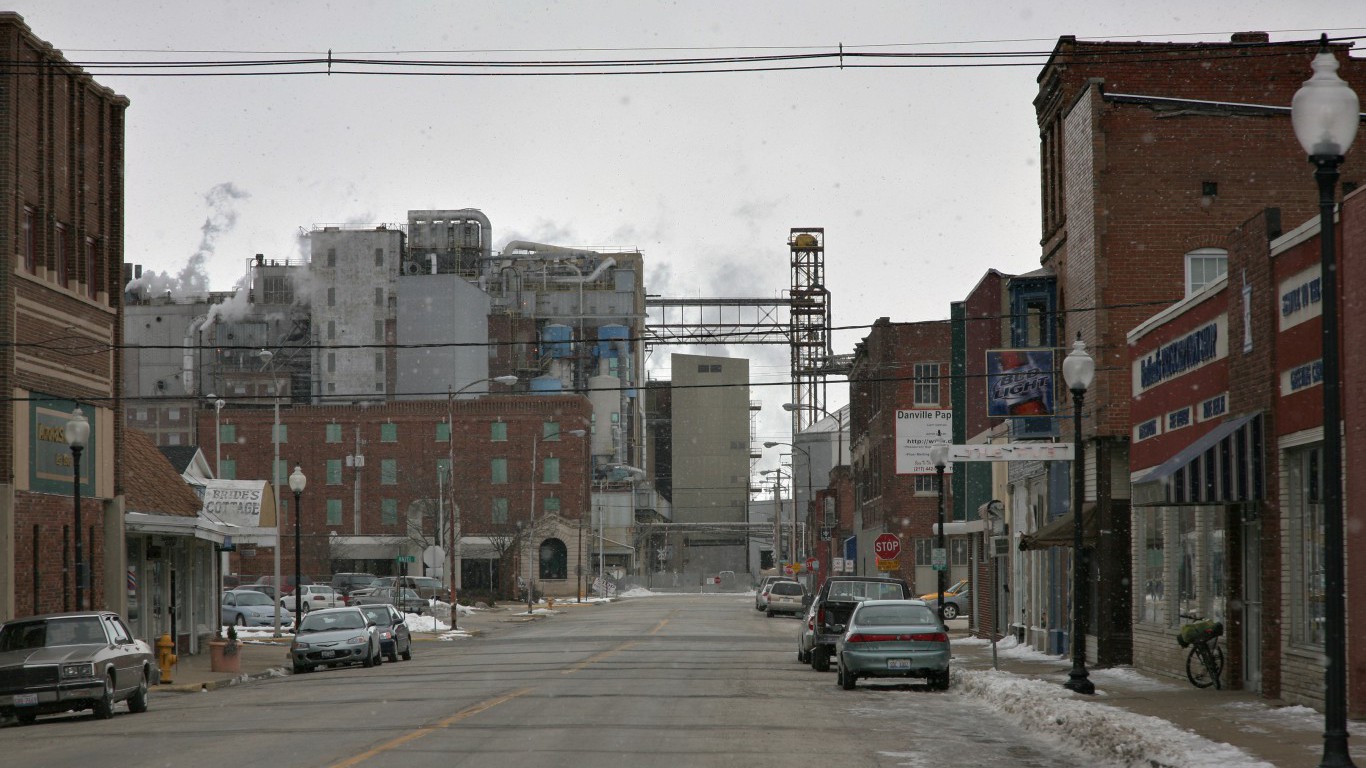
8. Danville, Illinois
> July 2017 unemployment: 7.1%
> Labor force: 34,251
> Number unemployed: 2,420
> 1-year employment change: -1.4%

7. Youngstown-Warren-Boardman, Ohio
> July 2017 unemployment: 7.9%
> Labor force: 251,043
> Number unemployed: 19,761
> 1-year employment change: -1.3%
[in-text-ad-2]
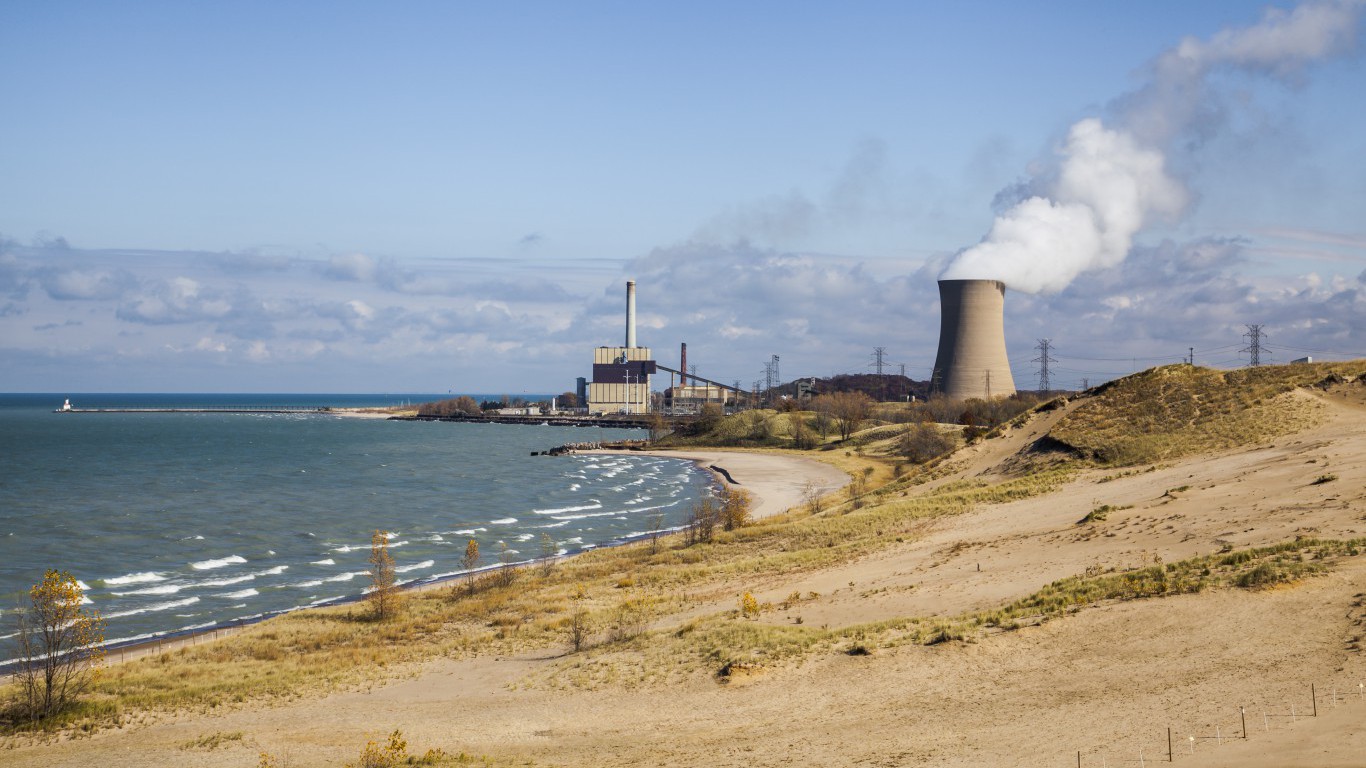
6. Michigan City-La Porte, Indiana
> July 2017 unemployment: 4.2%
> Labor force: 47,632
> Number unemployed: 1,980
> 1-year employment change: -2.9%

5. Beckley, West Virginia
> July 2017 unemployment: 5.4%
> Labor force: 45,056
> Number unemployed: 2,449
> 1-year employment change: -2.4%
[in-text-ad]

4. Sierra Vista-Douglas, Arizona
> July 2017 unemployment: 5.9%
> Labor force: 49,804
> Number unemployed: 2,938
> 1-year employment change: -2.4%
[recirclink id=404837]

3. Houma-Thibodaux, Louisiana
> July 2017 unemployment: 5.7%
> Labor force: 89,270
> Number unemployed: 5,103
> 1-year employment change: -3.2%

2. Yuma, Arizona
> July 2017 unemployment: 23.8%
> Labor force: 102,449
> Number unemployed: 24,392
> 1-year employment change: 3.9%
[in-text-ad-2]
1. El Centro, California
> July 2017 unemployment: 24.2%
> Labor force: 73,721
> Number unemployed: 17,862
> 1-year employment change: 1.4%
Detailed Findings and Methodology
The U.S. unemployment rate, while useful, does not paint a complete picture of the employment environment of a metropolitan area. Two metro areas could have an identical unemployment rate, but one could be in the midst of an economic boom, while the other could be on the cusp of a period of stagnation. For this reason, we also included total employment change as part of our ranking.
Had we chosen to identify the cities with the highest unemployment rates alone as our measure of the worst places to find a job, the vast majority would have been metropolitan areas in California. Of the 13 metropolitan areas with the highest unemployment rates, 10 are in California.
When factoring employment declines, we see that metropolitan areas where job prospects are relatively slim are far more widespread. When creating an index of high unemployment and one year employment declines, 16 separate states show up on this list of 25 metropolitan areas.
Some of the metropolitan areas on our list have actually substantially increased total employment in the last year. For example, total employment in Yuma, Arizona has increased by 3.9% in the past year, which is actually higher than the vast majority of U.S. metropolitan areas. The reason Yuma remains on this list of the worst cities to find a job is that nearly one in four jobseekers are still unemployed, even with the increase in employment. While the economy appears to be rebounding somewhat, there are far too many people clamoring for the few thousand positions that have opened up since last summer.
There are also metropolitan areas on this list where the unemployment rate is actually slightly below the U.S. July rate of 4.4%. However, these places have had severe declines in employment, while the U.S. total employment increased by 1.5% over the same period. Michigan City-La Porte, Indiana has an unemployment rate of 4.2%, however, total employment has declined by nearly 3%. Although the share of the labor force looking for work is currently low, the number of available jobs in the area is rapidly shrinking, which bodes poorly for that small group sill looking for jobs.
To determine the worst cities to find a job, 24/7 Wall St. created an index of U.S. metropolitan areas using min-max normalization of both unemployment rates for July 2017 and changes in total nonfarm employment from July 2016 through July 2017. Both data points are from the U.S. Bureau of Labor Statistics and represent non-seasonally adjusted, nonfarm payrolls.