Some countries have comprehensive weapons industries and are capable of maintaining their militaries with enough supply left over to export various arms to allies and clients around the world.
These same countries are also often among the world’s largest importers of weapons. Other countries, however, rely much more heavily on arms deals with other, large, arms-producing nations.
The United States is notably not just by far the world’s largest military force, but also by far the largest supplier of arms. The U.S.’s supplies arms to at least 98 nations, and it is the largest supplier to 20 of the 40 largest arms importers in the world.
To identify the world’s biggest arms importers and their biggest suppliers, 24/7 Wall St. reviewed the 40 countries with the largest total value of major arms imports during the 2014-18 five-year period from the report on major arms export volumes published by the Stockholm International Peace Research Institute (SIPRI) on March 11. Each country’s major suppliers, all major arms import and export data, as well as annual military expenditures in 2017, also came from SIPRI. Each country’s GDP per capita in 2016 came from the World Bank.
Click here to see the world’s biggest arms importers and their biggest suppliers.
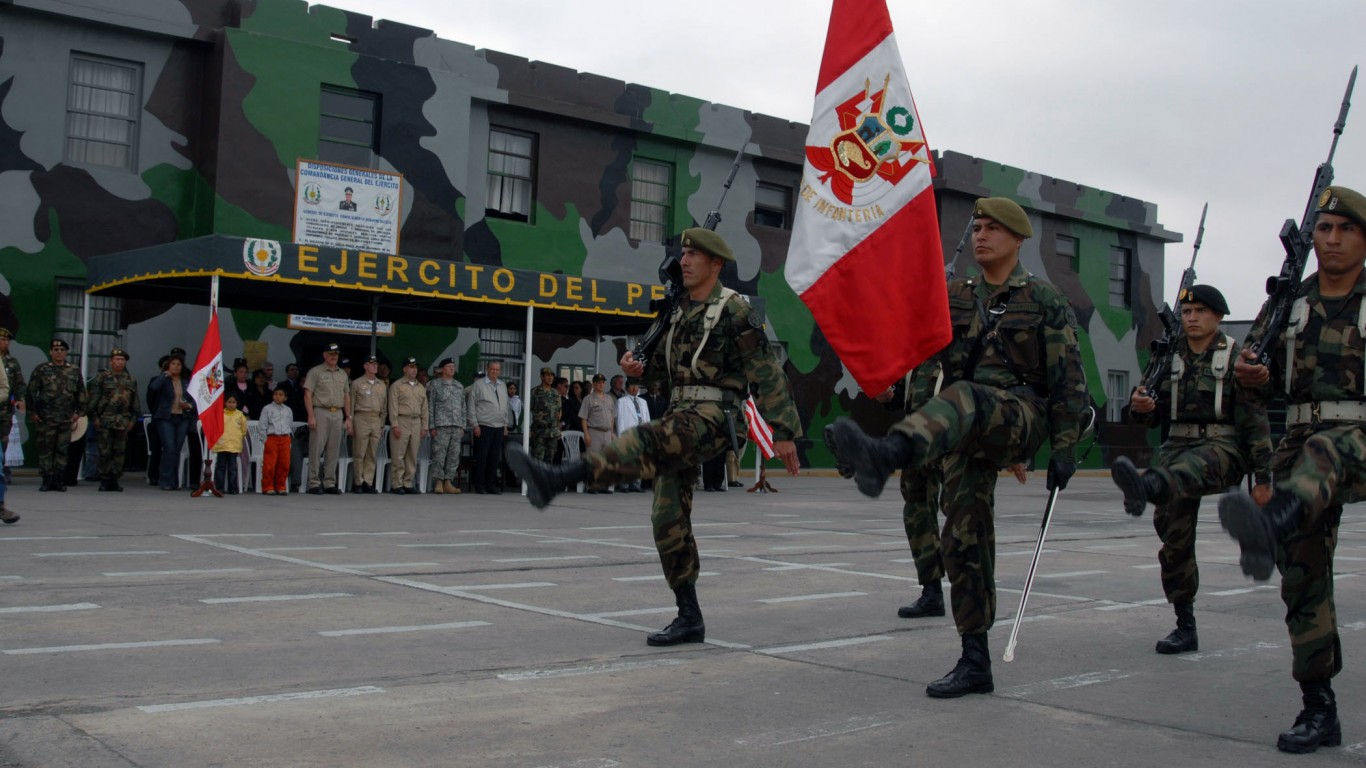
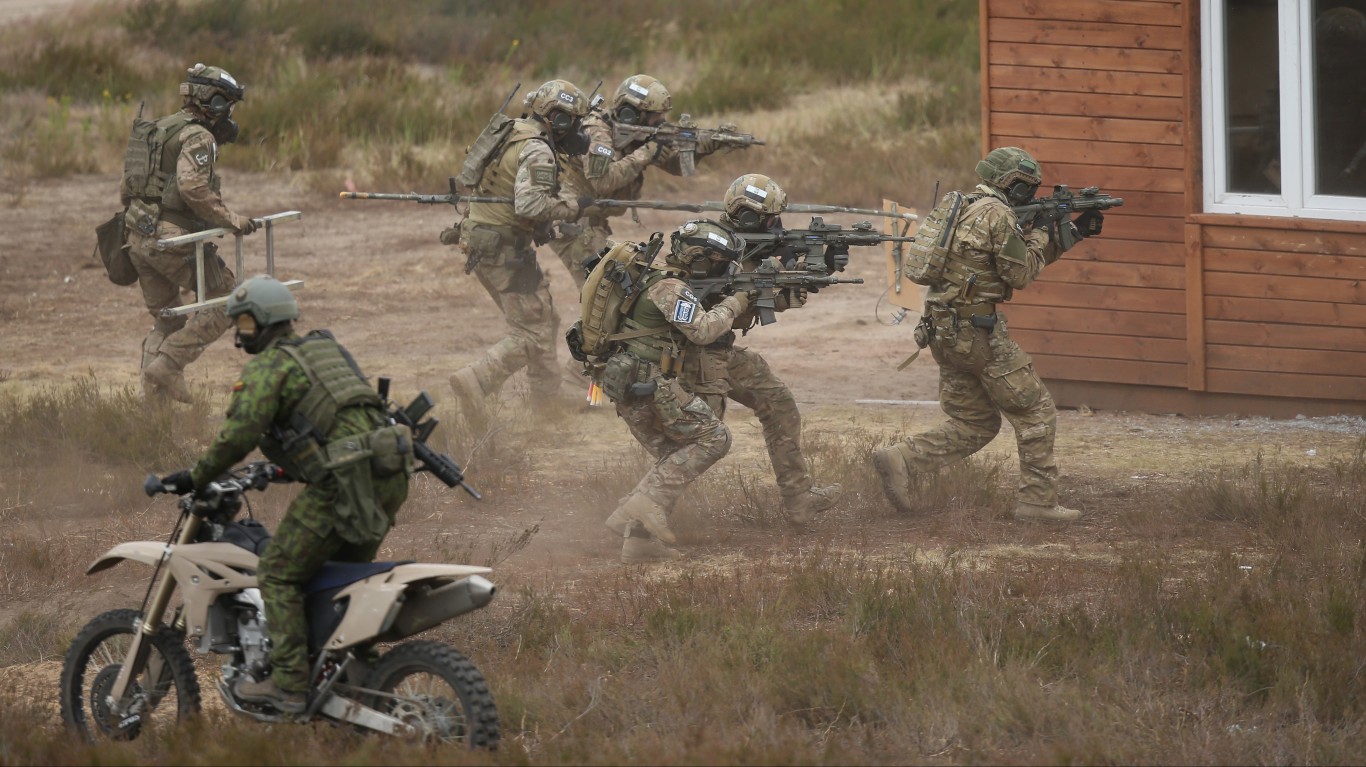
40. Peru
> Share of global arms imports (2014-18): 0.5%
> Main supplier, share of importer’s total imports: South Korea, 34%
> GDP per capita: $12,237
> Armed forces, total personnel (2016): 158,000
[in-text-ad]
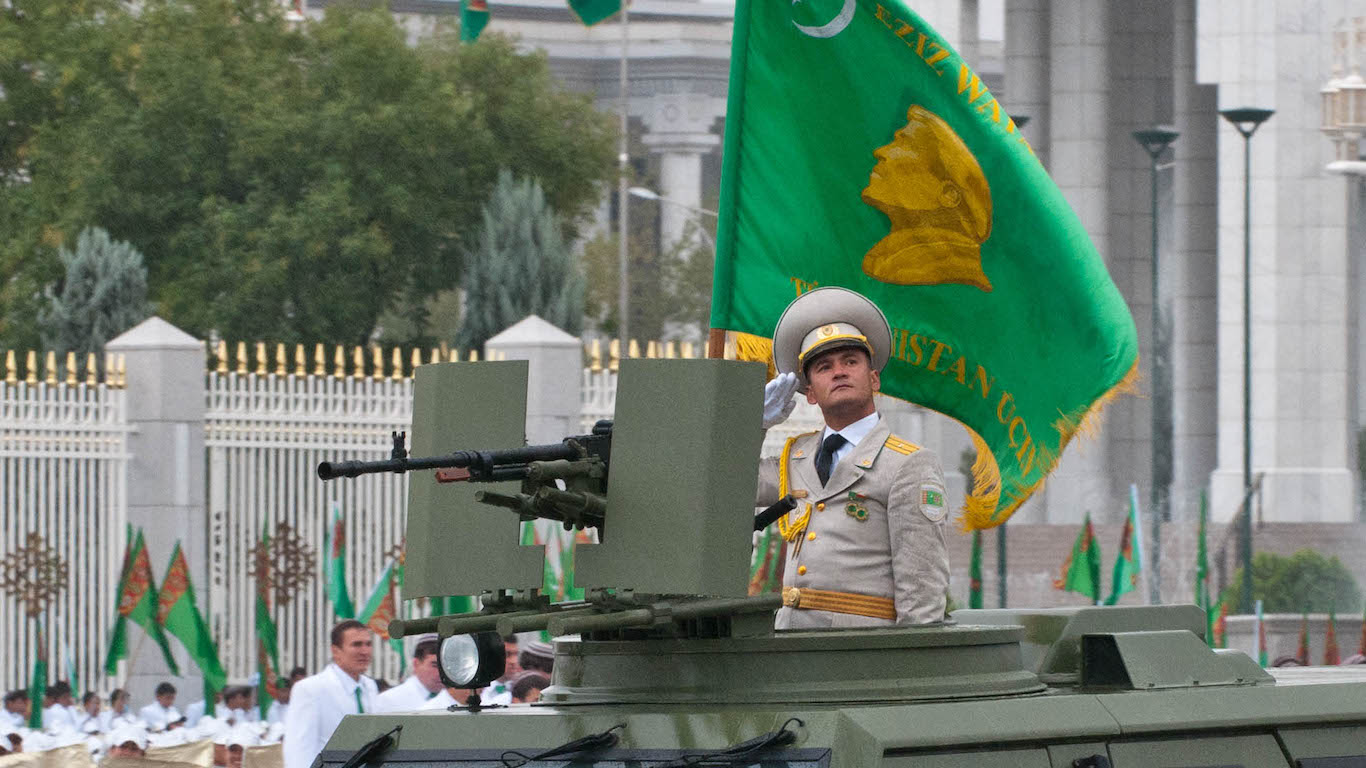
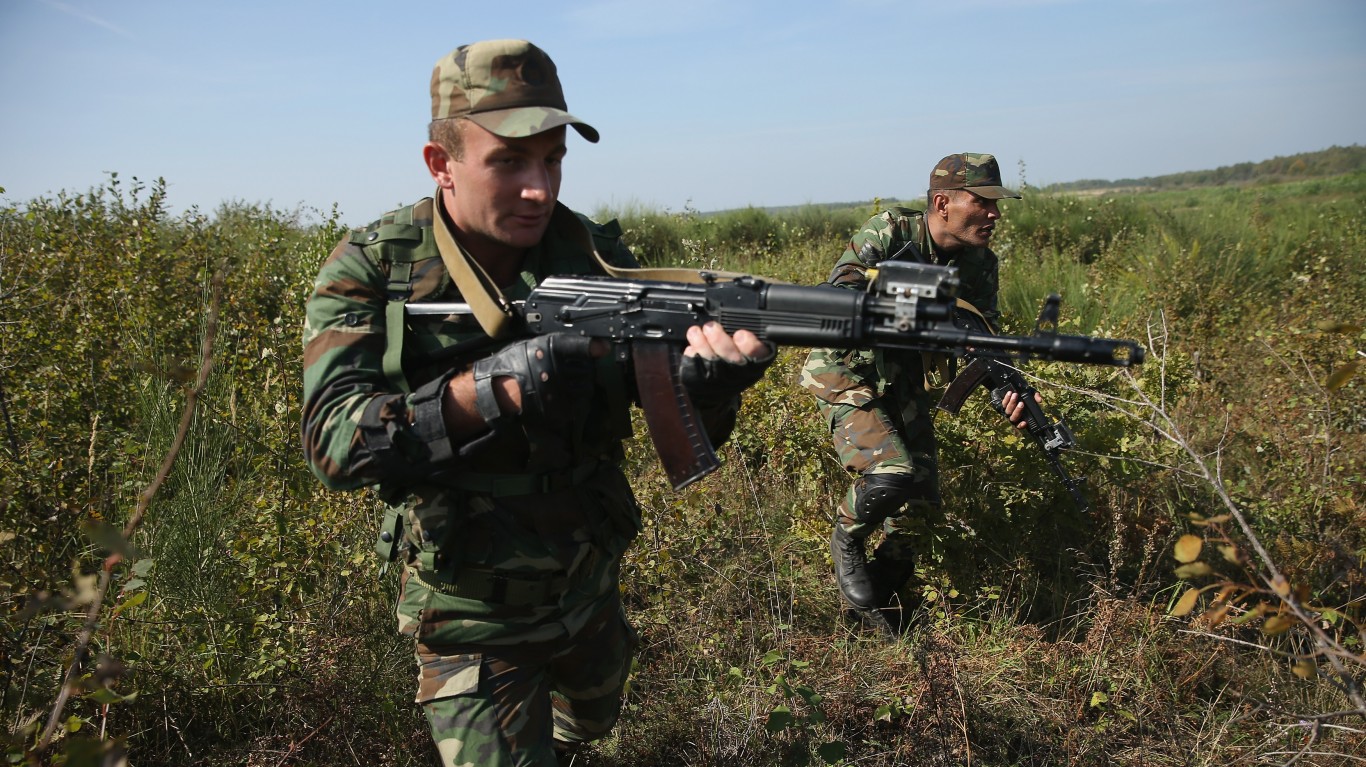
39. Turkmenistan
> Share of global arms imports (2014-18): 0.5%
> Main supplier, share of importer’s total imports: Turkey, 43%
> GDP per capita: $16,389
> Armed forces, total personnel (2016): 41,500
[recirclink id=488456]
38. Poland
> Share of global arms imports (2014-18): 0.6%
> Main supplier, share of importer’s total imports: Germany, 28%
> GDP per capita: $27,343
> Armed forces, total personnel (2016): 178,400
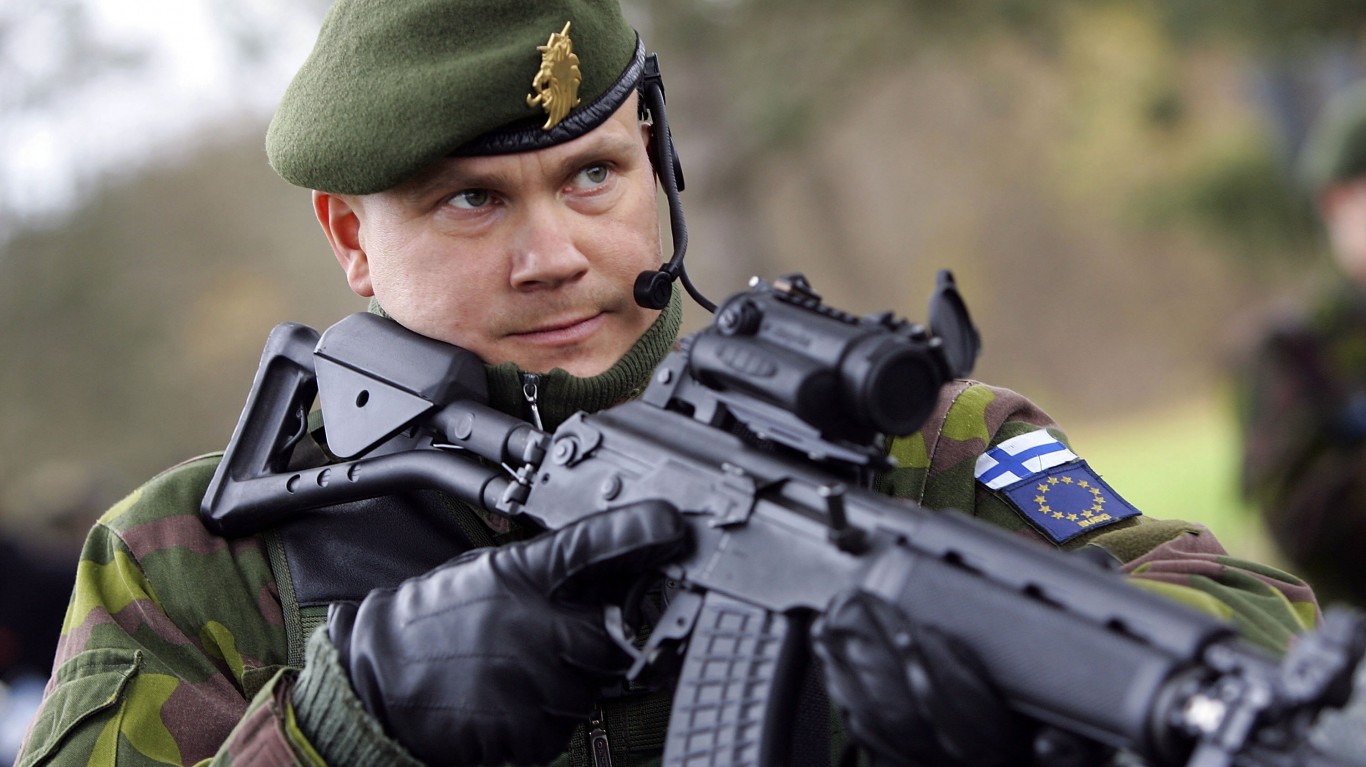
37. Finland
> Share of global arms imports (2014-18): 0.6%
> Main supplier, share of importer’s total imports: USA, 37%
> GDP per capita: $40,586
> Armed forces, total personnel (2016): 24,200
[in-text-ad-2]
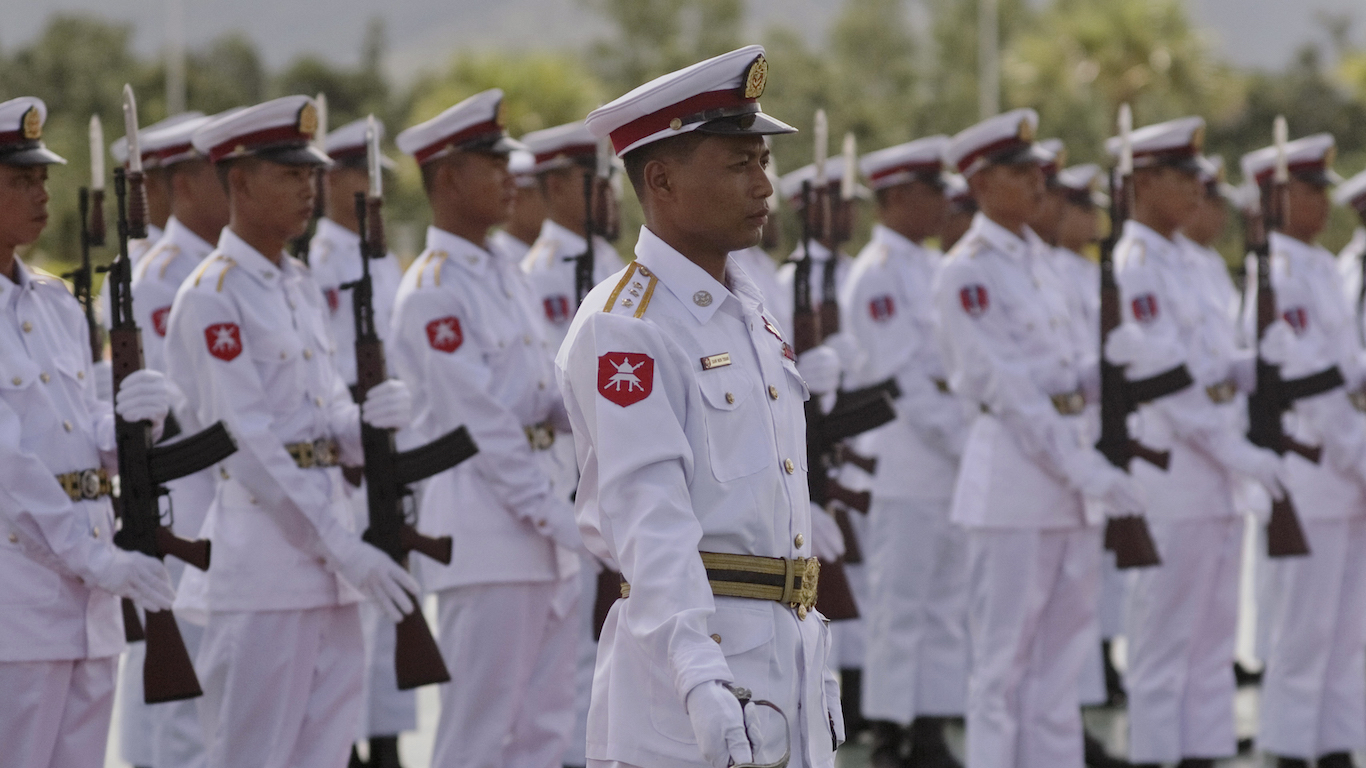
36. Myanmar
> Share of global arms imports (2014-18): 0.6%
> Main supplier, share of importer’s total imports: China, 61%
> GDP per capita: $5,612
> Armed forces, total personnel (2016): 513,250

35. Brazil
> Share of global arms imports (2014-18): 0.6%
> Main supplier, share of importer’s total imports: France, 26%
> GDP per capita: $14,103
> Armed forces, total personnel (2016): 729,500
[in-text-ad]

34. Mexico
> Share of global arms imports (2014-18): 0.7%
> Main supplier, share of importer’s total imports: USA, 63%
> GDP per capita: $17,331
> Armed forces, total personnel (2016): 336,050
[recirclink id=488594]
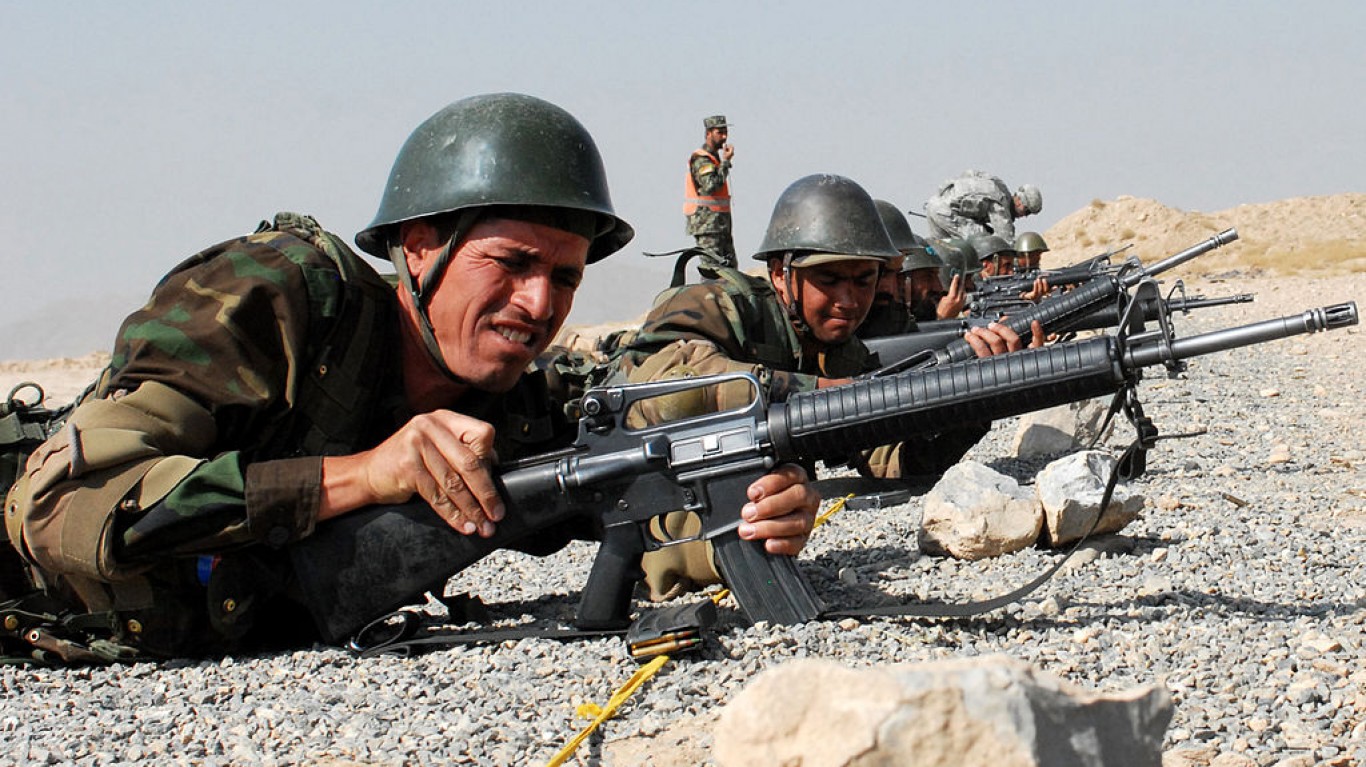
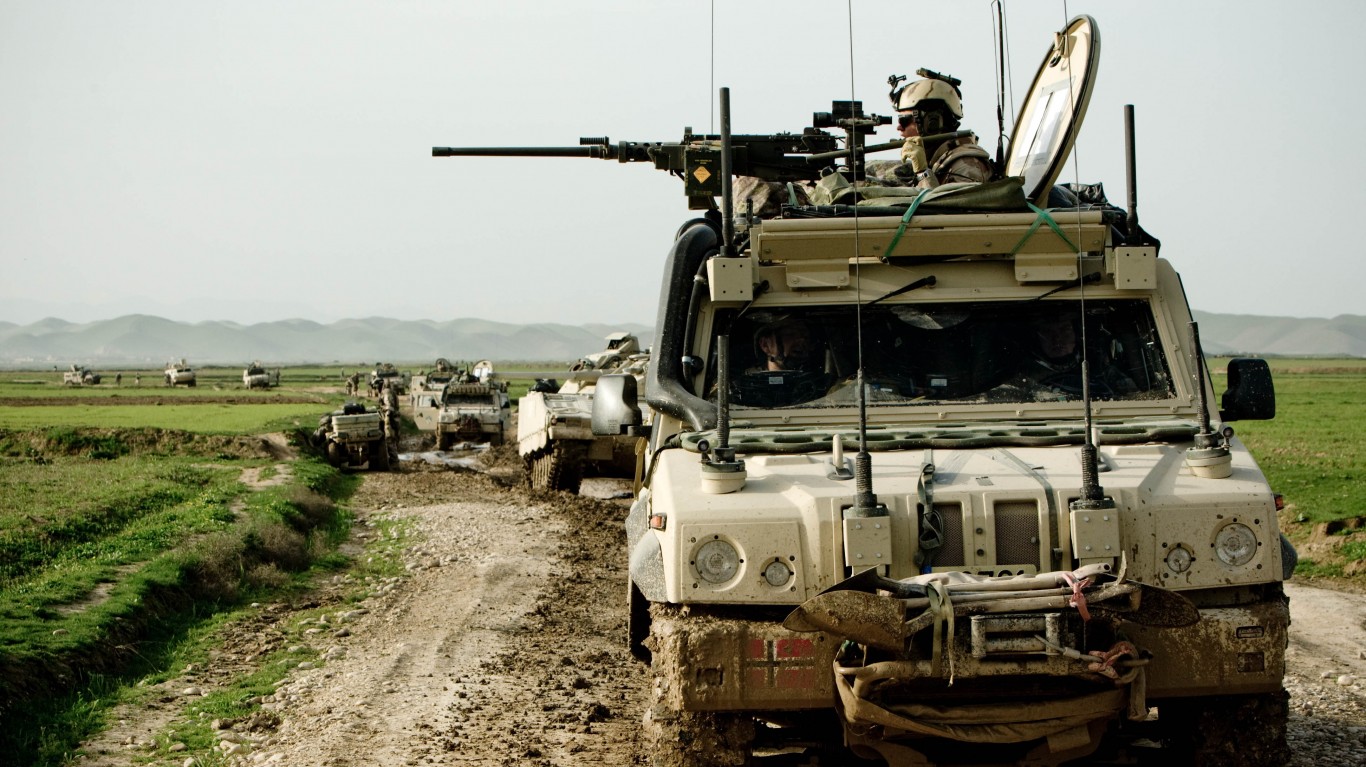
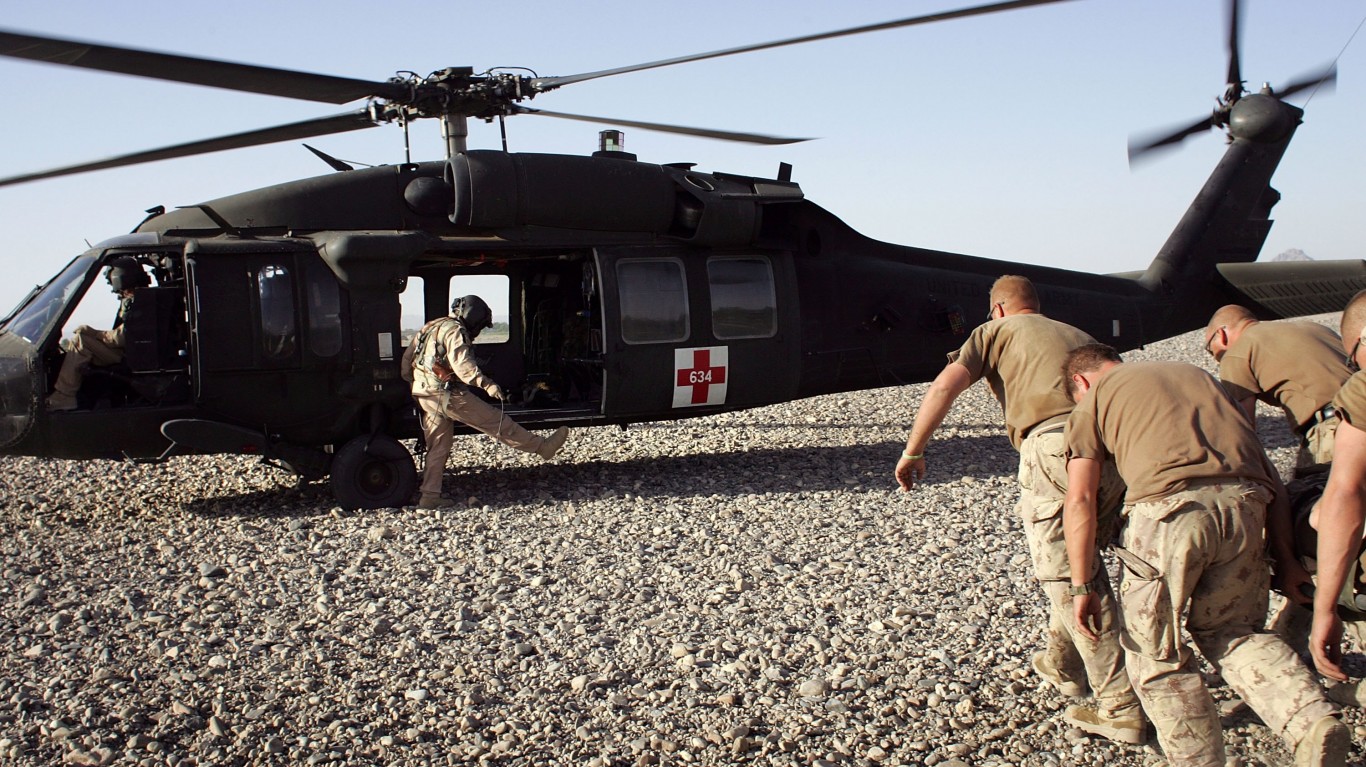
33. Afghanistan
> Share of global arms imports (2014-18): 0.8%
> Main supplier, share of importer’s total imports: USA, 66%
> GDP per capita: $1,796
> Armed forces, total personnel (2016): 323,000
32. Norway
> Share of global arms imports (2014-18): 0.8%
> Main supplier, share of importer’s total imports: USA, 76%
> GDP per capita: $64,800
> Armed forces, total personnel (2016): 23,950
[in-text-ad-2]

31. Jordan
> Share of global arms imports (2014-18): 0.9%
> Main supplier, share of importer’s total imports: Netherlands, 37%
> GDP per capita: $8,337
> Armed forces, total personnel (2016): 115,500

30. Kazakhstan
> Share of global arms imports (2014-18): 0.9%
> Main supplier, share of importer’s total imports: Russia, 84%
> GDP per capita: $24,079
> Armed forces, total personnel (2016): 70,500
[in-text-ad]
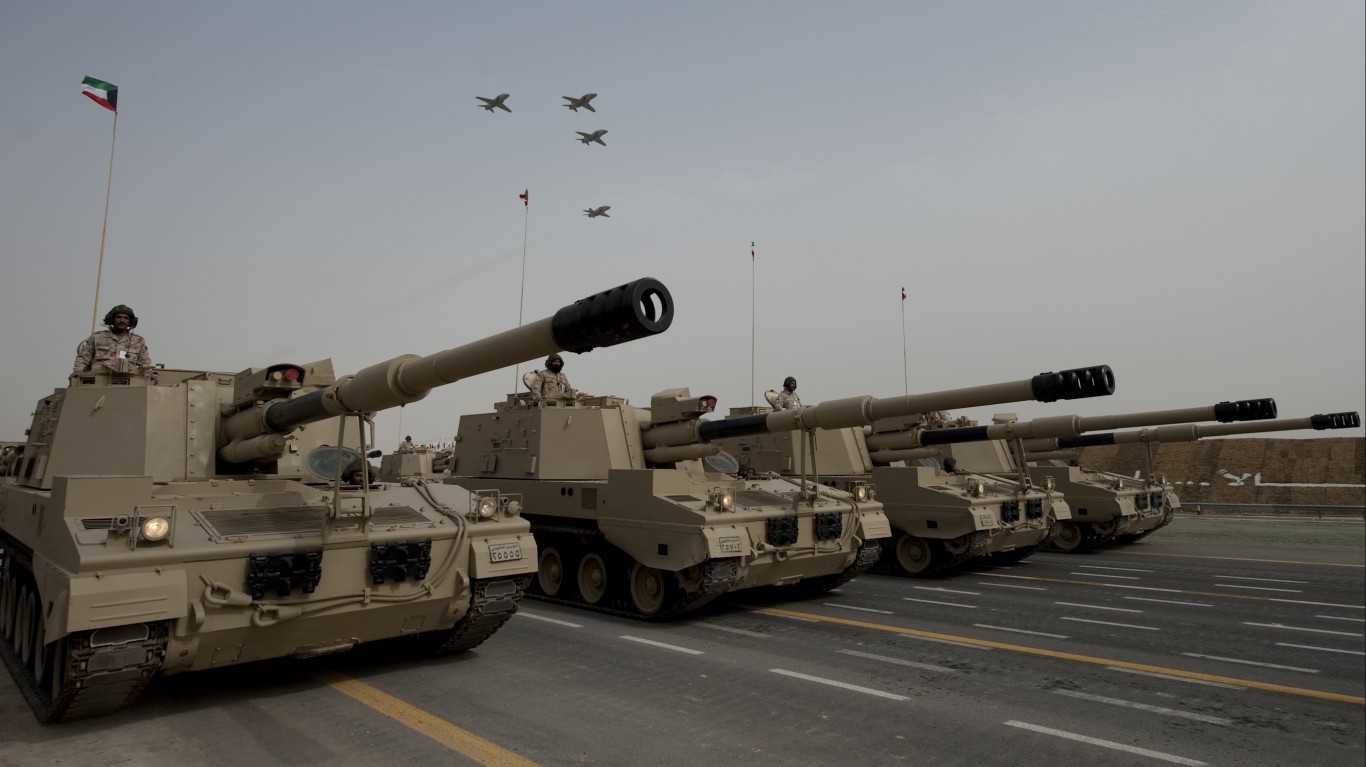
29. Kuwait
> Share of global arms imports (2014-18): 1.0%
> Main supplier, share of importer’s total imports: USA, 87%
> GDP per capita: $65,531
> Armed forces, total personnel (2016): 22,600
[recirclink id=488561]
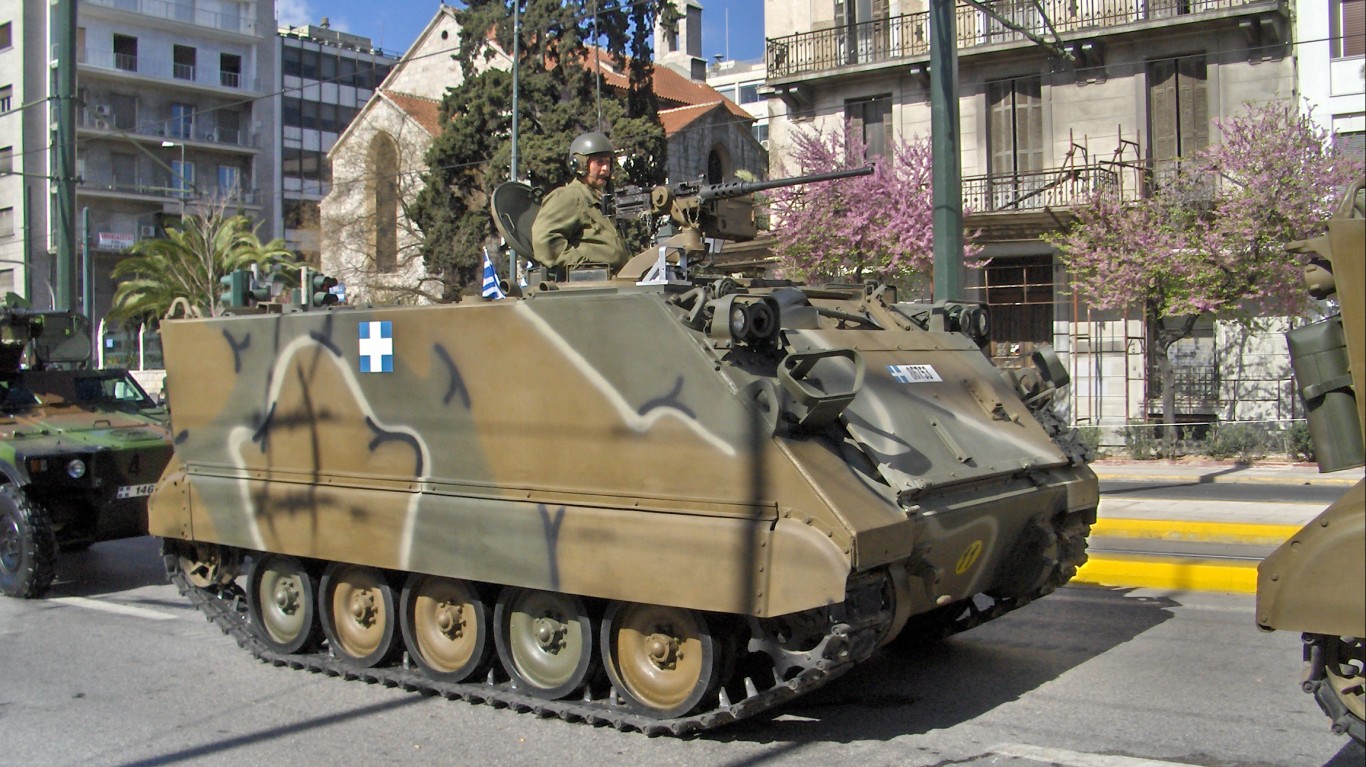
28. Greece
> Share of global arms imports (2014-18): 1.0%
> Main supplier, share of importer’s total imports: Germany, 67%
> GDP per capita: $24,574
> Armed forces, total personnel (2016): 145,350
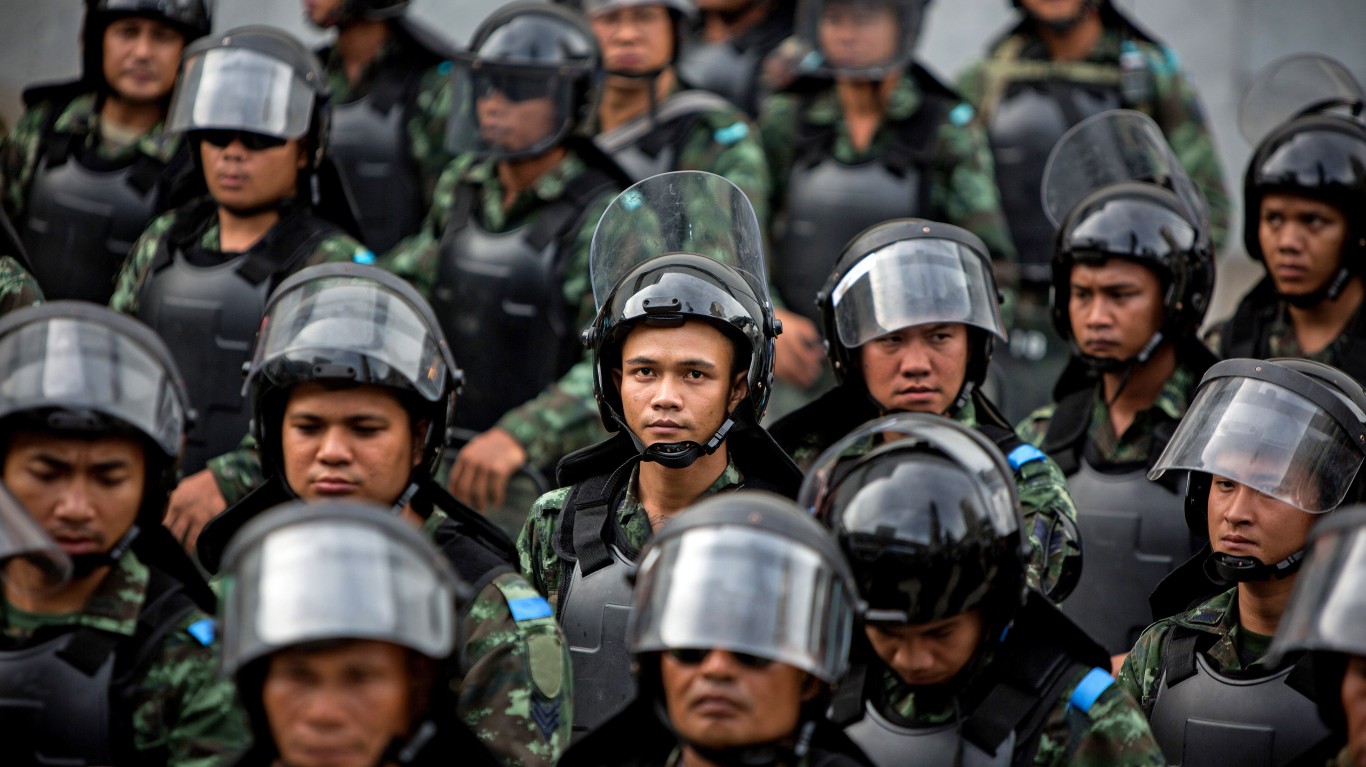
27. Thailand
> Share of global arms imports (2014-18): 1.0%
> Main supplier, share of importer’s total imports: South Korea, 20%
> GDP per capita: $16,279
> Armed forces, total personnel (2016): 454,550
[in-text-ad-2]
26. Canada
> Share of global arms imports (2014-18): 1.0%
> Main supplier, share of importer’s total imports: USA, 63%
> GDP per capita: $44,018
> Armed forces, total personnel (2016): 67,500
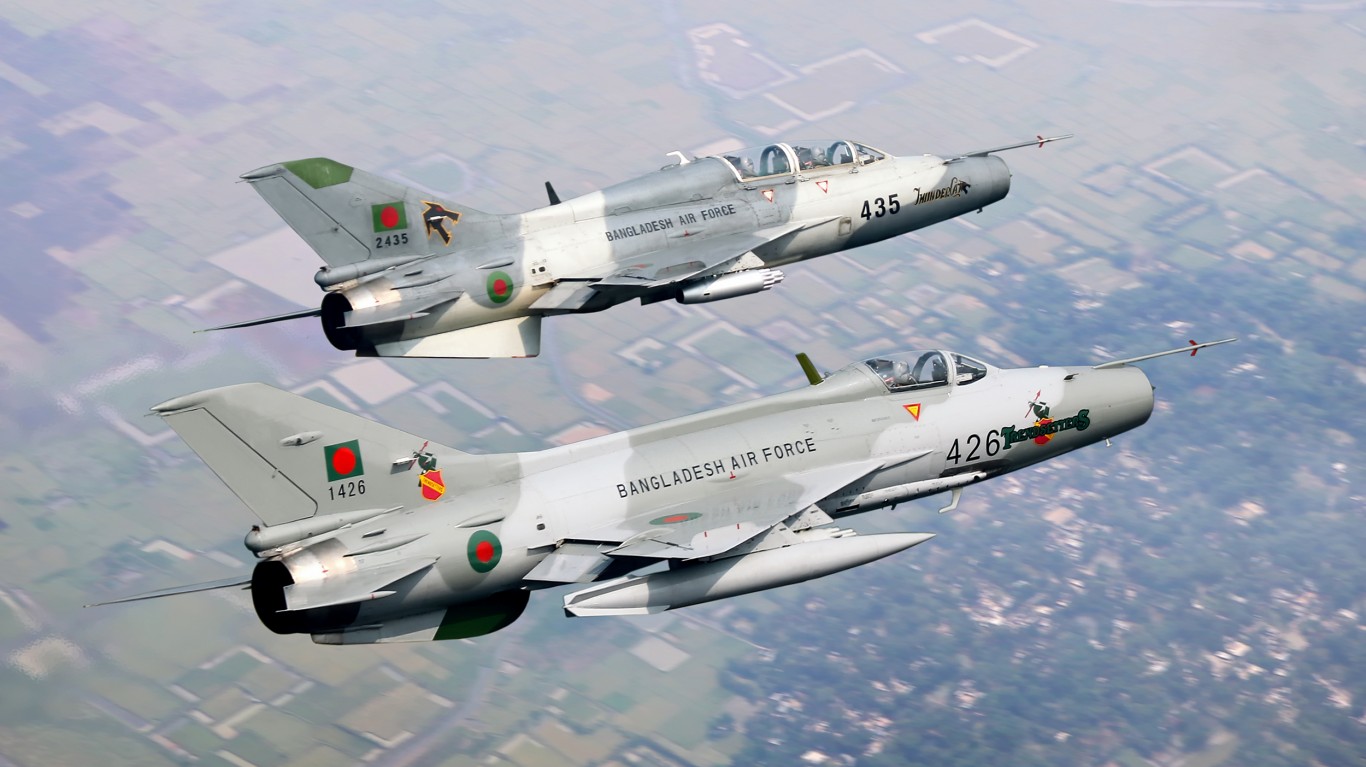
25. Bangladesh
> Share of global arms imports (2014-18): 1.2%
> Main supplier, share of importer’s total imports: China, 70%
> GDP per capita: $3,524
> Armed forces, total personnel (2016): 220,950
[in-text-ad]
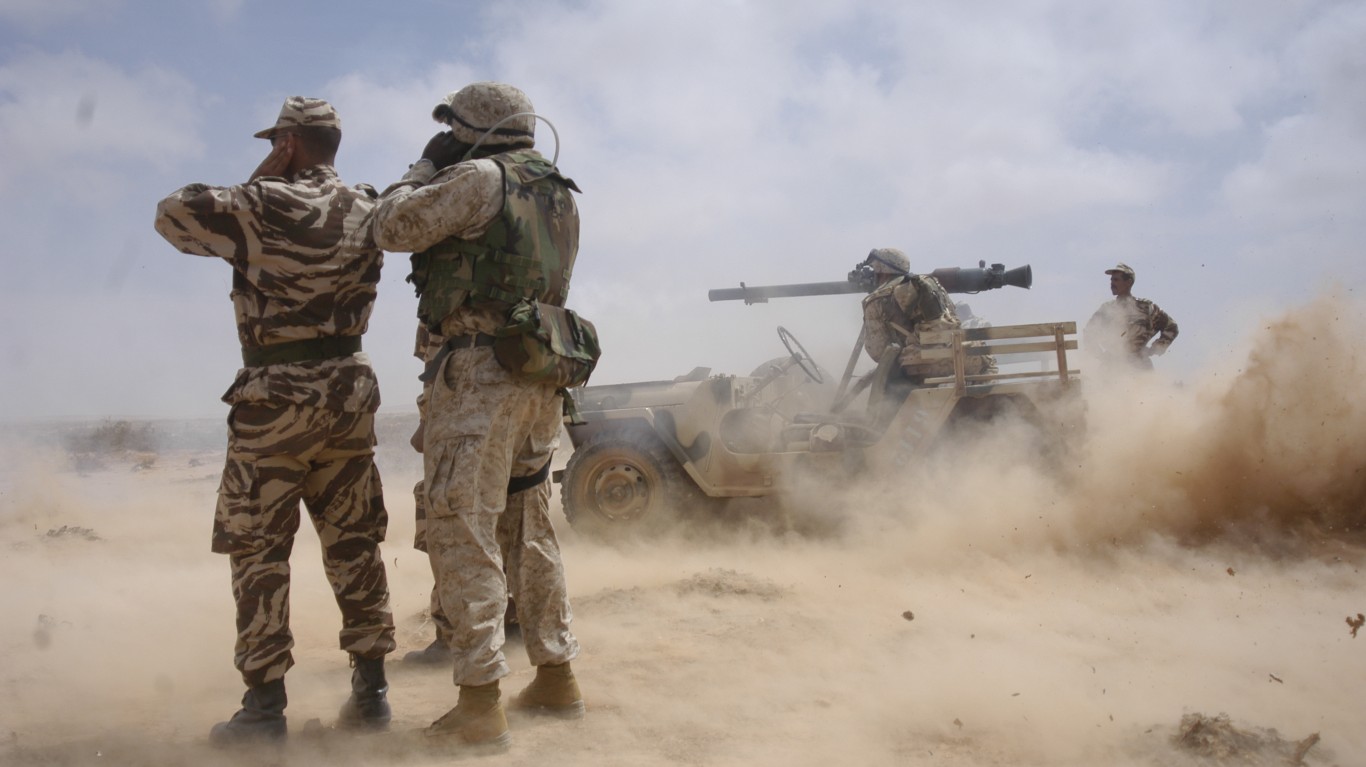
24. Morocco
> Share of global arms imports (2014-18): 1.2%
> Main supplier, share of importer’s total imports: USA, 62%
> GDP per capita: $7,485
> Armed forces, total personnel (2016): 245,800
[recirclink id=488514]
23. Azerbaijan
> Share of global arms imports (2014-18): 1.3%
> Main supplier, share of importer’s total imports: Russia, 51%
> GDP per capita: $15,847
> Armed forces, total personnel (2016): 81,950
22. Singapore
> Share of global arms imports (2014-18): 1.3%
> Main supplier, share of importer’s total imports: USA, 46%
> GDP per capita: $85,535
> Armed forces, total personnel (2016): 147,600
[in-text-ad-2]
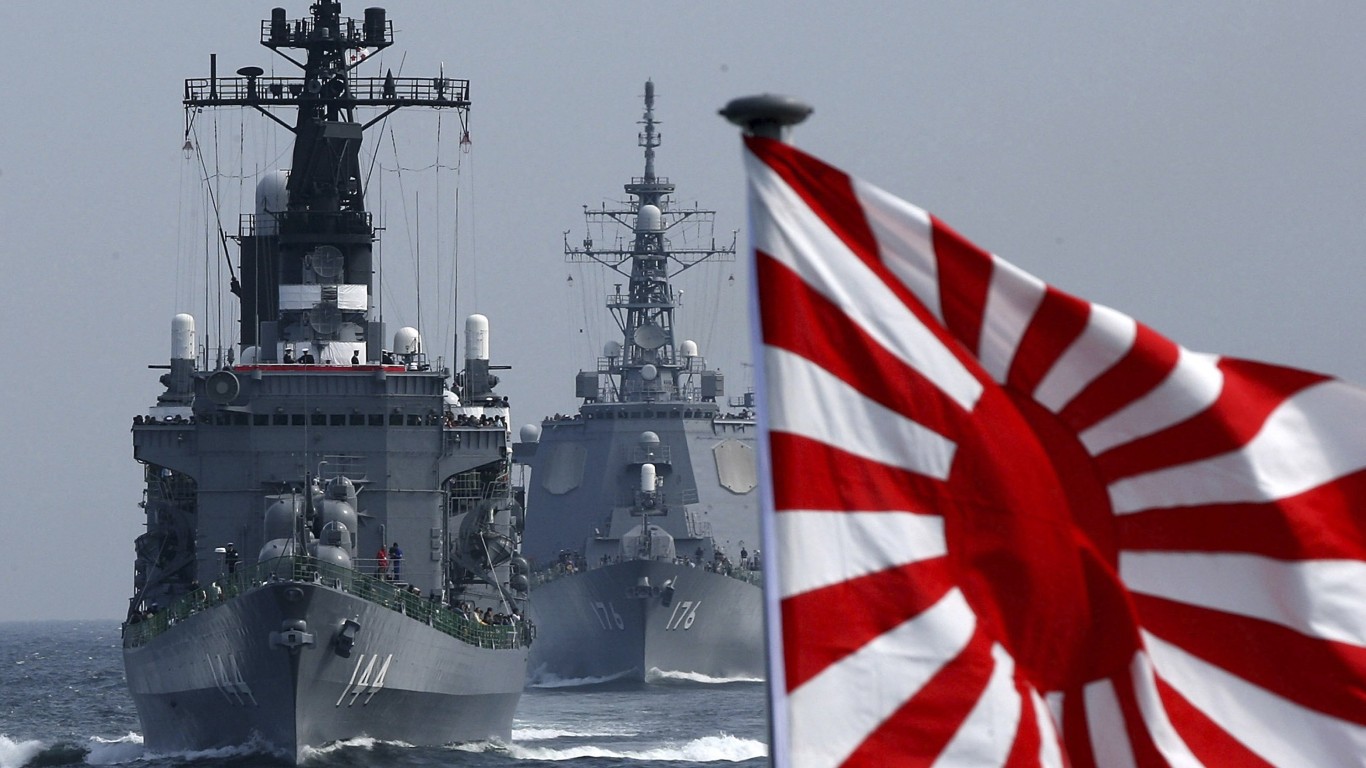
21. Japan
> Share of global arms imports (2014-18): 1.4%
> Main supplier, share of importer’s total imports: USA, 95%
> GDP per capita: $39,002
> Armed forces, total personnel (2016): 260,890

20. Italy
> Share of global arms imports (2014-18): 1.5%
> Main supplier, share of importer’s total imports: USA, 59%
> GDP per capita: $35,220
> Armed forces, total personnel (2016): 356,850
[in-text-ad]
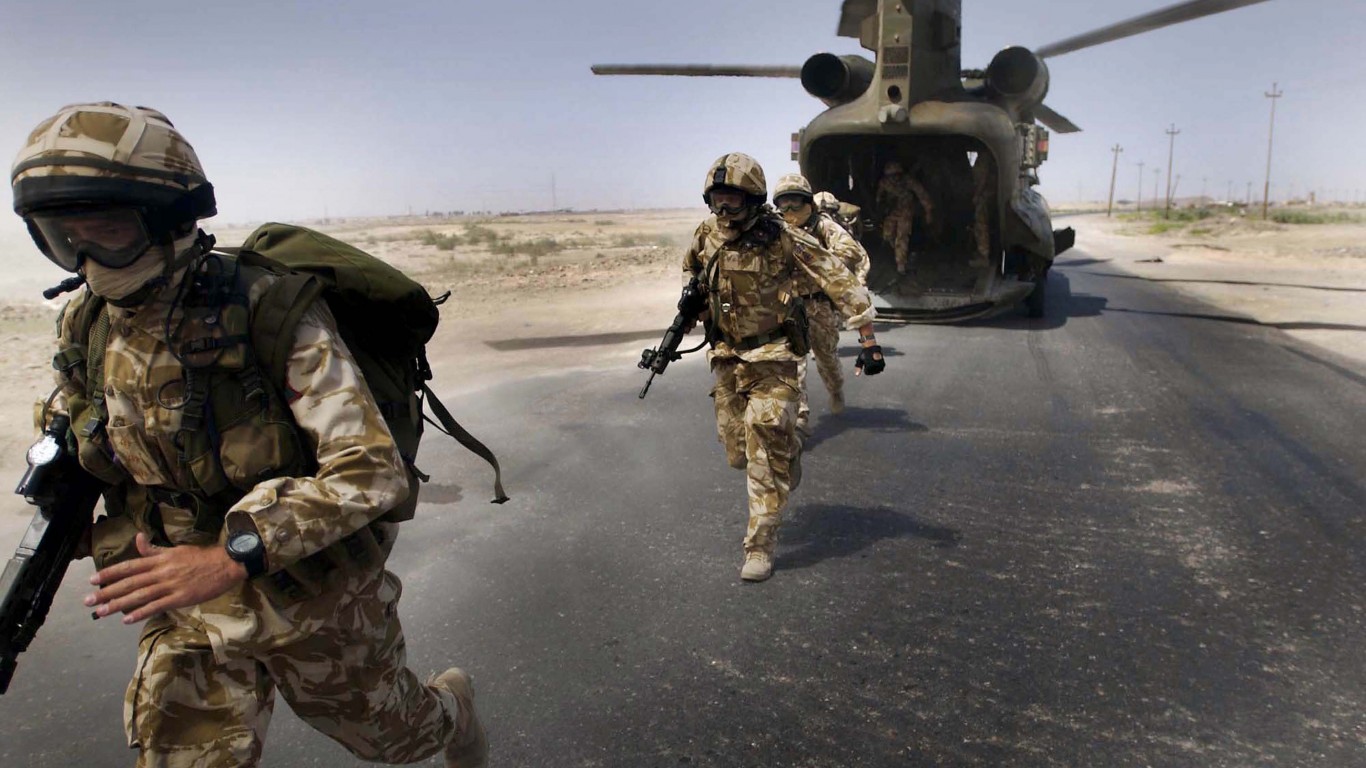
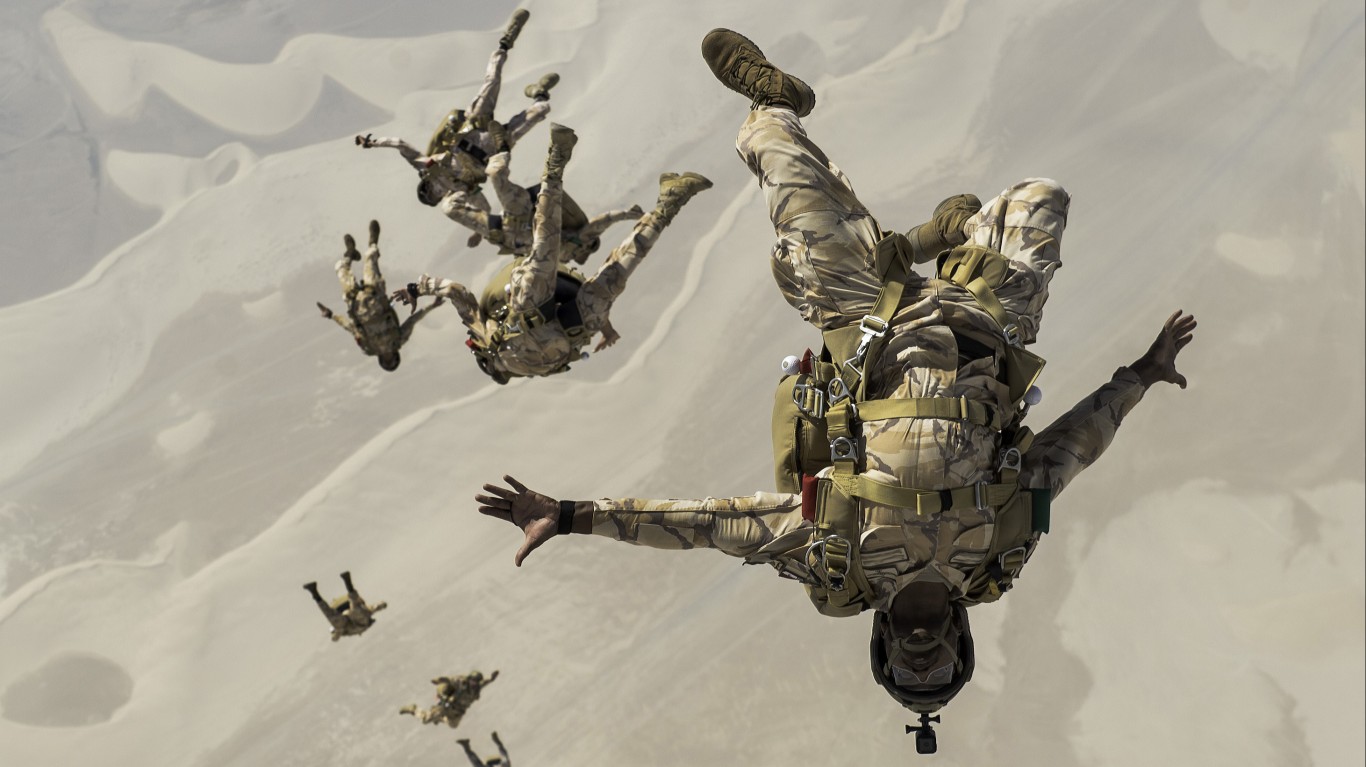
19. United Kingdom
> Share of global arms imports (2014-18): 1.6%
> Main supplier, share of importer’s total imports: USA, 71%
> GDP per capita: $39,753
> Armed forces, total personnel (2016): 150,250
[recirclink id=488498]
18. Oman
> Share of global arms imports (2014-18): 1.6%
> Main supplier, share of importer’s total imports: UK, 39%
> GDP per capita: $37,961
> Armed forces, total personnel (2016): 47,000
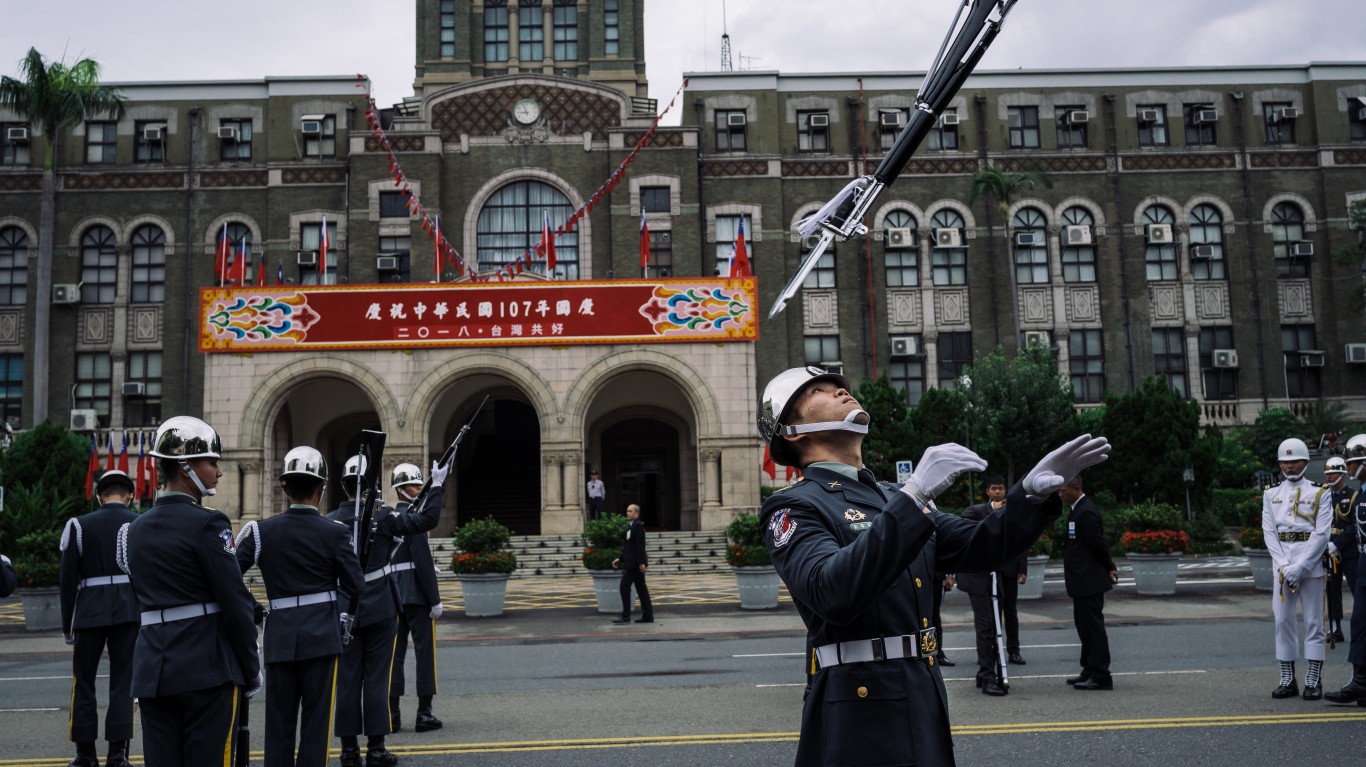
17. Taiwan
> Share of global arms imports (2014-18): 1.7%
> Main supplier, share of importer’s total imports: USA, 100%
> GDP per capita: N/A
> Armed forces, total personnel (2016): N/A
[in-text-ad-2]
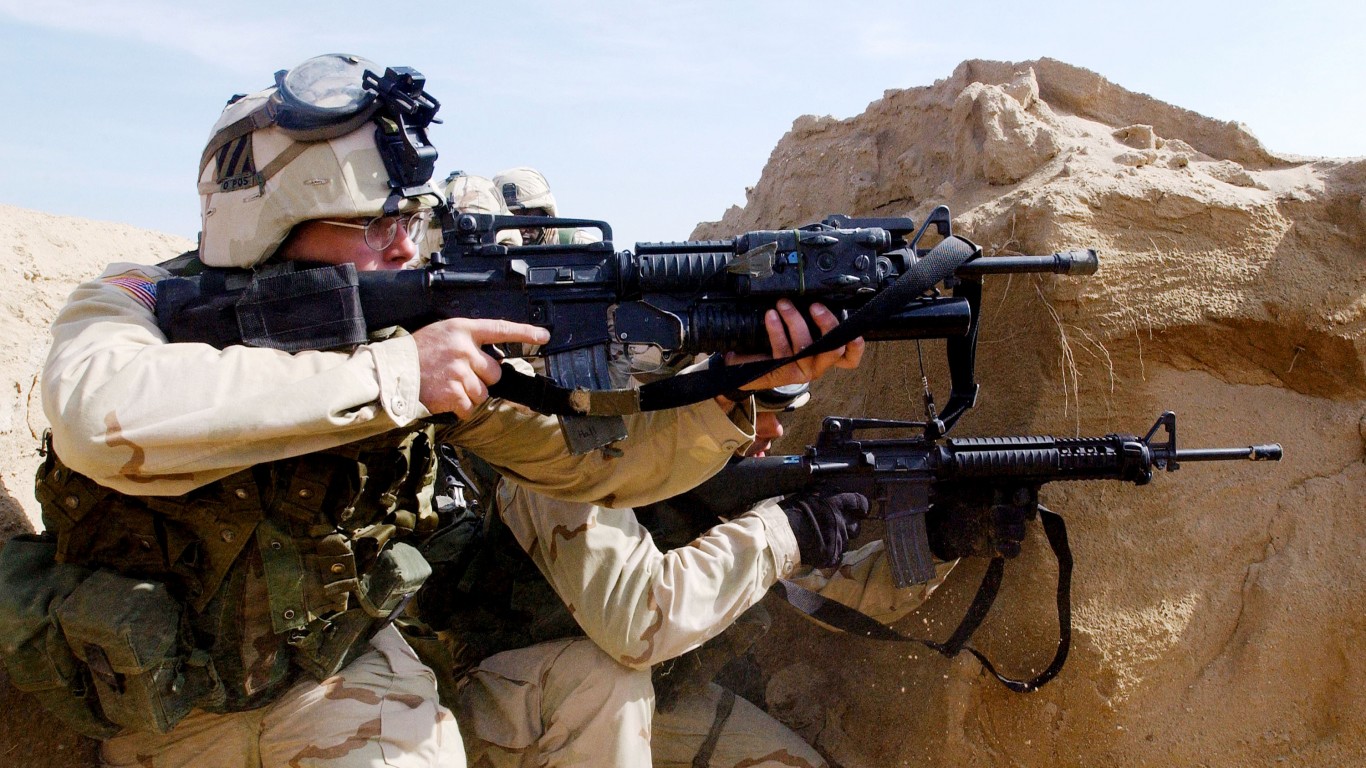
16. United States
> Share of global arms imports (2014-18): 1.8%
> Main supplier, share of importer’s total imports: Germany, 22%
> GDP per capita: $54,225
> Armed forces, total personnel (2016): 1,348,400
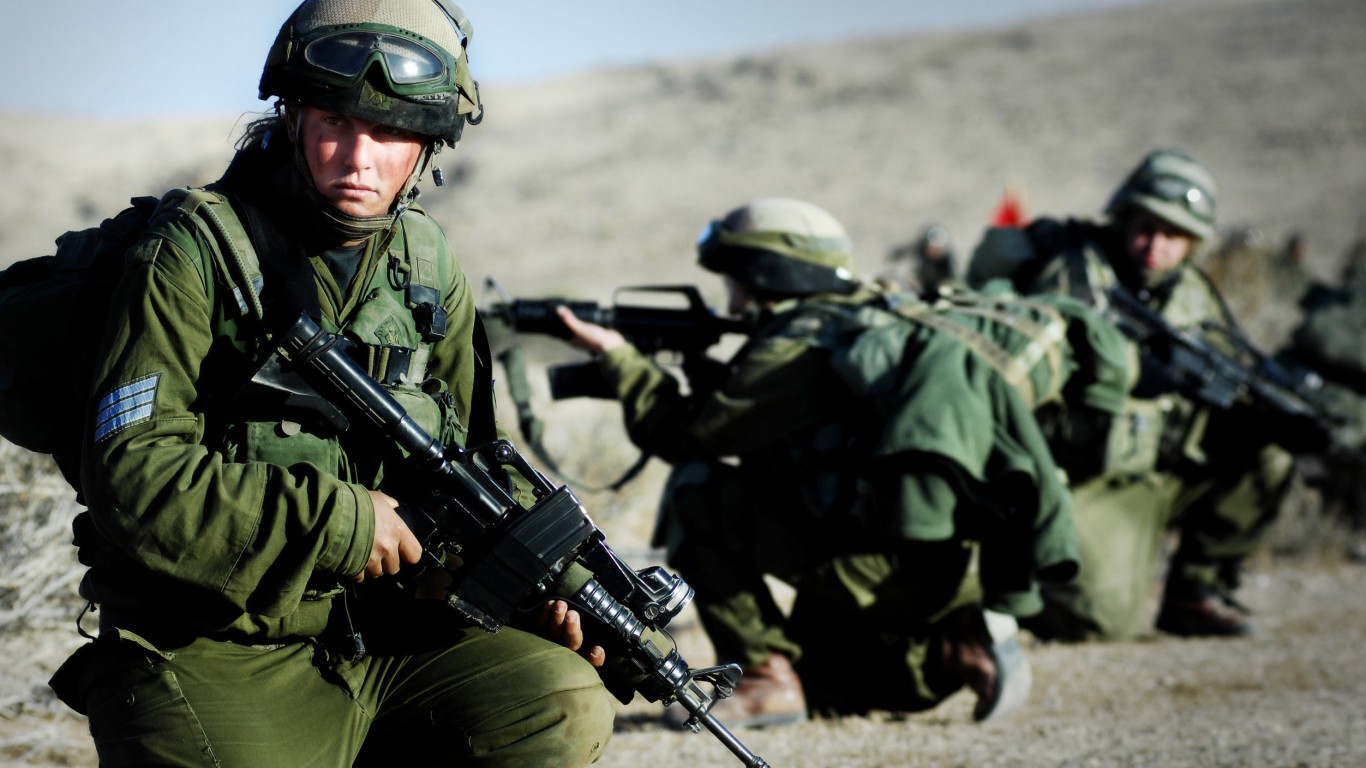
15. Israel
> Share of global arms imports (2014-18): 2.0%
> Main supplier, share of importer’s total imports: USA, 64%
> GDP per capita: $33,132
> Armed forces, total personnel (2016): 184,500
[in-text-ad]
14. Qatar
> Share of global arms imports (2014-18): 2.0%
> Main supplier, share of importer’s total imports: USA, 65%
> GDP per capita: $116,932
> Armed forces, total personnel (2016): 21,500
[recirclink id=488094]
13. Turkey
> Share of global arms imports (2014-18): 2.3%
> Main supplier, share of importer’s total imports: USA, 60%
> GDP per capita: $25,135
> Armed forces, total personnel (2016): 512,000
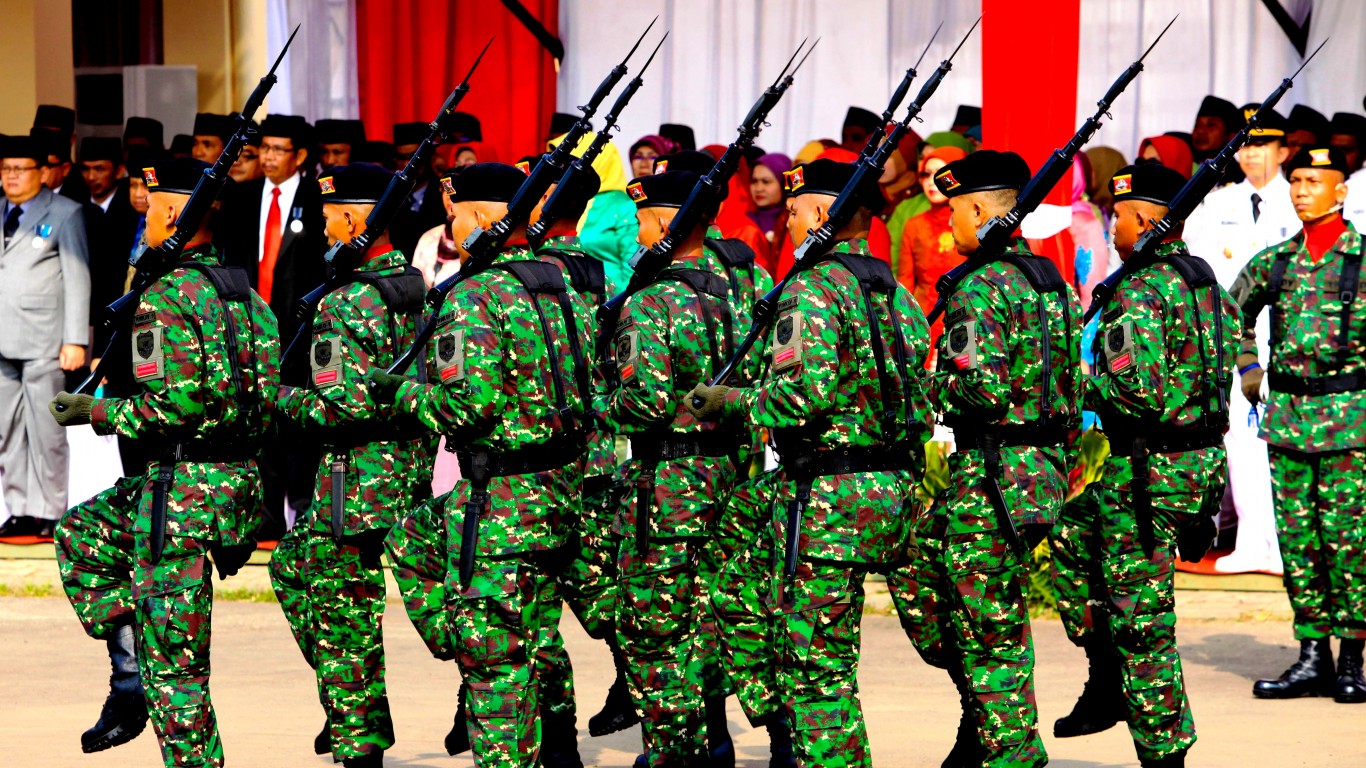
12. Indonesia
> Share of global arms imports (2014-18): 2.5%
> Main supplier, share of importer’s total imports: UK, 19%
> GDP per capita: $11,189
> Armed forces, total personnel (2016): 675,500
[in-text-ad-2]
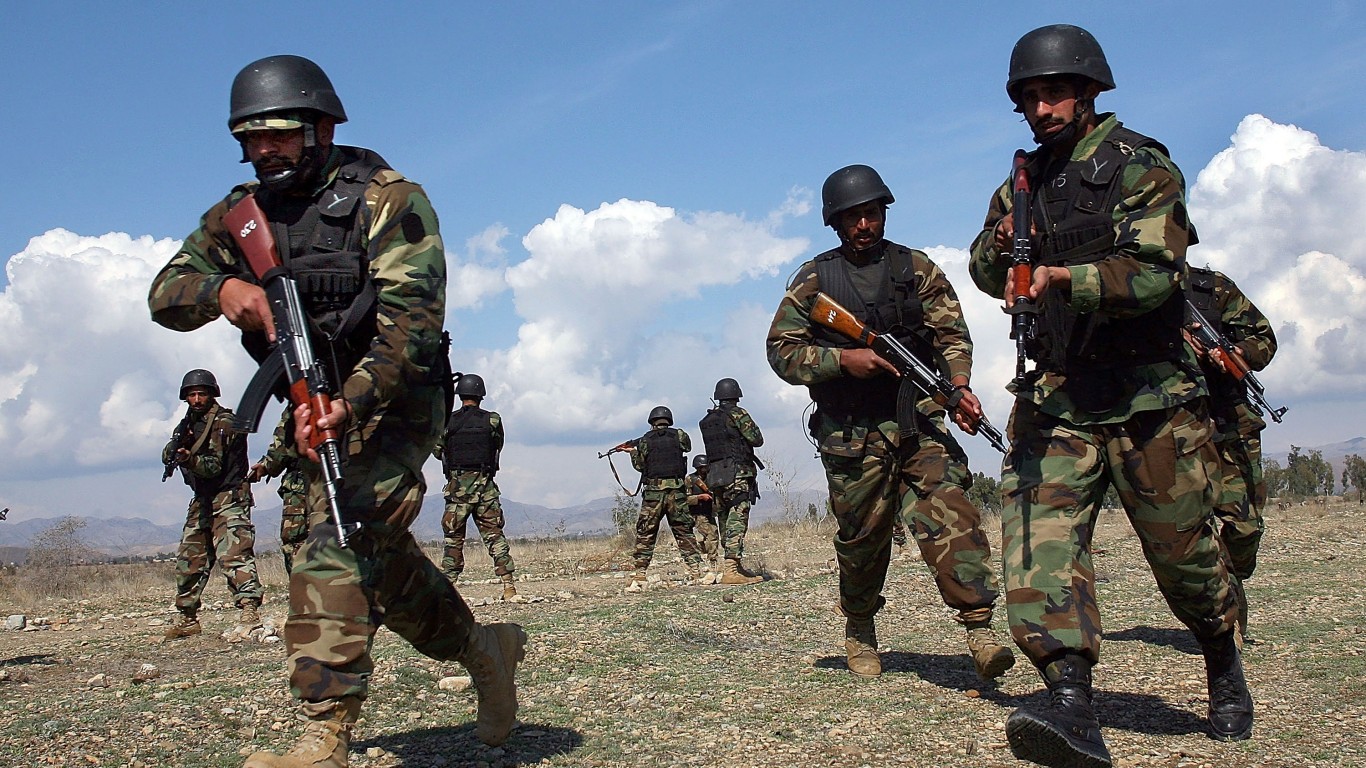
11. Pakistan
> Share of global arms imports (2014-18): 2.7%
> Main supplier, share of importer’s total imports: China, 70%
> GDP per capita: $5,035
> Armed forces, total personnel (2016): 935,800
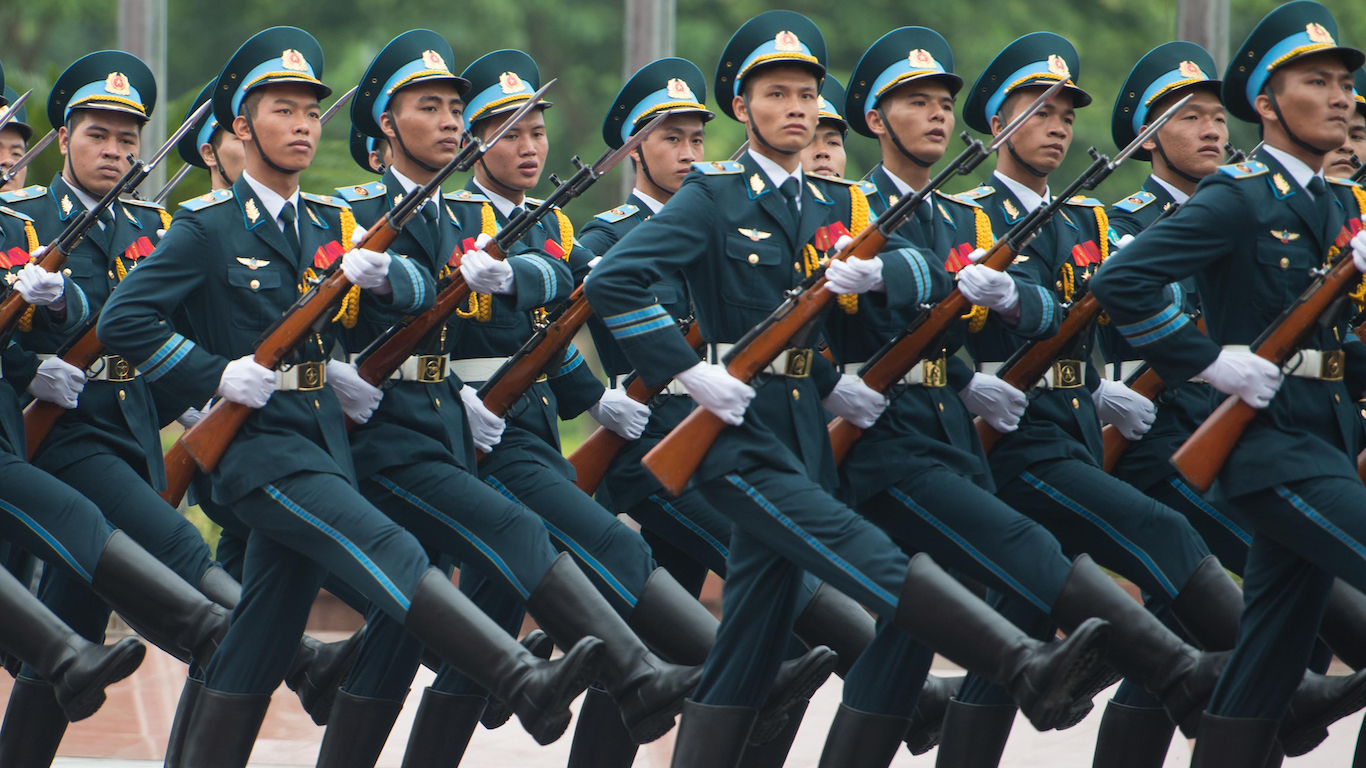
10. Vietnam
> Share of global arms imports (2014-18): 2.9%
> Main supplier, share of importer’s total imports: Russia, 78%
> GDP per capita: $6,172
> Armed forces, total personnel (2016): 522,000
[in-text-ad]
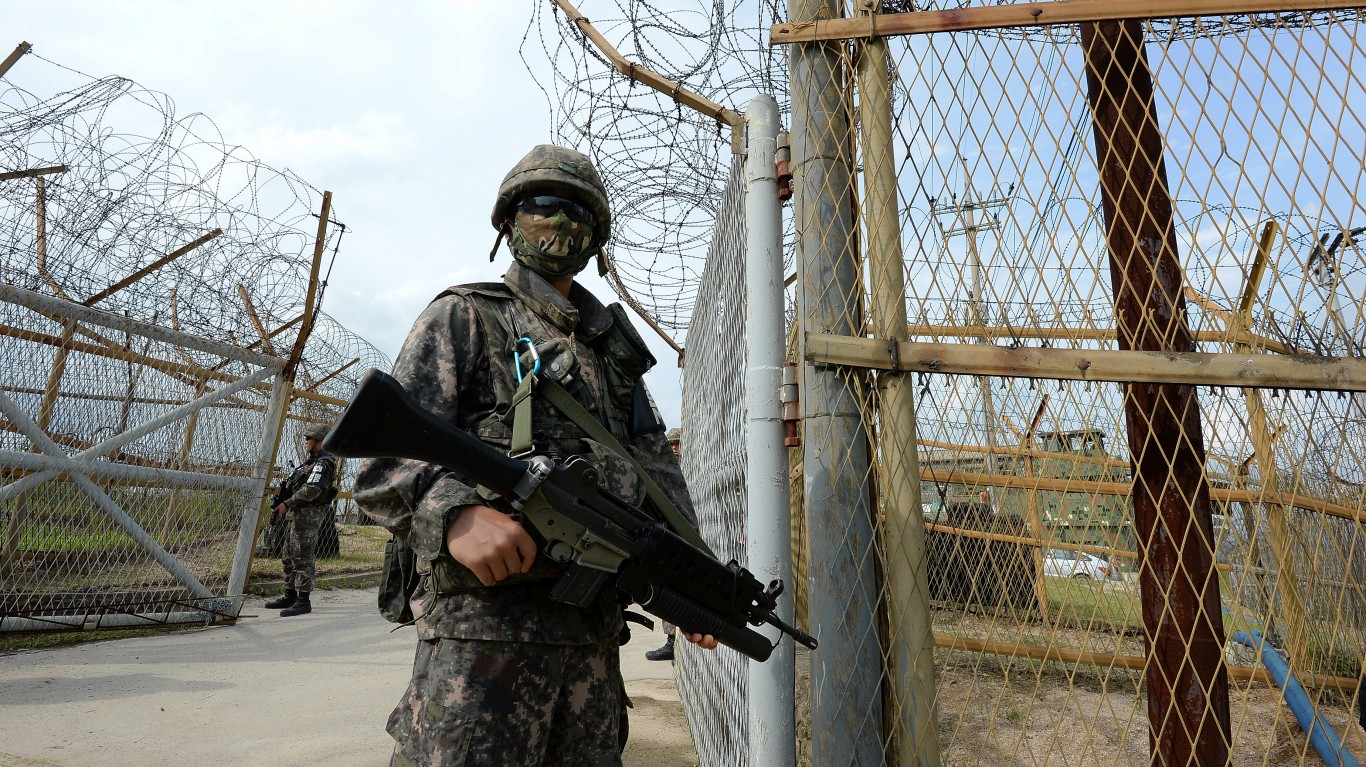
9. South Korea
> Share of global arms imports (2014-18): 3.1%
> Main supplier, share of importer’s total imports: USA, 51%
> GDP per capita: $35,938
> Armed forces, total personnel (2016): 634,000
[recirclink id=488247]
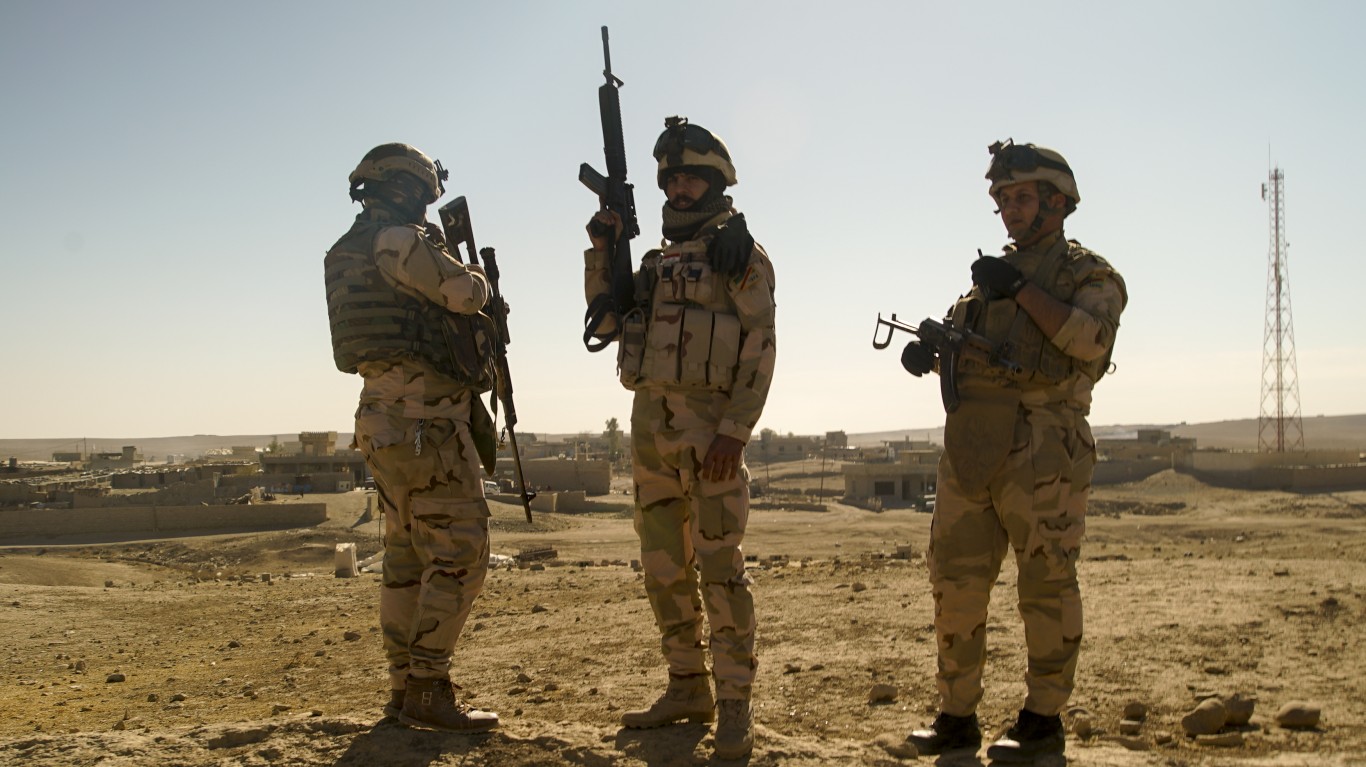
8. Iraq
> Share of global arms imports (2014-18): 3.7%
> Main supplier, share of importer’s total imports: USA, 47%
> GDP per capita: $15,393
> Armed forces, total personnel (2016): 209,000
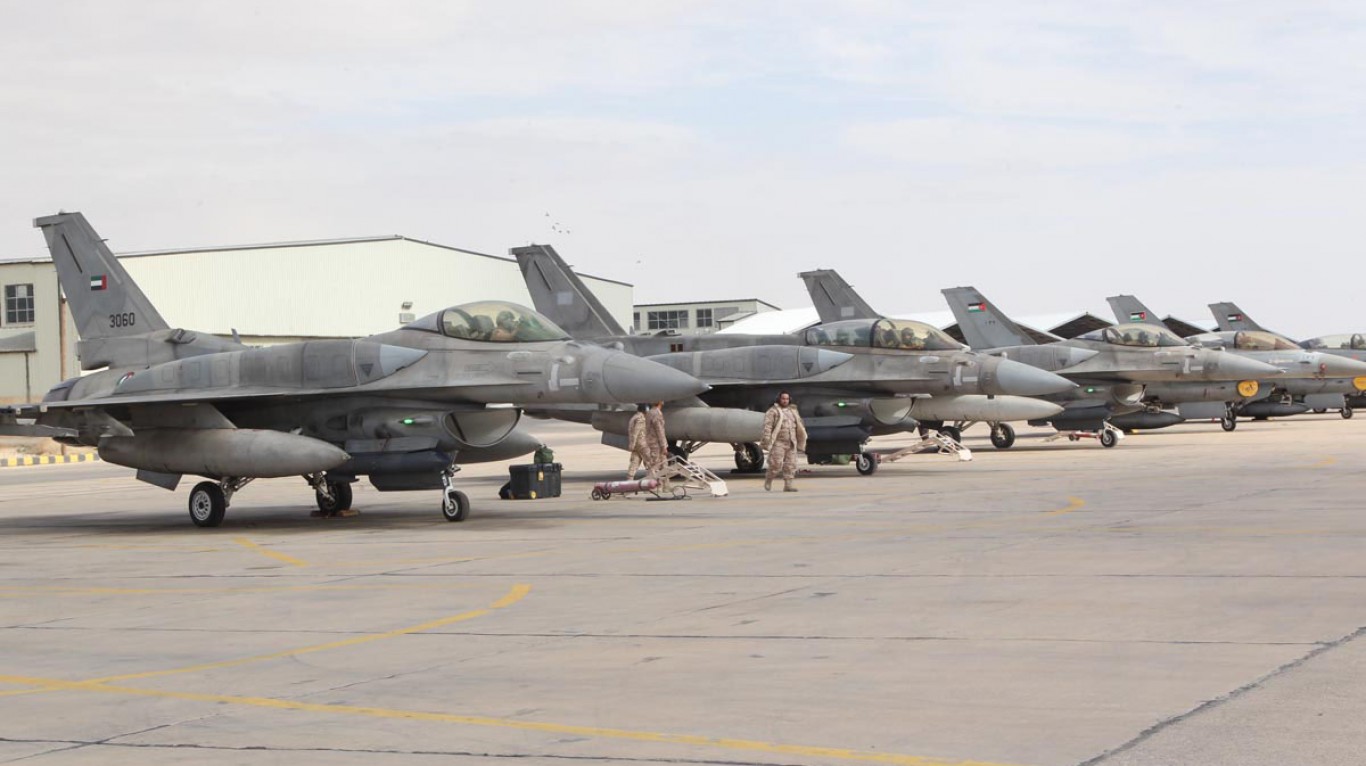
7. United Arab Emirates
> Share of global arms imports (2014-18): 3.7%
> Main supplier, share of importer’s total imports: USA, 64%
> GDP per capita: $67,293
> Armed forces, total personnel (2016): 63,000
[in-text-ad-2]
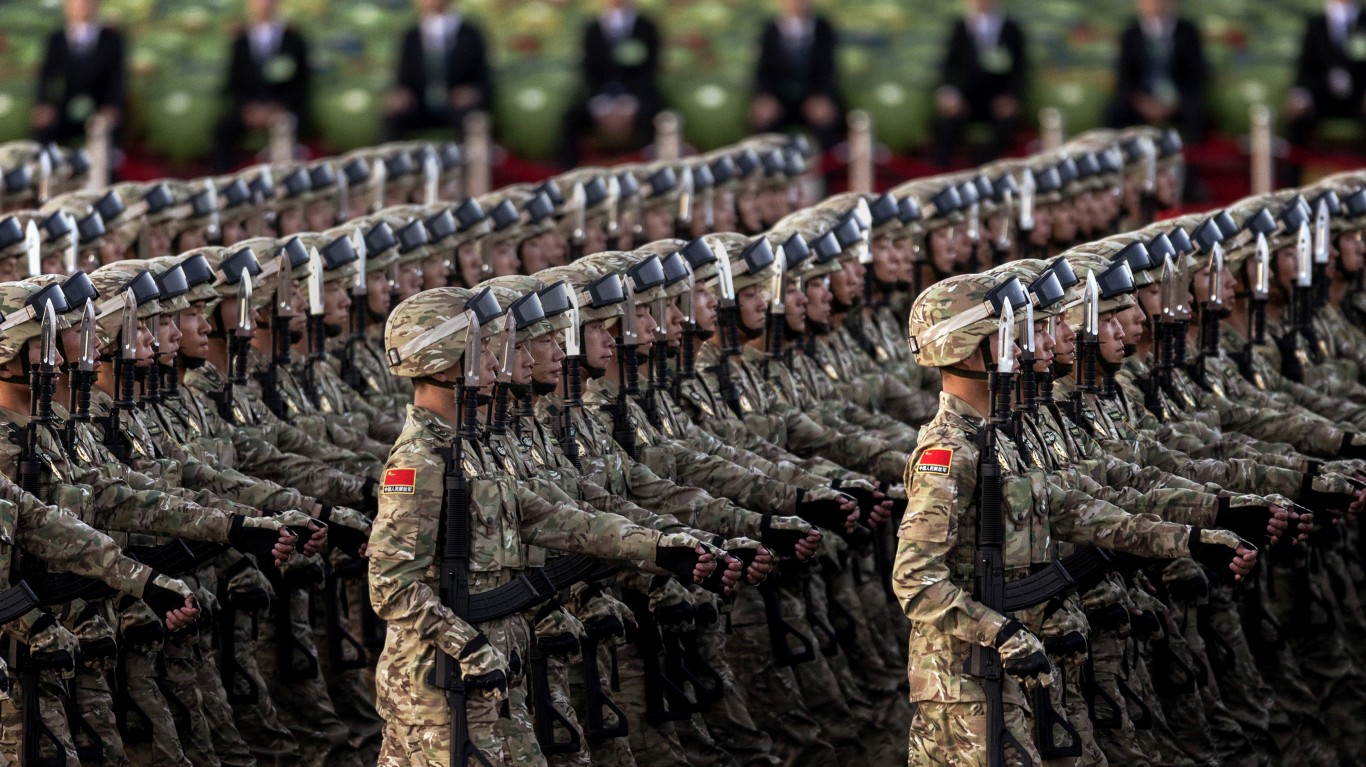
6. China
> Share of global arms imports (2014-18): 4.2%
> Main supplier, share of importer’s total imports: Russia, 70%
> GDP per capita: $15,309
> Armed forces, total personnel (2016): 2,695,000
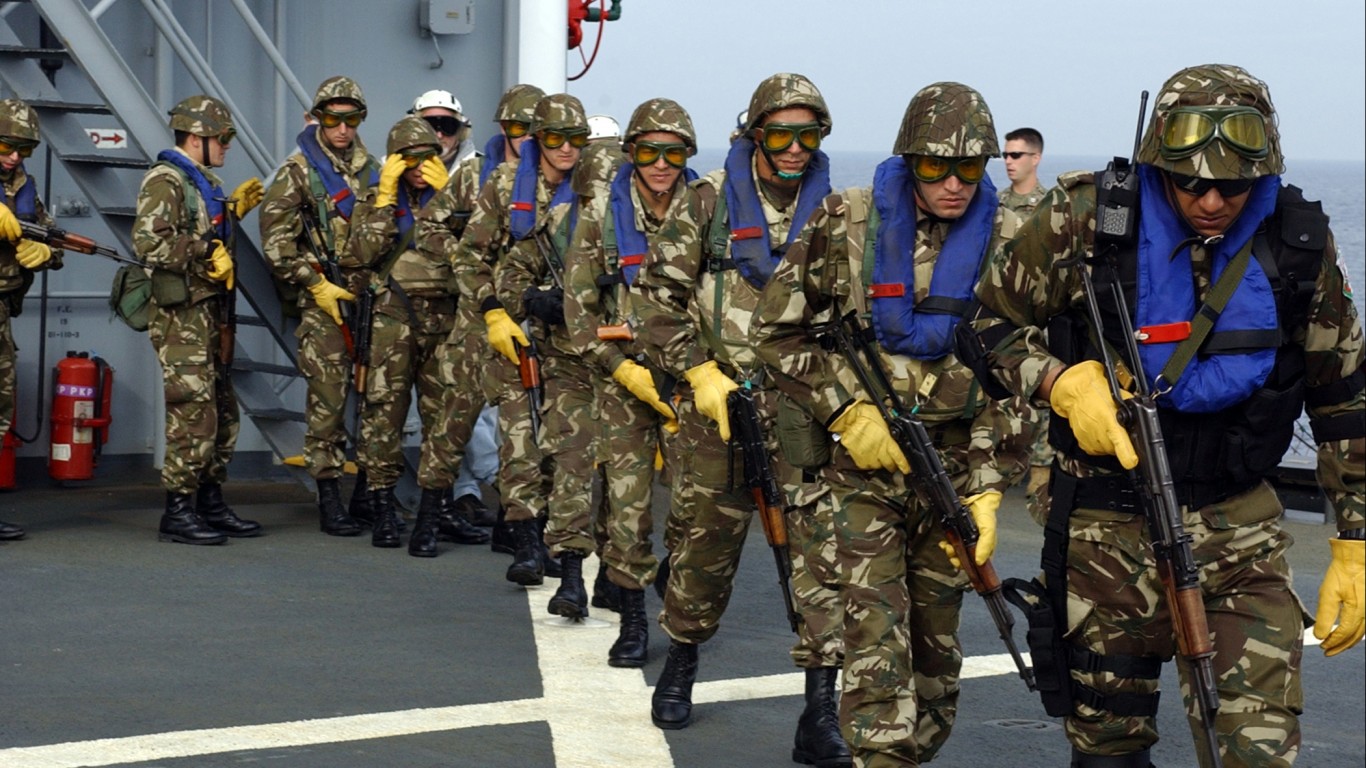
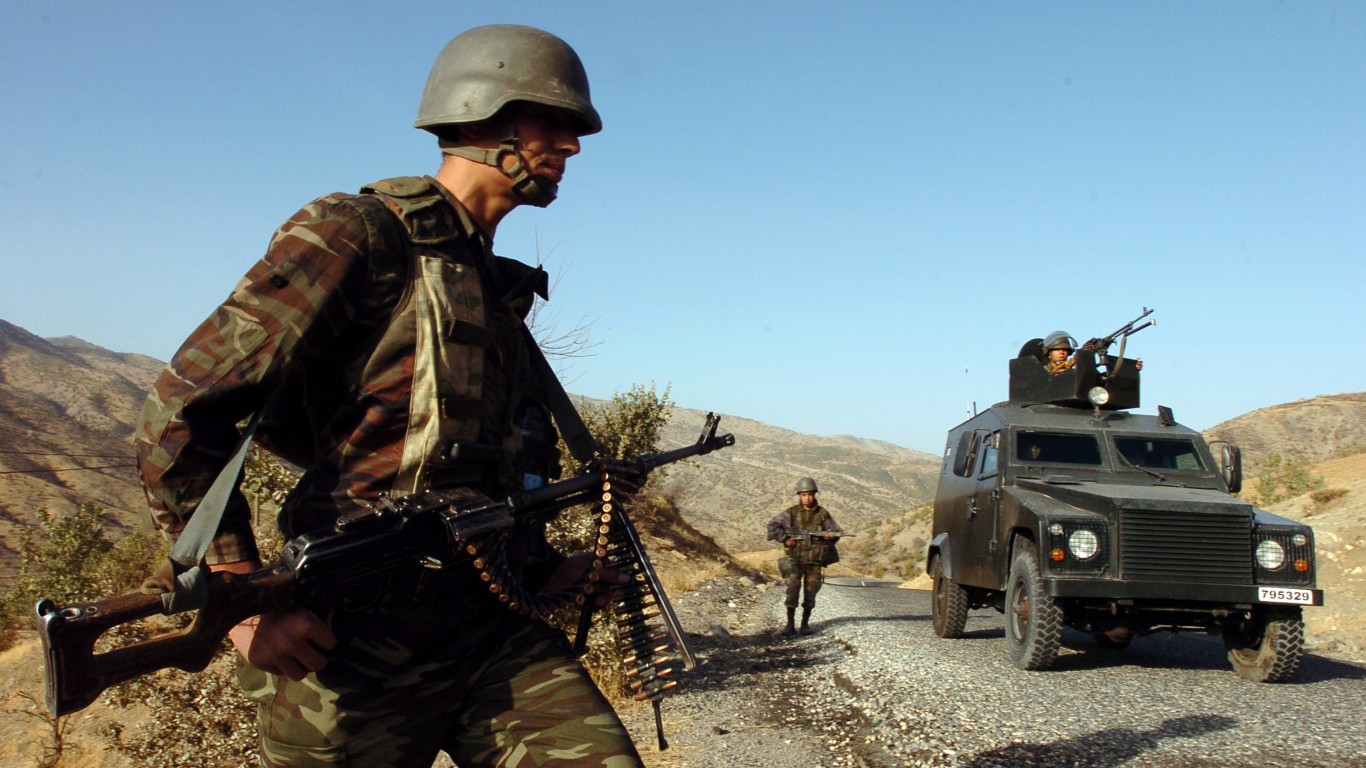
5. Algeria
> Share of global arms imports (2014-18): 4.4%
> Main supplier, share of importer’s total imports: Russia, 66%
> GDP per capita: $13,900
> Armed forces, total personnel (2016): 317,200
[in-text-ad]
4. Australia
> Share of global arms imports (2014-18): 4.6%
> Main supplier, share of importer’s total imports: USA, 60%
> GDP per capita: $44,649
> Armed forces, total personnel (2016): 57,800
[recirclink id=488174]
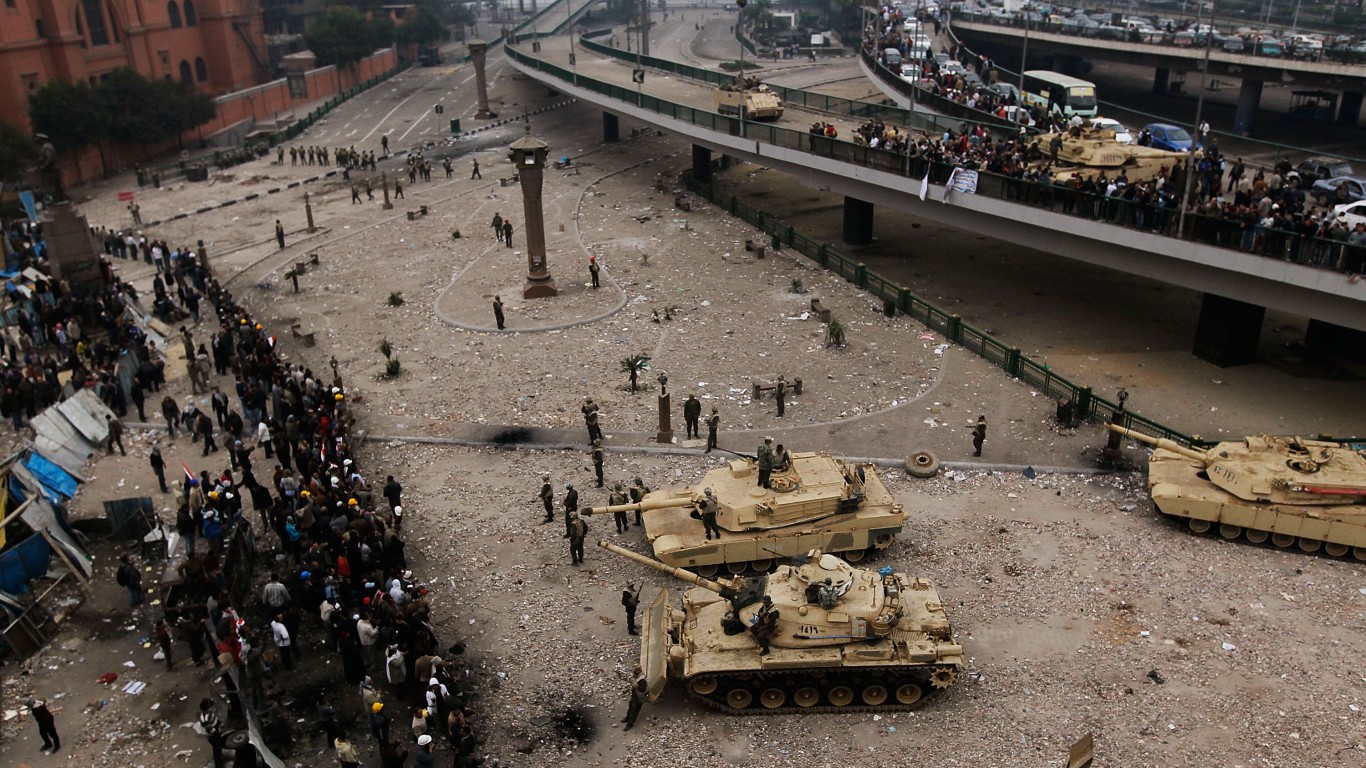
3. Egypt
> Share of global arms imports (2014-18): 5.1%
> Main supplier, share of importer’s total imports: France, 37%
> GDP per capita: $10,551
> Armed forces, total personnel (2016): 835,500
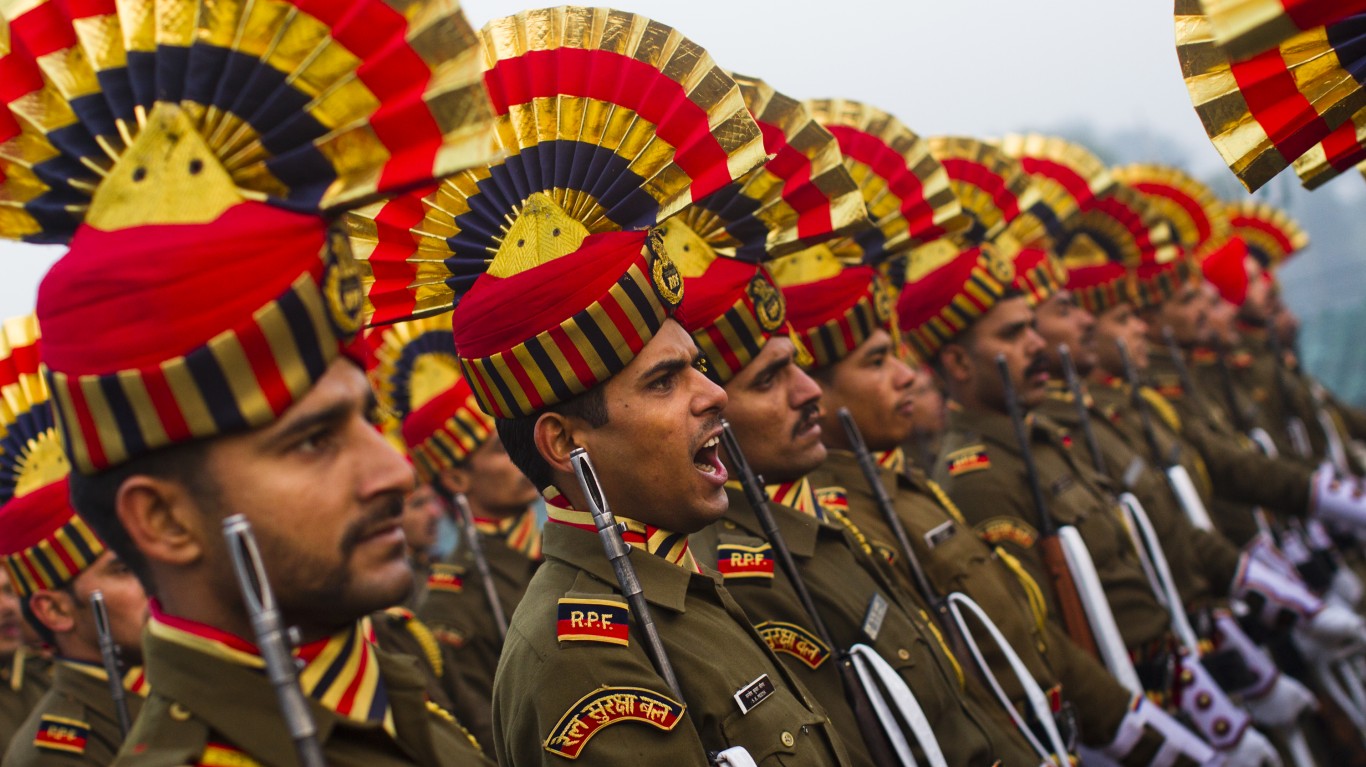
2. India
> Share of global arms imports (2014-18): 9.5%
> Main supplier, share of importer’s total imports: Russia, 58%
> GDP per capita: $6,430
> Armed forces, total personnel (2016): 2,981,050
[in-text-ad-2]

1. Saudi Arabia
> Share of global arms imports (2014-18): 12.0%
> Main supplier, share of importer’s total imports: USA, 68%
> GDP per capita: $48,986
> Armed forces, total personnel (2016): 251,500