Living in one of the world’s biggest cities confers all kinds of benefits, including access to public transportation, entertainment, jobs, restaurants and more. But for many millions of people around the world, living in a city also means being exposed to deadly air pollution on a regular basis.
One specific type of air pollution, commonly known as PM2.5 — shorthand for particulate matter that is 2.5 micrometers in diameter or smaller — is especially harmful. For perspective, the diameter of a human hair is 50-70 micrometers, so particles that are 2.5 micrometers or smaller are very fine and inhalable.
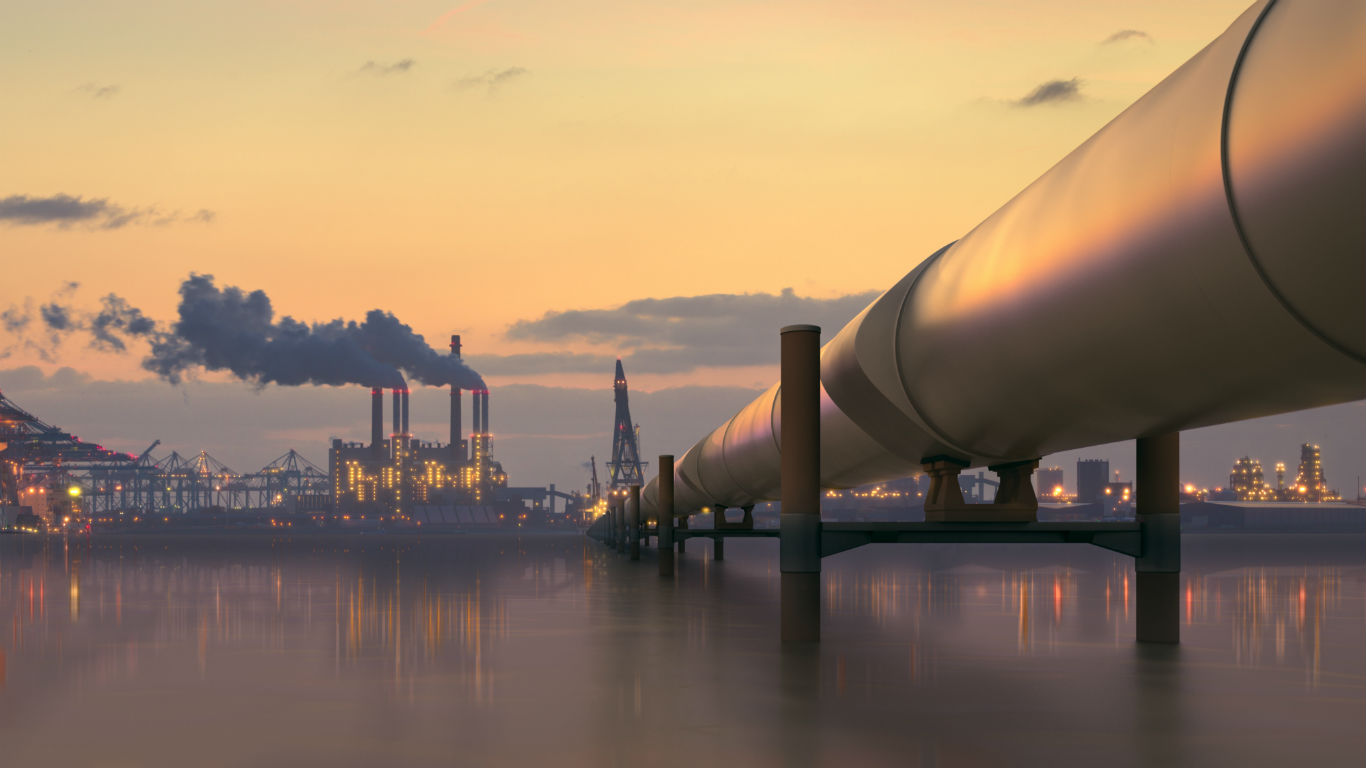
The source of PM2.5 is typically combustion — fires, automobiles, or factories — and this type of air pollution has been linked to a number of health issues, including asthma, lung infections, heart attacks, and premature death.
Heavy industrialization and overpopulation are among the most common causes of high concentrations of air pollution in the cities on this list — though they are not the only culprits. In some of the most polluted cities, high concentrations of fine particulates in the air are the result of lacking or non-existent public works infrastructure, such as sewage systems.
To identify the world’s most polluted cities, 24/7 Tempo reviewed the average annual concentration of PM2.5 particles in nearly 1,300 cities around the globe from the World Health Organization’s 2018 update to its Global Ambient Air Quality Database. The 28 cities on this list all have a PM2.5 concentration of at least 85 micrograms per cubic meter or more. To compare, the most polluted U.S. city, Bakersfield, California, reported an annual average PM2.5 concentration of 18 micrograms.
The vast majority of the cities on this list can be found in either China or India. The high number of cities from the two countries might seem to suggest these nations have especially poor regulations or industries that tend to pollute. Neither nation ranks among the countries doing the least to protect the environment, but among the world’s largest industrial powers, they rank behind the U.S. in air quality regulations.
While this may be the case, the two nations also simply have a large number of highly populated cities. Of the 150 most populous cities with available data from the U.N., more than one in three are in either China or India. Only five of the cities on this list have populations below 0.5 million. Several of the cities on this list are or are located near the world’s 33 megacities.
We also included PM10 pollution, or concentration levels of larger inhalable particles that are 10 micrometer in diameter or smaller. While the finer PM2.5 particles can get deep into the lungs and even the bloodstream, the coarser PM10 particles are less harmful, although they can irritate a person’s eyes, nose, and throat.
Click Here to Read About the 28 Most Polluted Cities in the World.
To identify the most polluted cities in the world, 24/7 Wall St. ranked nearly 3,000 cities worldwide based on the annual average concentration of PM2.5 per square meter of air. We only considered the most recent air quality data from the WHO Global Ambient Air Quality Database (update 2018). Only cities for which PM2.5 concentration was directly measured and not imputed from other measures of air pollution were considered. Though it was not factored into the ranking, we also included PM10 concentration. Pollution data came from the World Health Organization. Population figures also came from the WHO Global Ambient Air Quality Database (update 2018). For cities not included in the U.N. report, population estimates came from a range of sources.

28. Jiaozuo, Central China
> Population: 732,000
> Average annual PM2.5 pollution per cubic meter: 85.0 micrograms
> Average annual PM10 pollution per cubic meter: 142.0 micrograms
[in-text-ad]
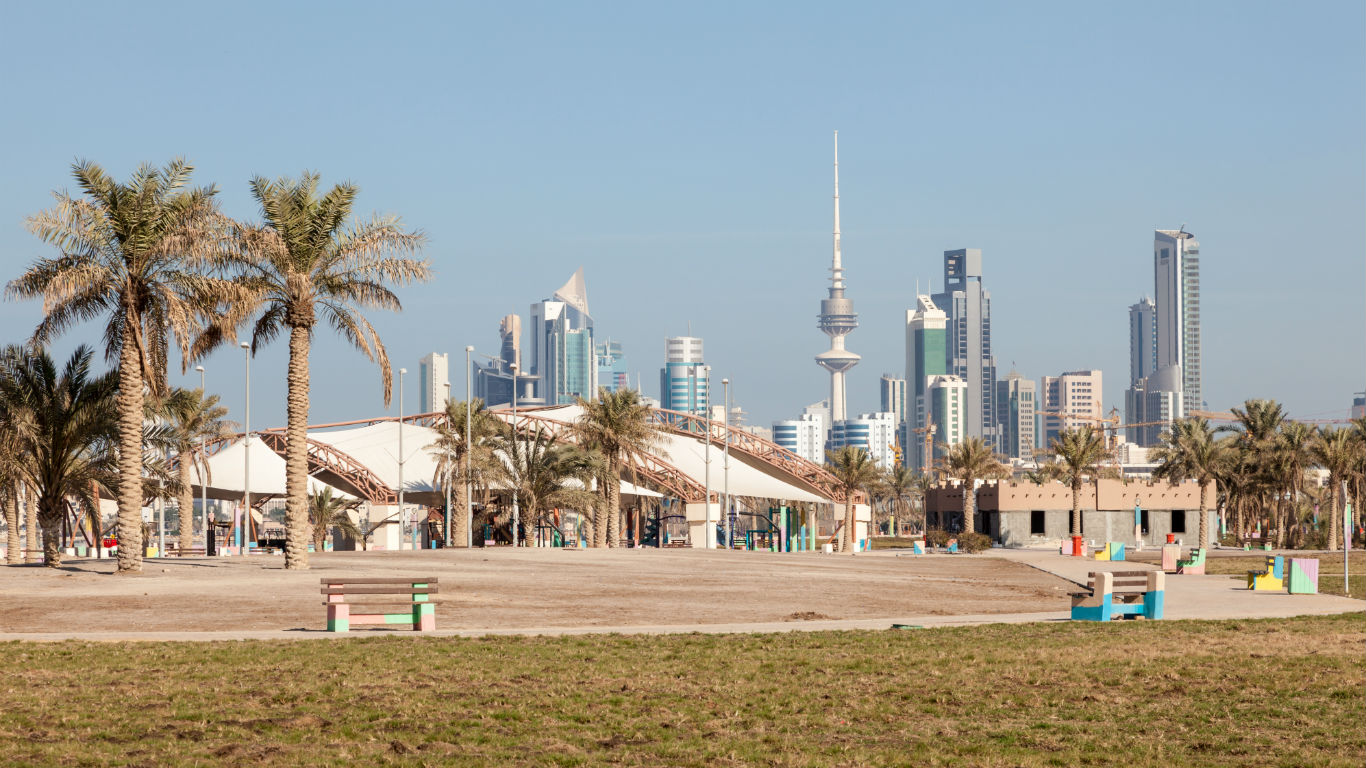
27. Al-Shuwaikh, Kuwait
> Population: 2,500
> Average annual PM2.5 pollution per cubic meter: 85.3 micrograms
> Average annual PM10 pollution per cubic meter: 180.1 micrograms
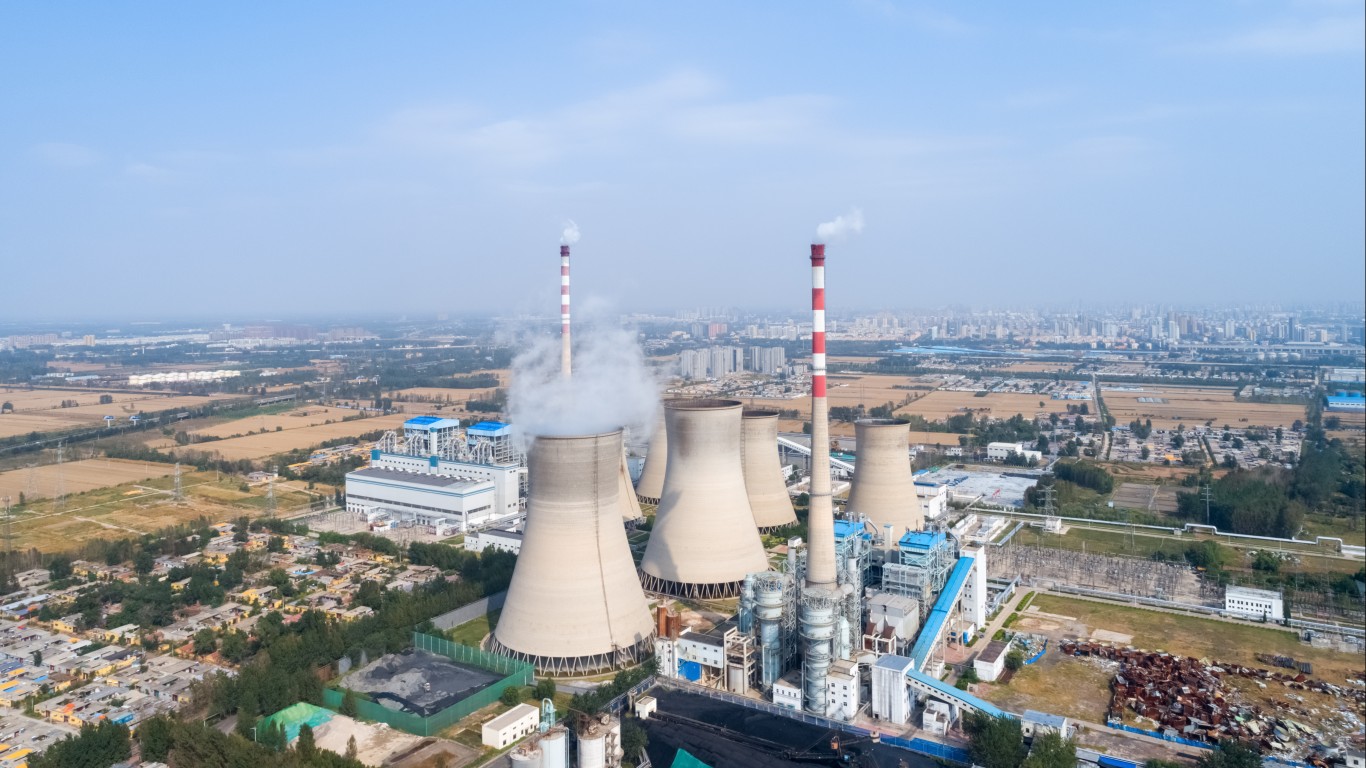
25. Liaocheng, East China
> Population: 677,000
> Average annual PM2.5 pollution per cubic meter: 86.0 micrograms
> Average annual PM10 pollution per cubic meter: 151.0 micrograms
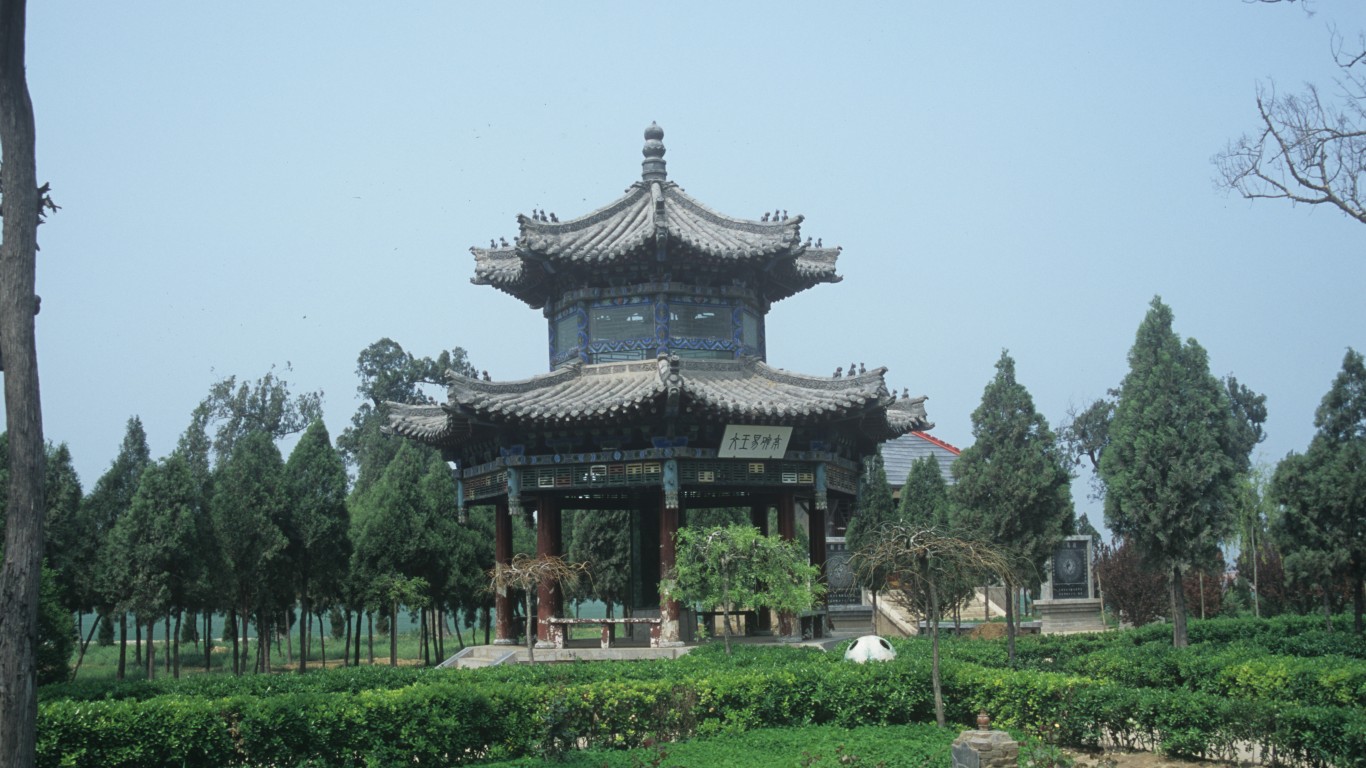
25. Anyang, Central China
> Population: 1.1 million
> Average annual PM2.5 pollution per cubic meter: 86.0 micrograms
> Average annual PM10 pollution per cubic meter: 155.0 micrograms
[in-text-ad-2]
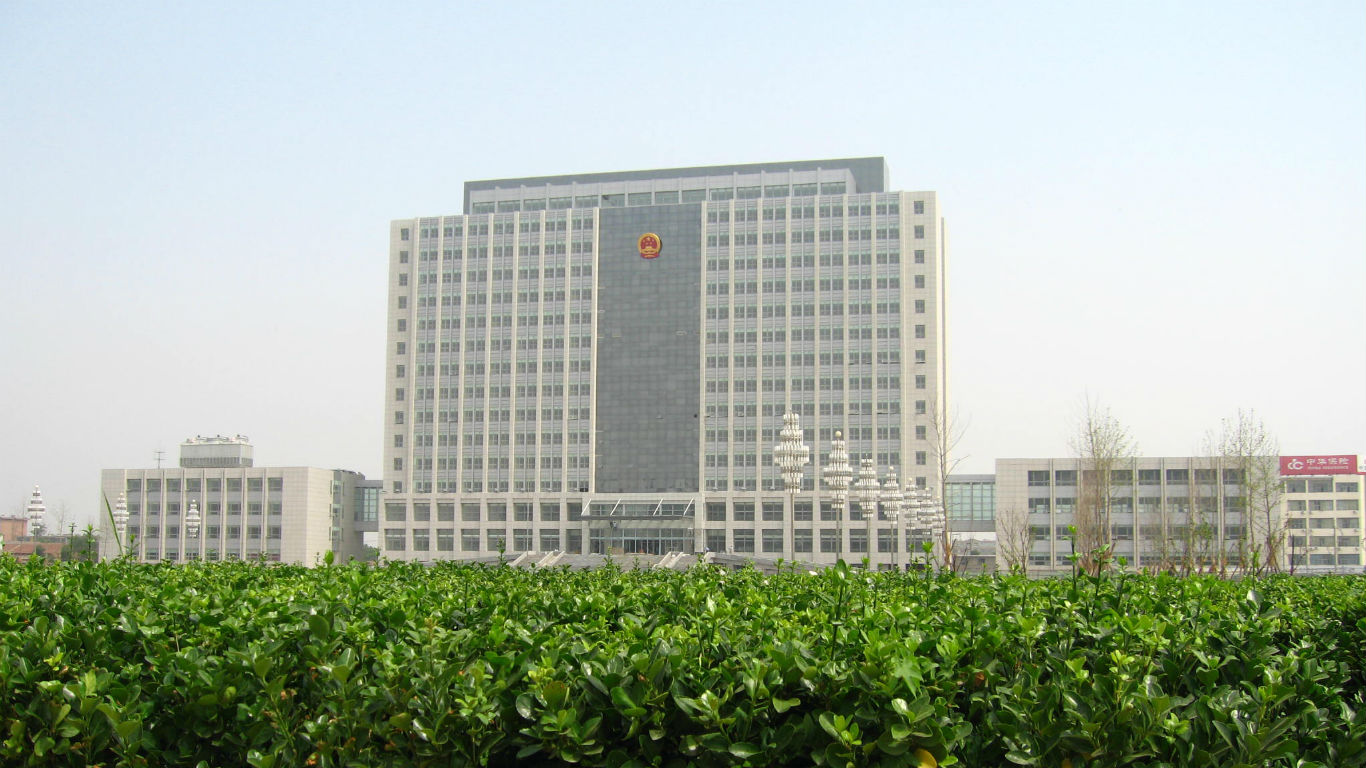
23. Hengshui, North China
> Population: 478,000
> Average annual PM2.5 pollution per cubic meter: 87.0 micrograms
> Average annual PM10 pollution per cubic meter: 143.0 micrograms
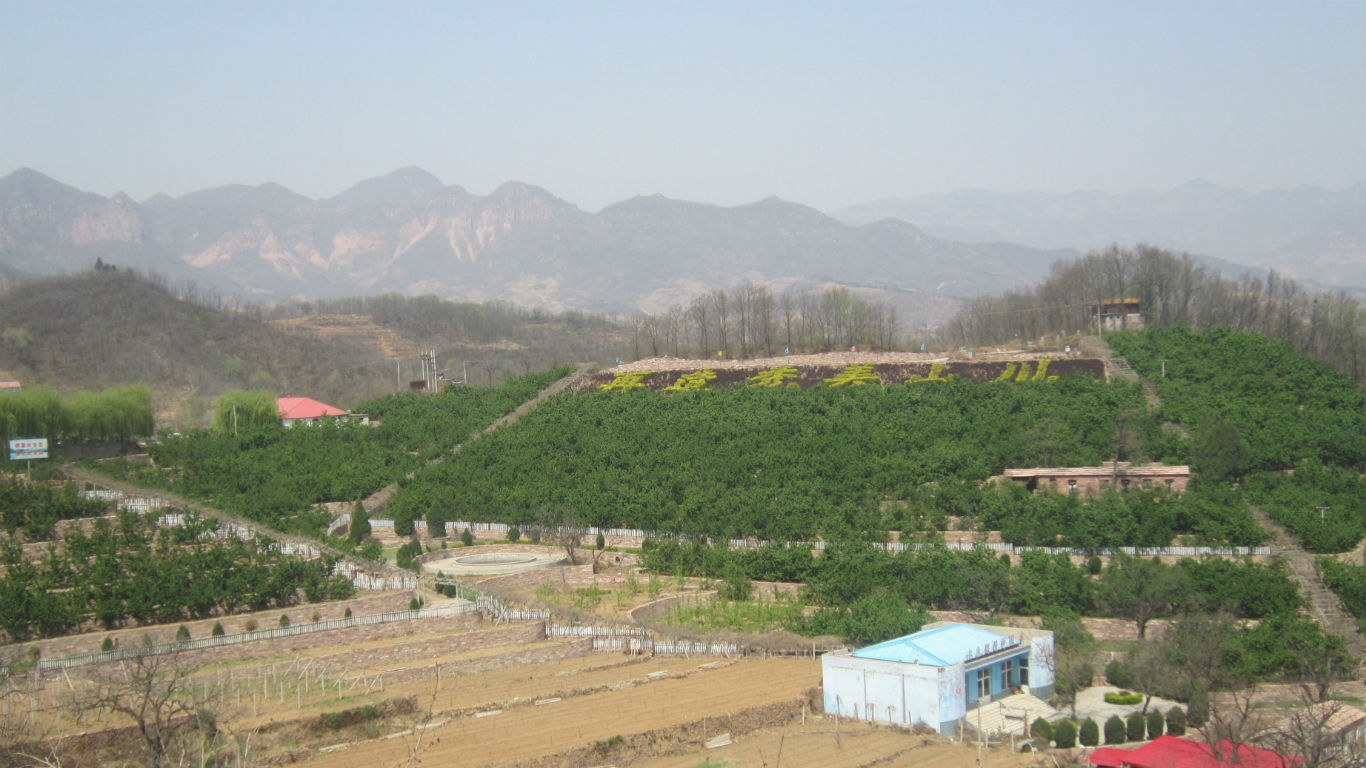
23. Xingtai, North China
> Population: 742,000
> Average annual PM2.5 pollution per cubic meter: 87.0 micrograms
> Average annual PM10 pollution per cubic meter: 185.9 micrograms
[in-text-ad]
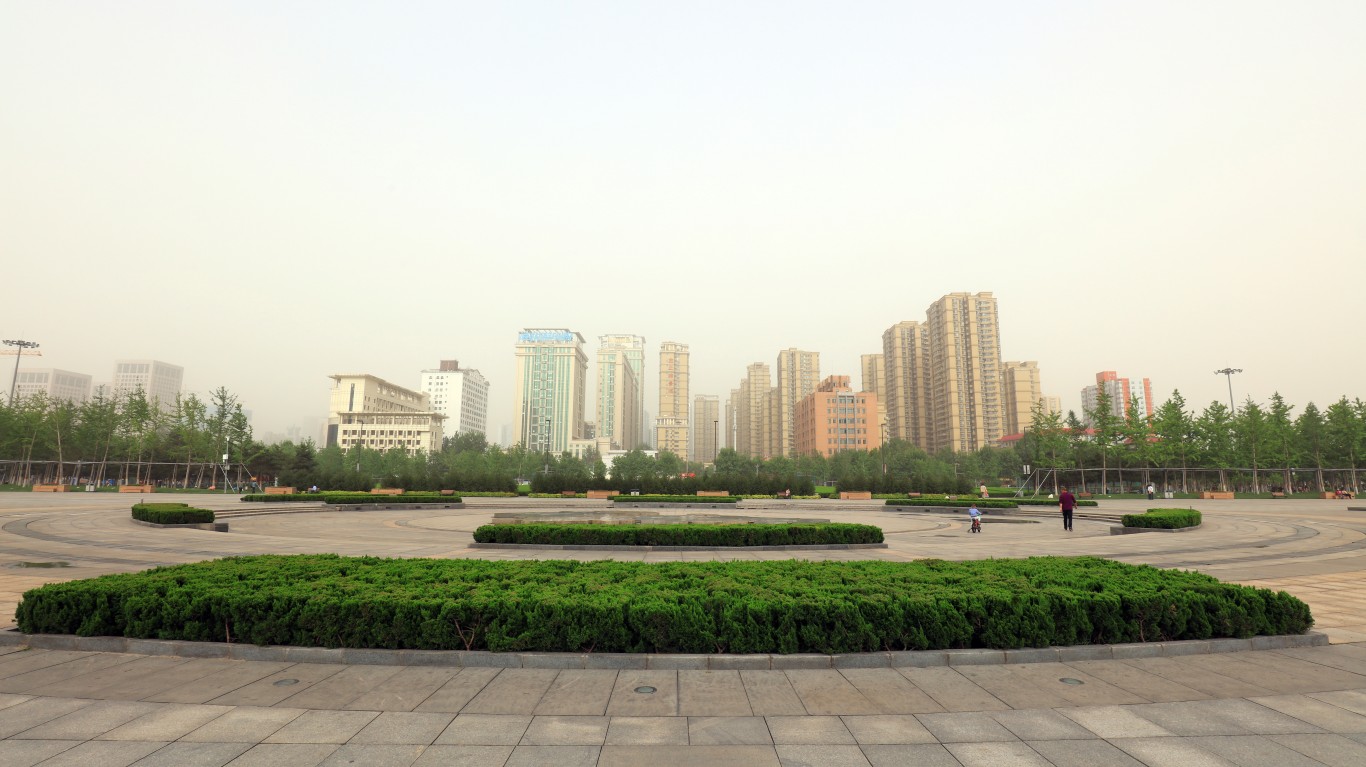
22. Shijiazhuang, North China
> Population: 3.3 million
> Average annual PM2.5 pollution per cubic meter: 89.0 micrograms
> Average annual PM10 pollution per cubic meter: 147.0 micrograms
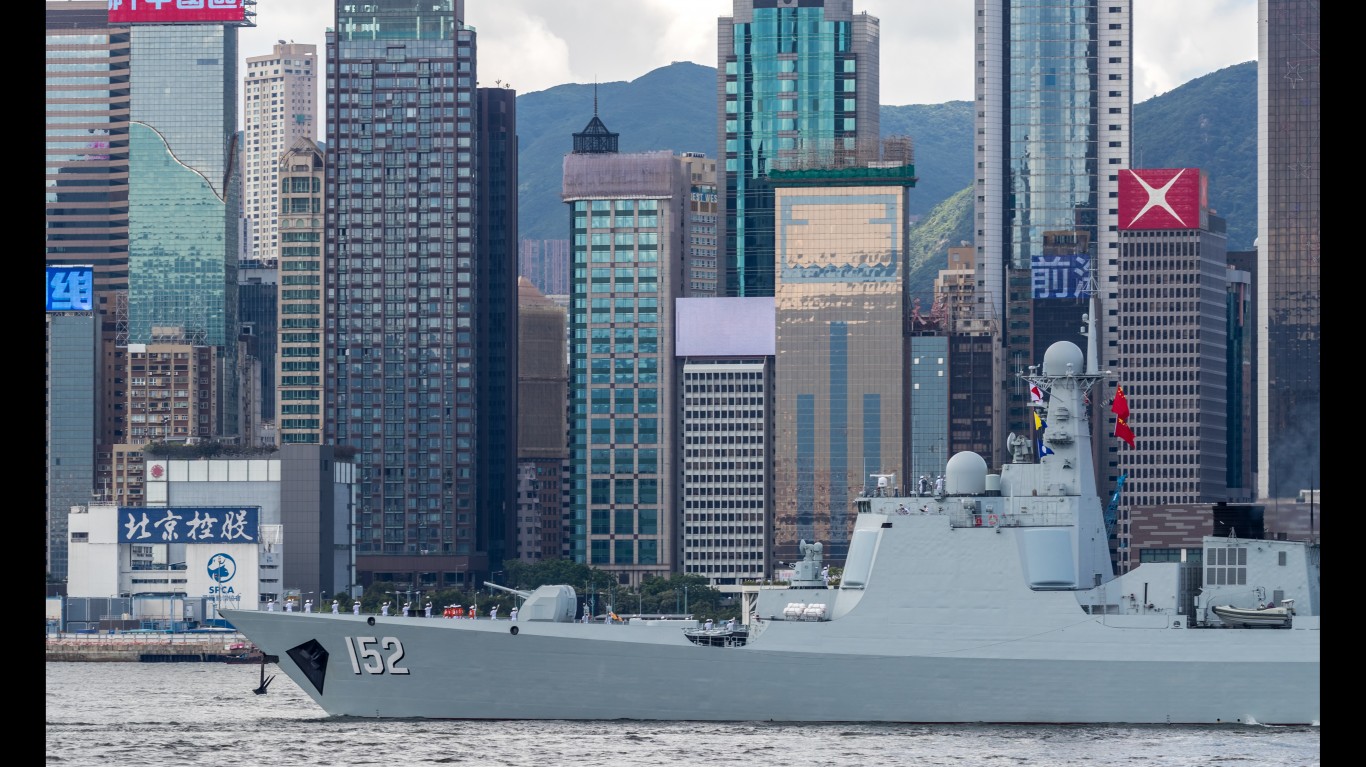
21. Ji’nan, East China
> Population: 4.0 million
> Average annual PM2.5 pollution per cubic meter: 90.0 micrograms
> Average annual PM10 pollution per cubic meter: 192.3 micrograms
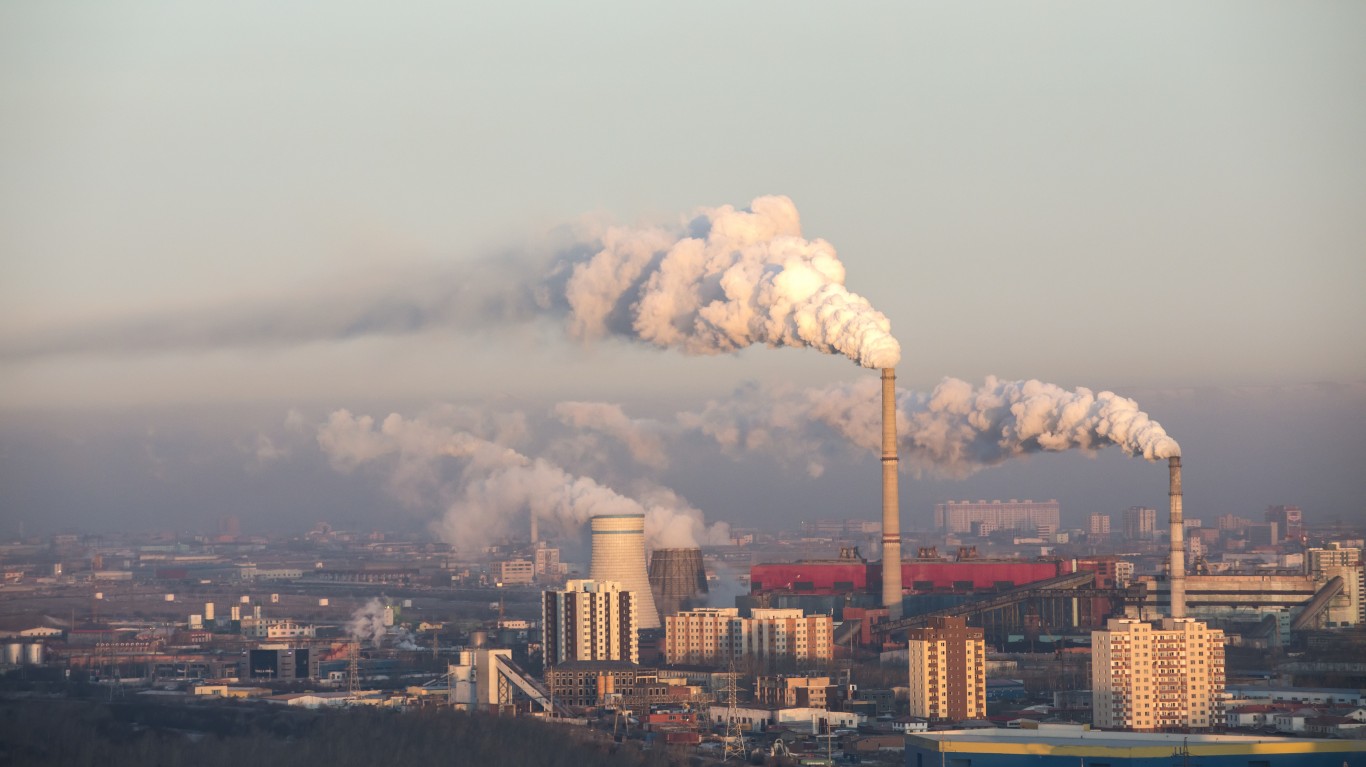
20. Ulaanbaatar, Mongolia
> Population: 1.4 million
> Average annual PM2.5 pollution per cubic meter: 92.2 micrograms
> Average annual PM10 pollution per cubic meter: 196.9 micrograms
[in-text-ad-2]
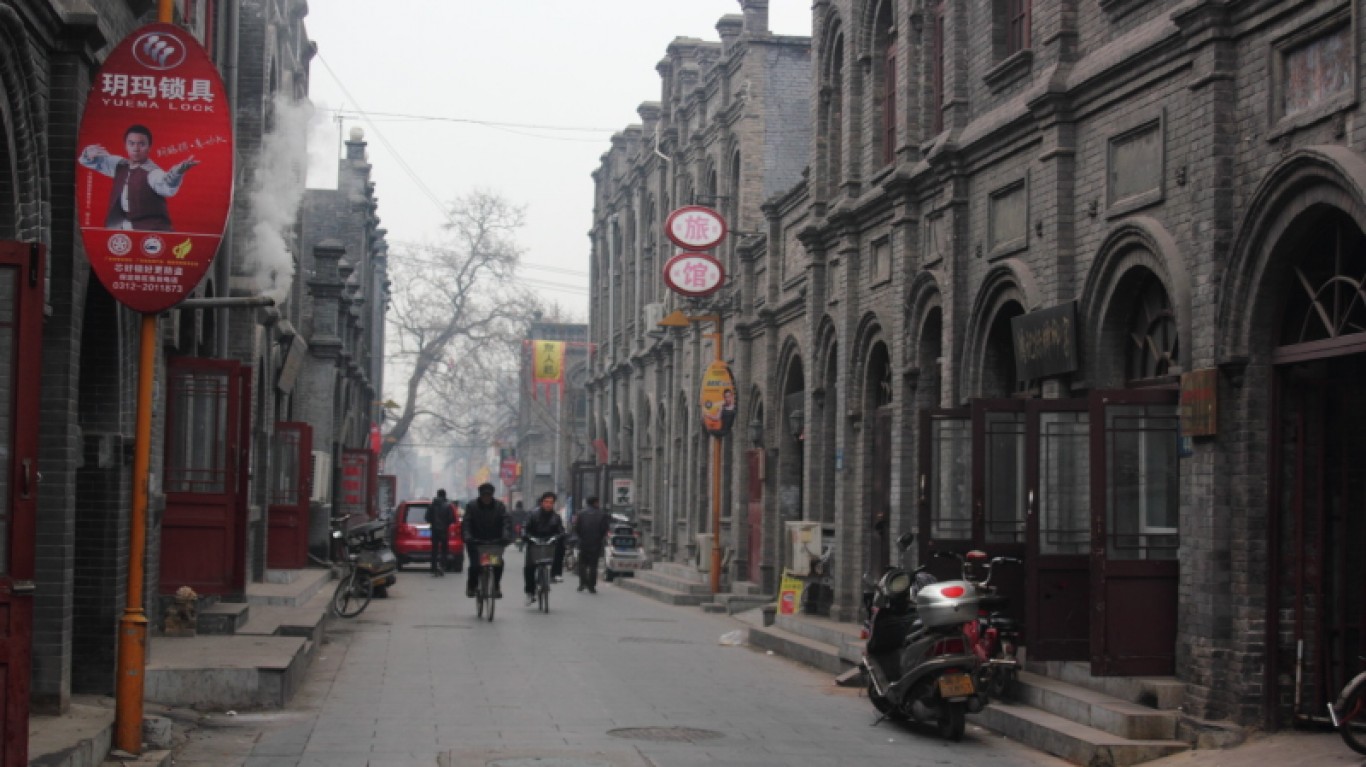
19. Baoding, North China
> Population: 1.1 million
> Average annual PM2.5 pollution per cubic meter: 93.0 micrograms
> Average annual PM10 pollution per cubic meter: 147.0 micrograms
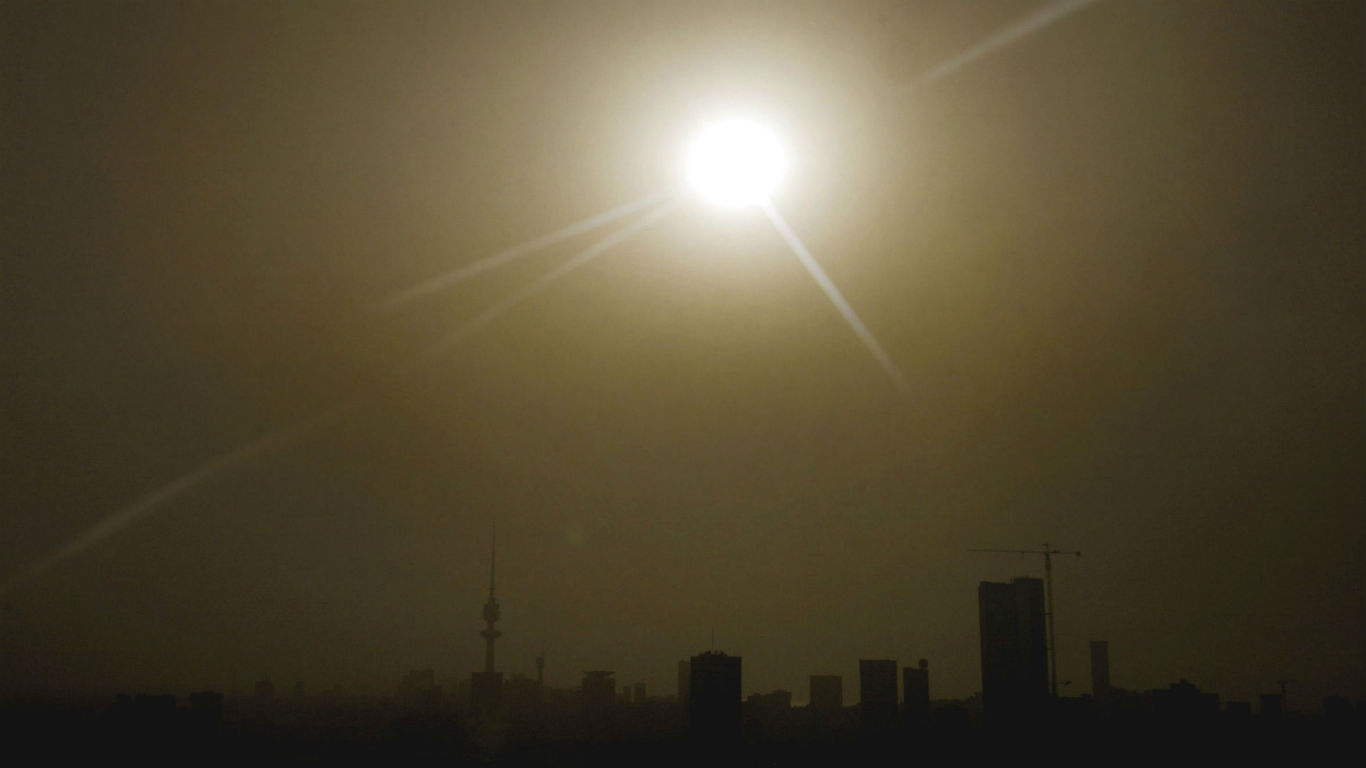
18. Ali Subah Al-Salem, Kuwait
> Population: 42,000
> Average annual PM2.5 pollution per cubic meter: 93.8 micrograms
> Average annual PM10 pollution per cubic meter: 198.1 micrograms
[in-text-ad]
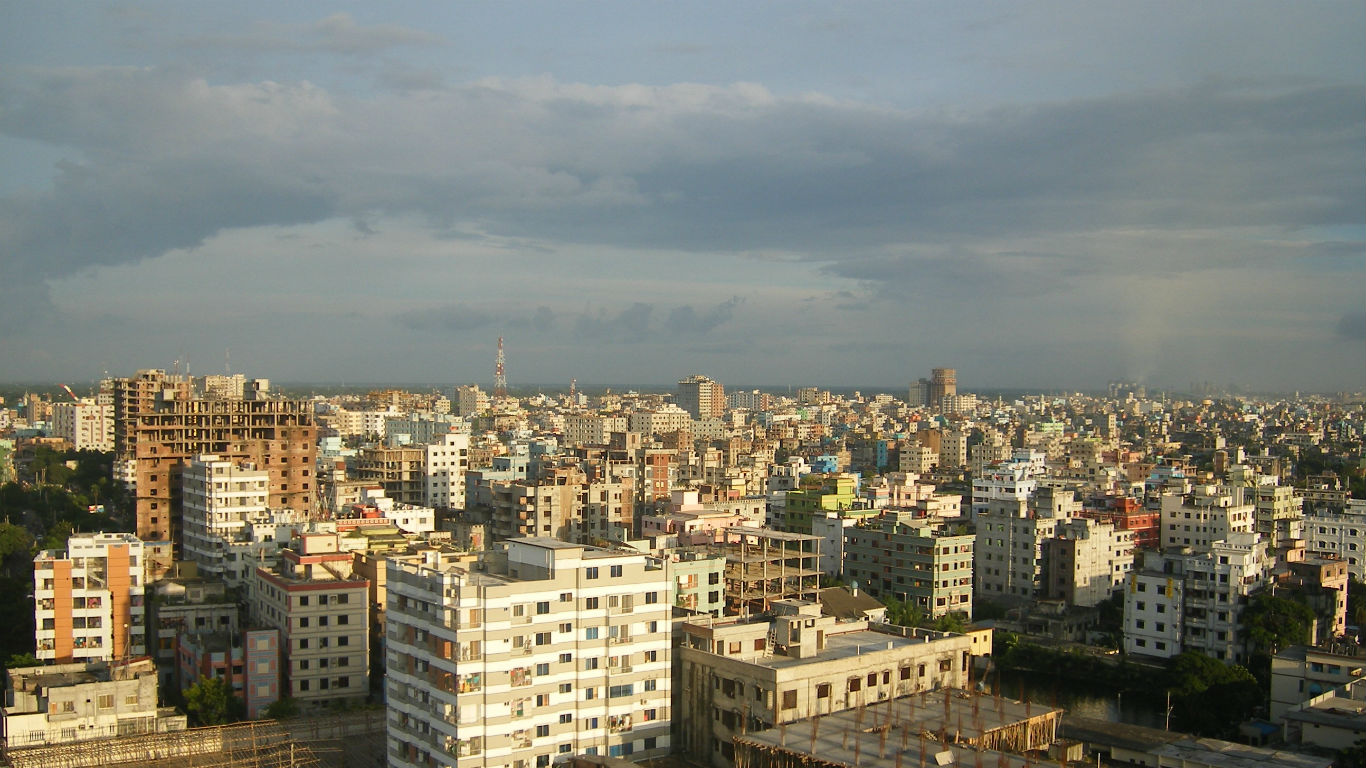
17. Narayangonj, Bangladesh
> Population: 543,000
> Average annual PM2.5 pollution per cubic meter: 94.2 micrograms
> Average annual PM10 pollution per cubic meter: 205.0 micrograms
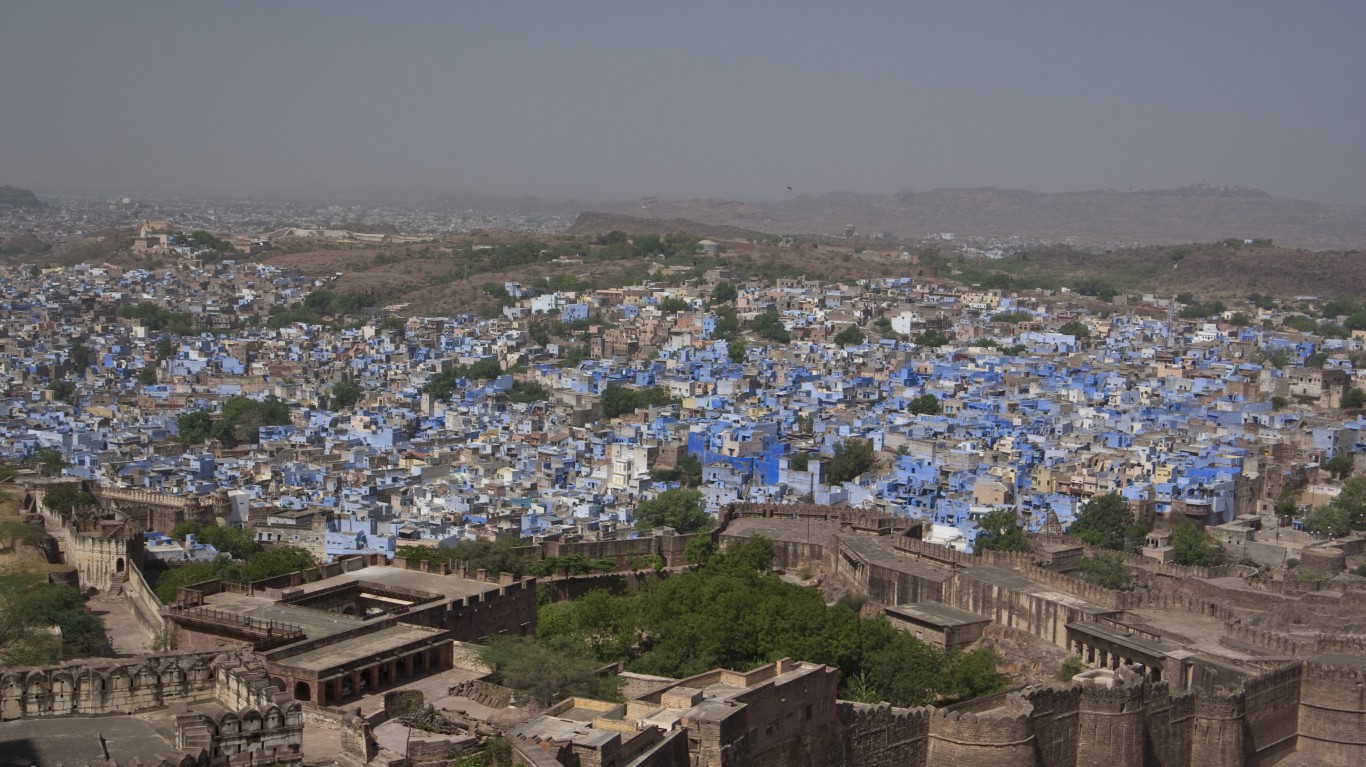
16. Jodhpur, West India
> Population: 1.3 million
> Average annual PM2.5 pollution per cubic meter: 97.8 micrograms
> Average annual PM10 pollution per cubic meter: 180.2 micrograms
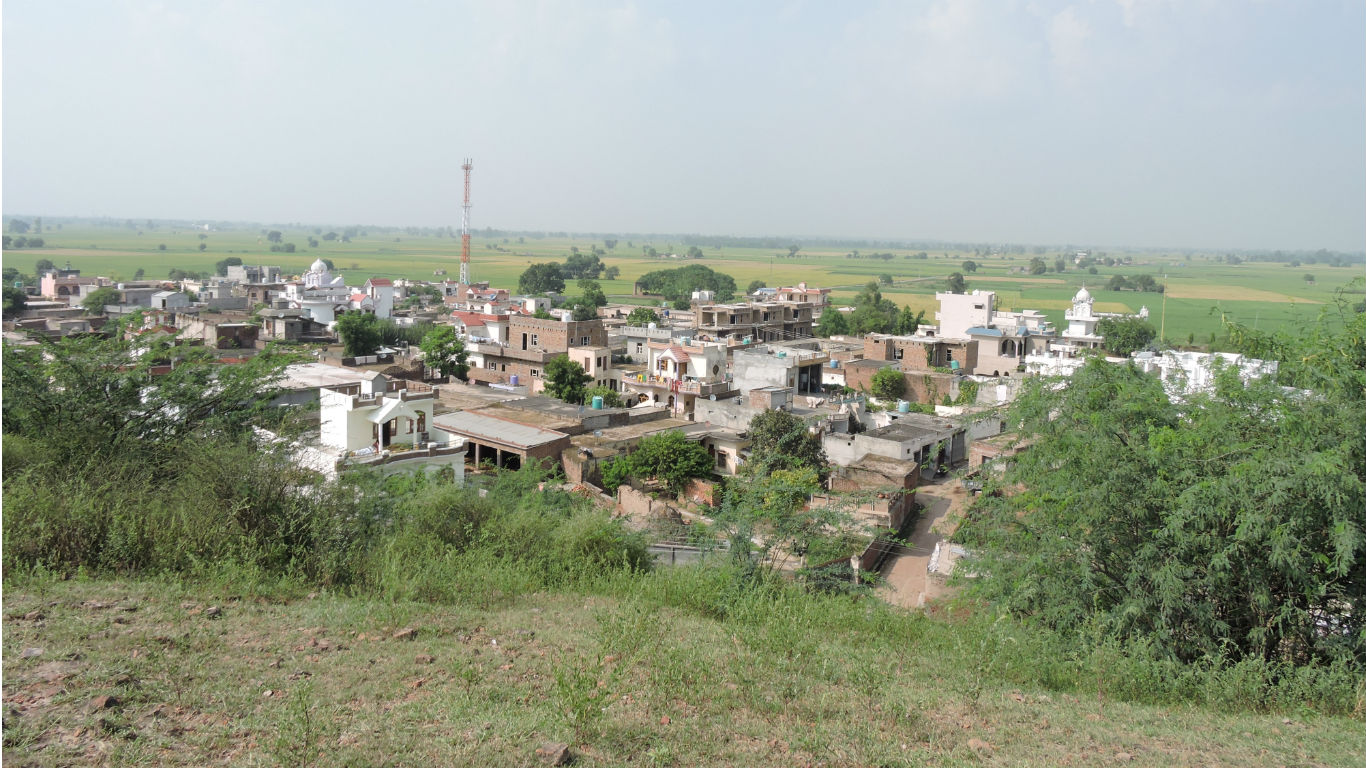
15. Patiala, North India
> Population: 510,000
> Average annual PM2.5 pollution per cubic meter: 101.2 micrograms
> Average annual PM10 pollution per cubic meter: 183.7 micrograms
[in-text-ad-2]
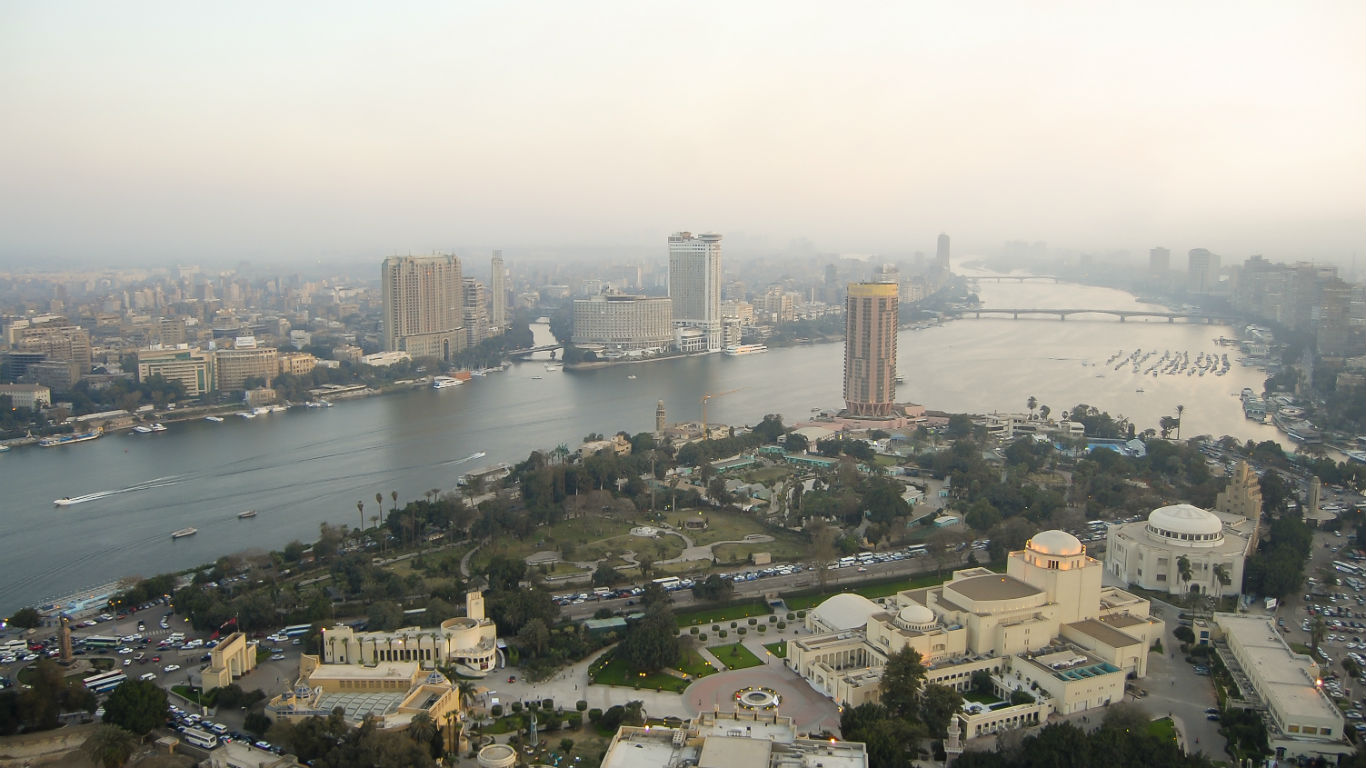
14. Delta Region, Egypt
> Population: 7.9 million
> Average annual PM2.5 pollution per cubic meter: 102.2 micrograms
> Average annual PM10 pollution per cubic meter: 249.0 micrograms
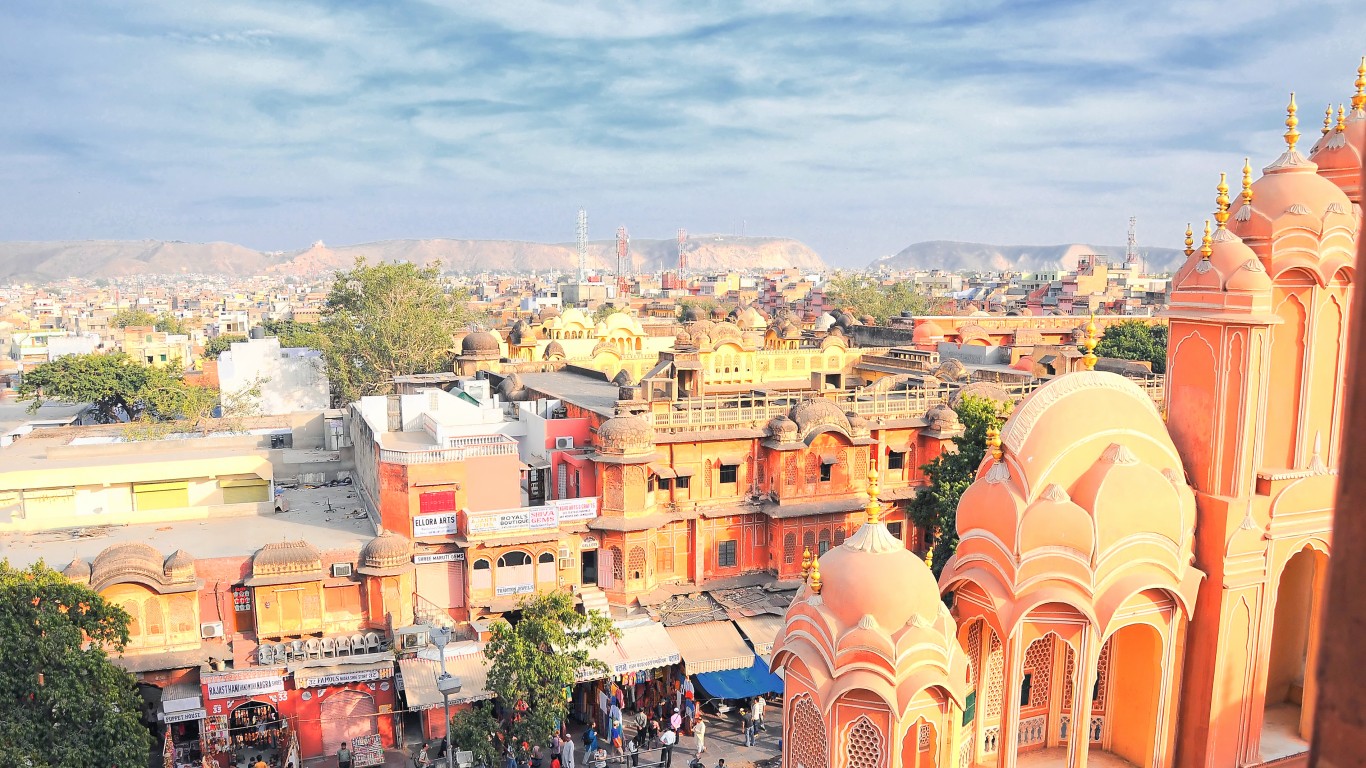
13. Jaipur, West India
> Population: 3.5 million
> Average annual PM2.5 pollution per cubic meter: 104.6 micrograms
> Average annual PM10 pollution per cubic meter: 192.6 micrograms
[in-text-ad]
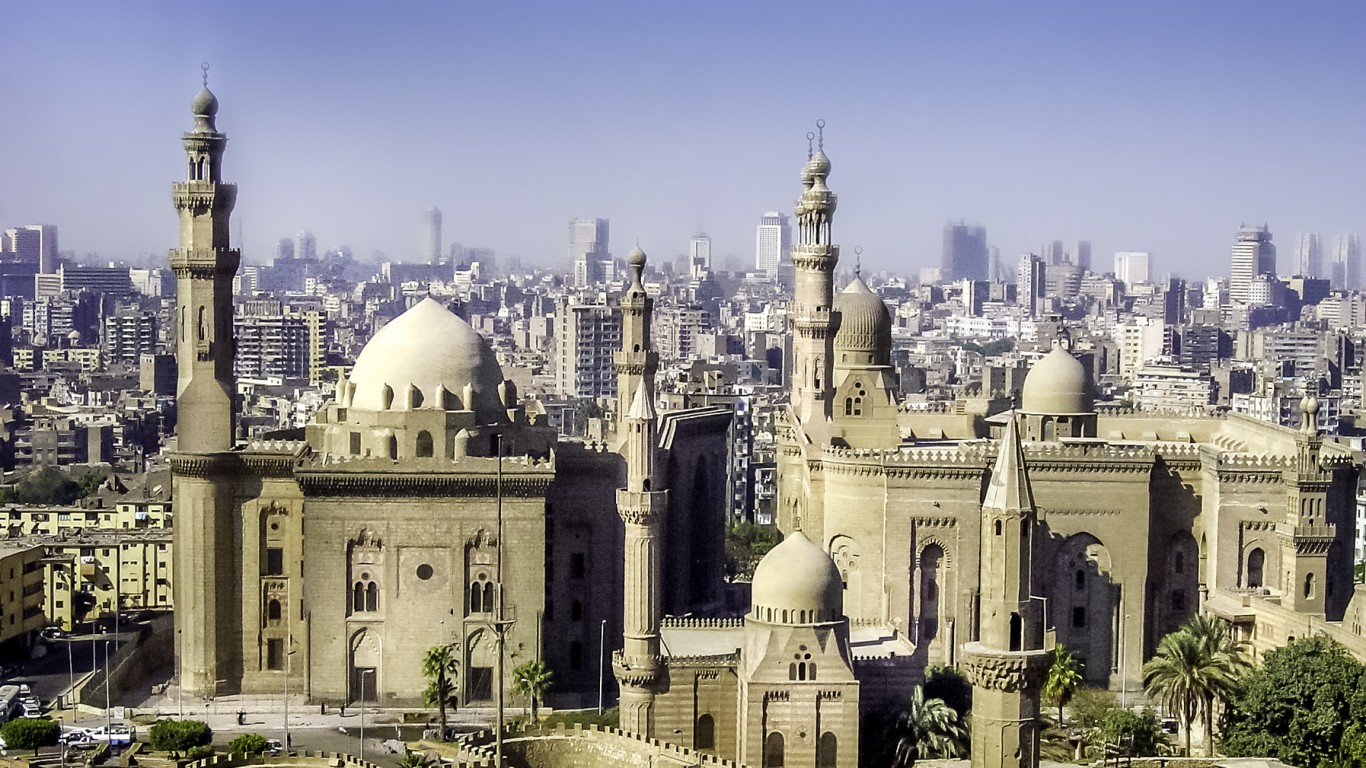
12. Greater Cairo, Egypt
> Population: 18.8 million
> Average annual PM2.5 pollution per cubic meter: 116.6 micrograms
> Average annual PM10 pollution per cubic meter: 284.0 micrograms
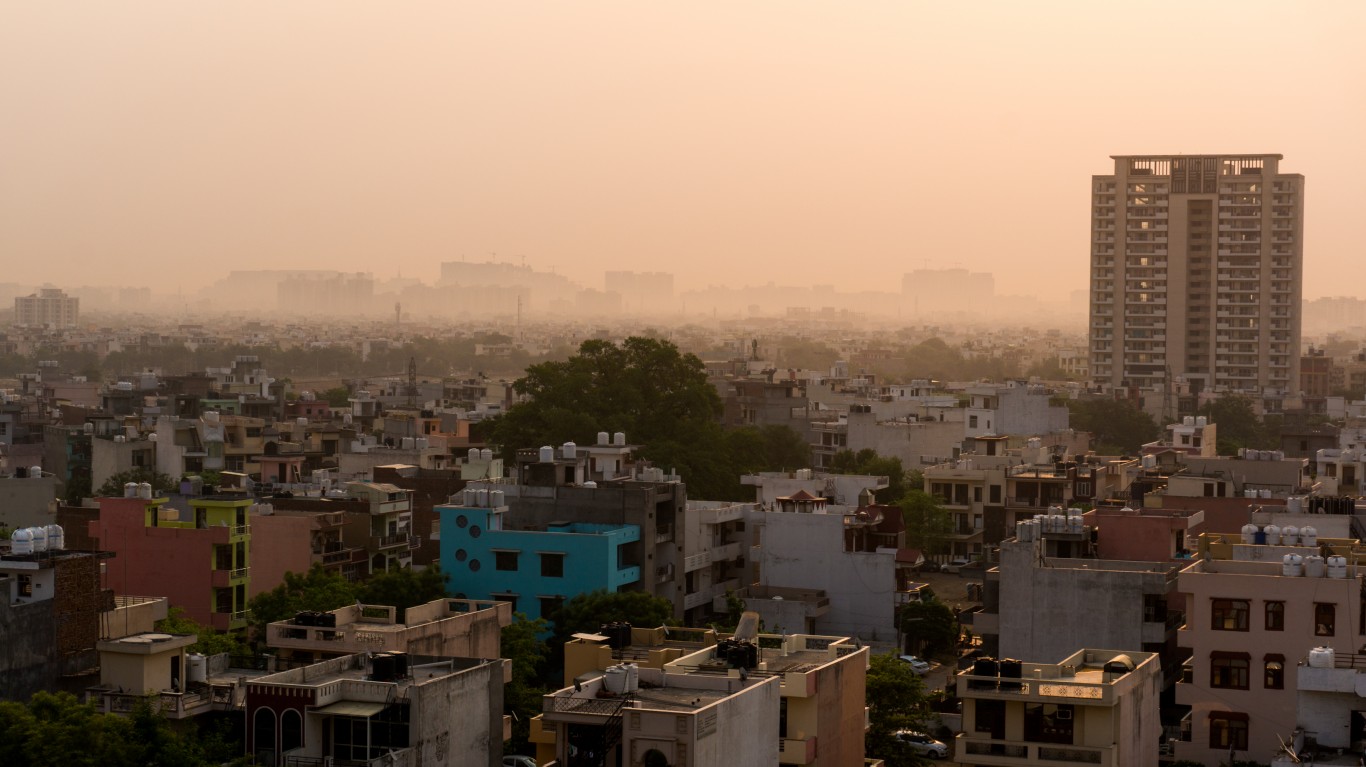
11. Gurgaon, North India
> Population: 902,000
> Average annual PM2.5 pollution per cubic meter: 119.6 micrograms
> Average annual PM10 pollution per cubic meter: 124.3 micrograms
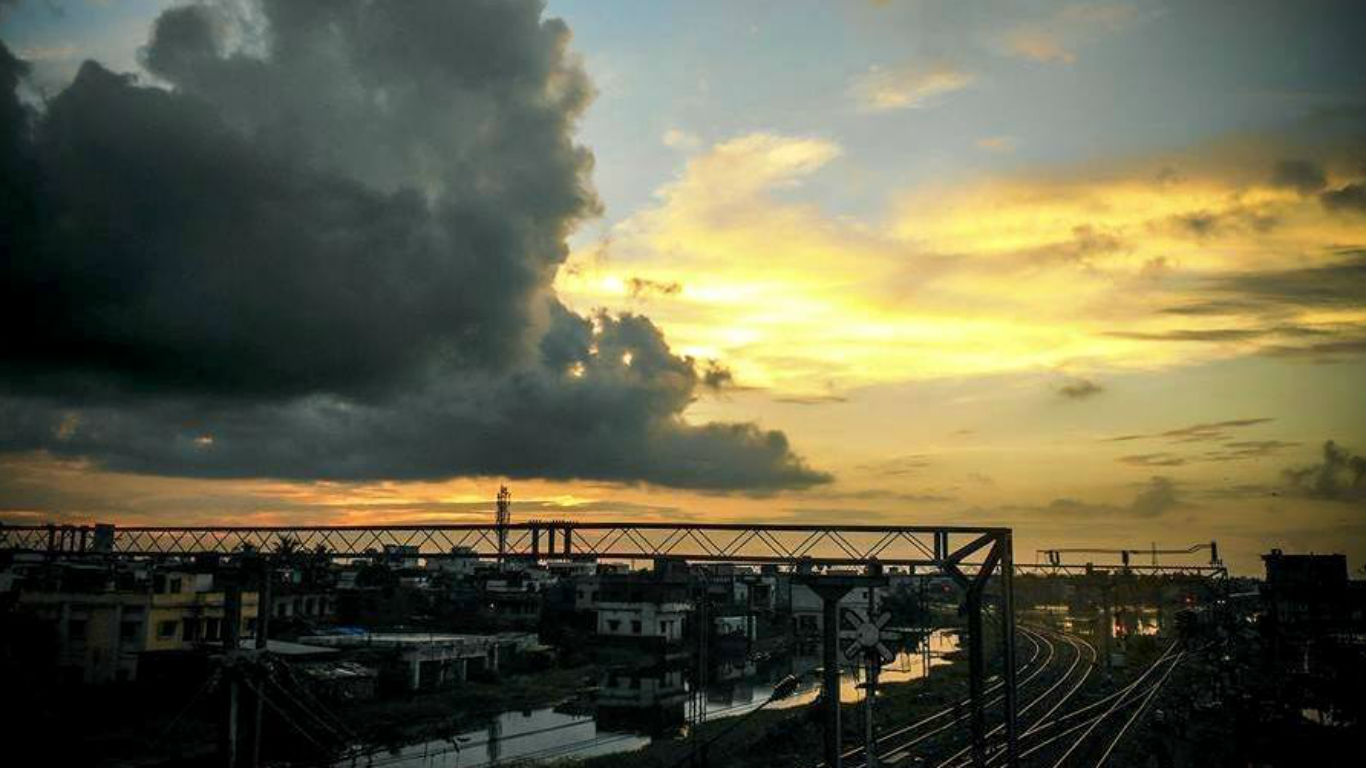
10. Muzaffarpur, East India
> Population: 439,000
> Average annual PM2.5 pollution per cubic meter: 120.0 micrograms
> Average annual PM10 pollution per cubic meter: 220.9 micrograms
[in-text-ad-2]
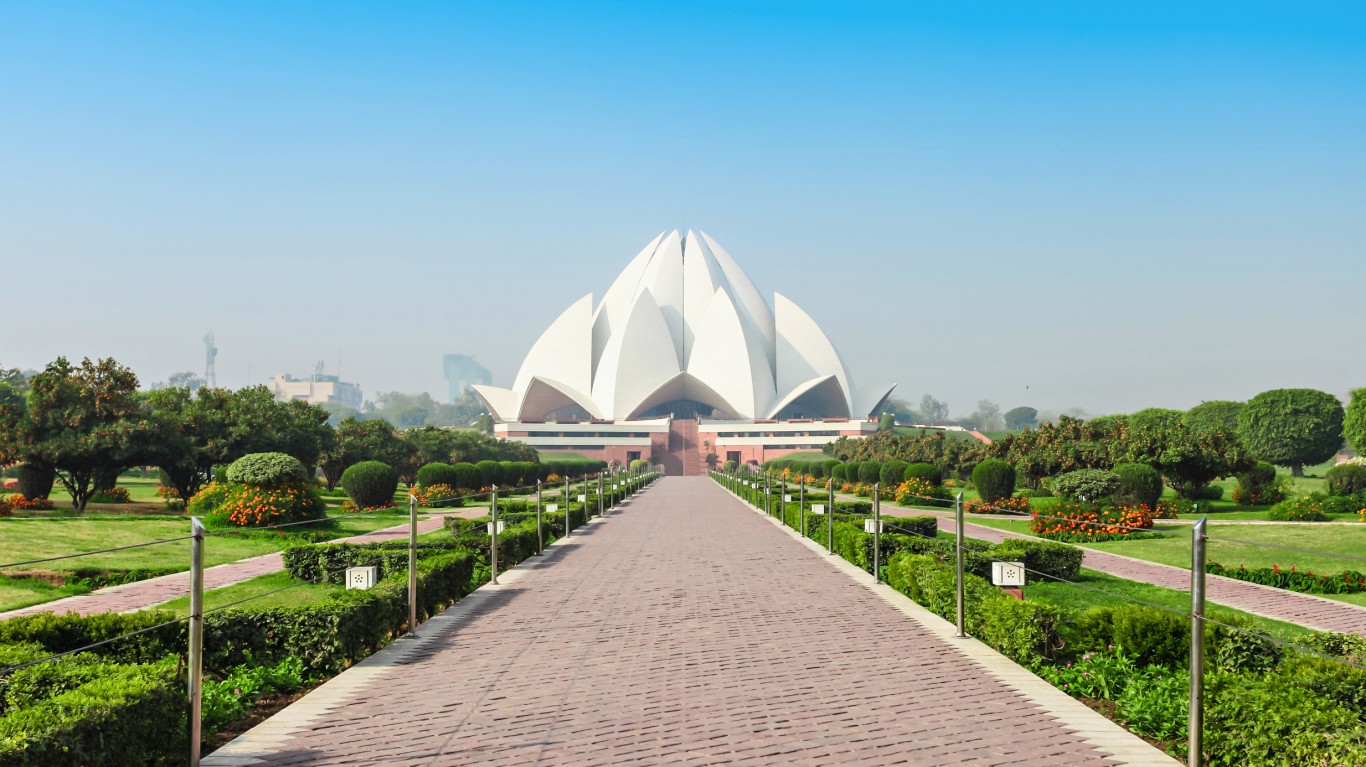
9. Agra, North India
> Population: 2.0 million
> Average annual PM2.5 pollution per cubic meter: 131.4 micrograms
> Average annual PM10 pollution per cubic meter: 194.5 micrograms
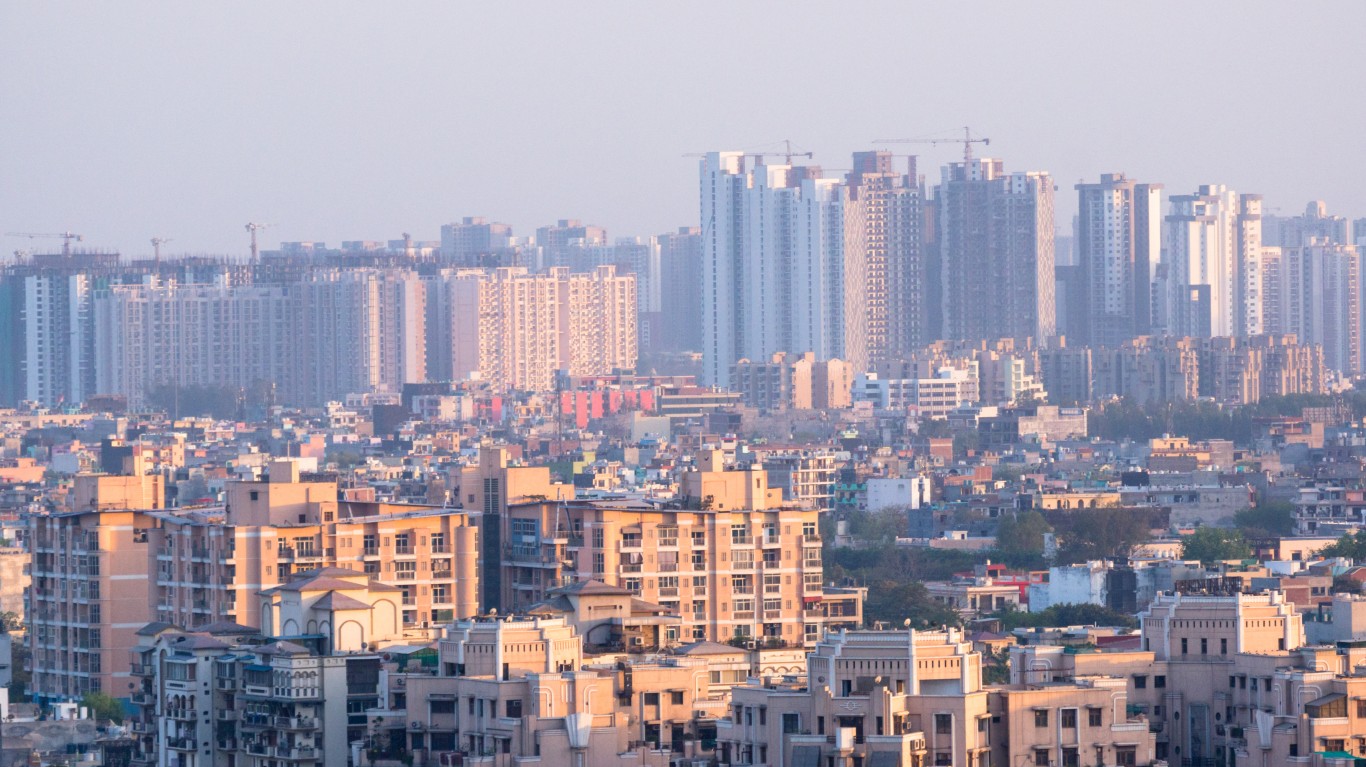
8. Lucknow, North India
> Population: 3.2 million
> Average annual PM2.5 pollution per cubic meter: 138.4 micrograms
> Average annual PM10 pollution per cubic meter: 254.9 micrograms
[in-text-ad]
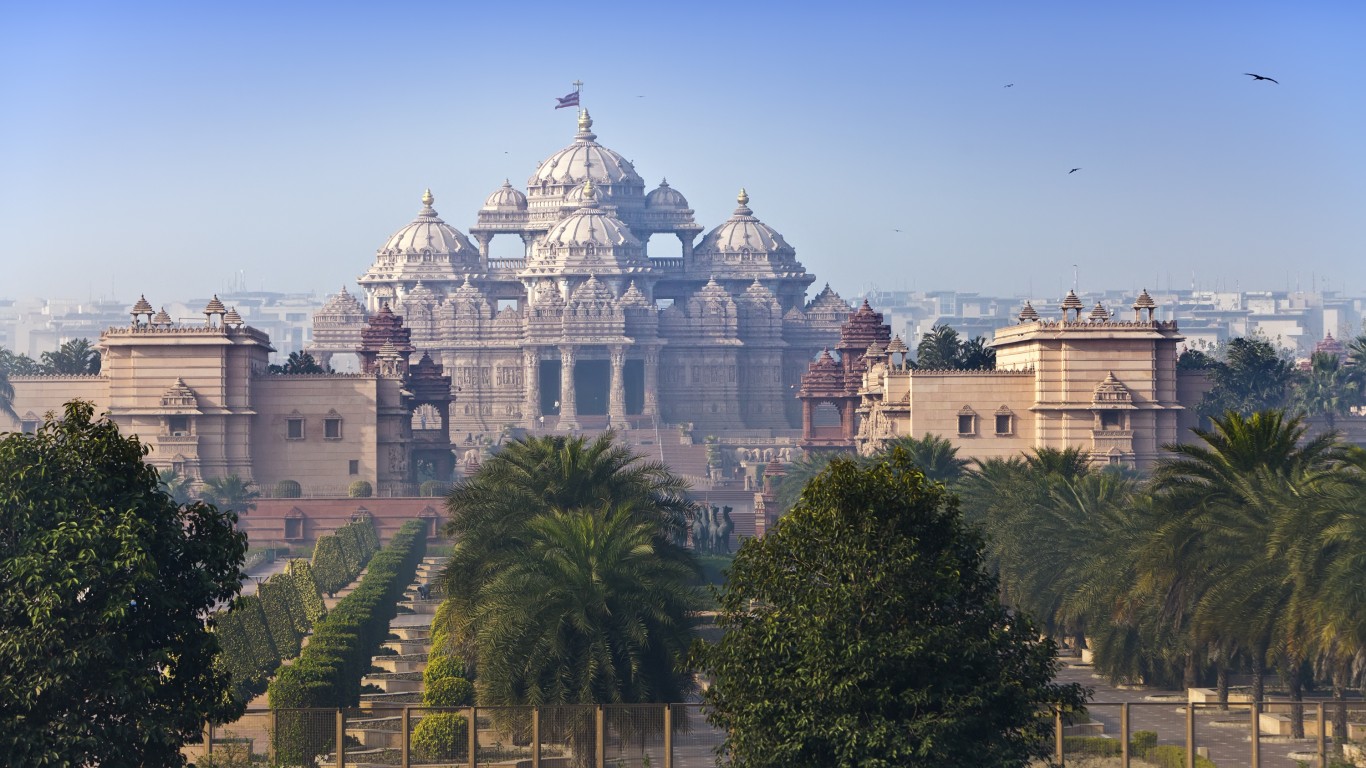
7. Delhi, North India
> Population: 25.7 million
> Average annual PM2.5 pollution per cubic meter: 143.1 micrograms
> Average annual PM10 pollution per cubic meter: 292.3 micrograms
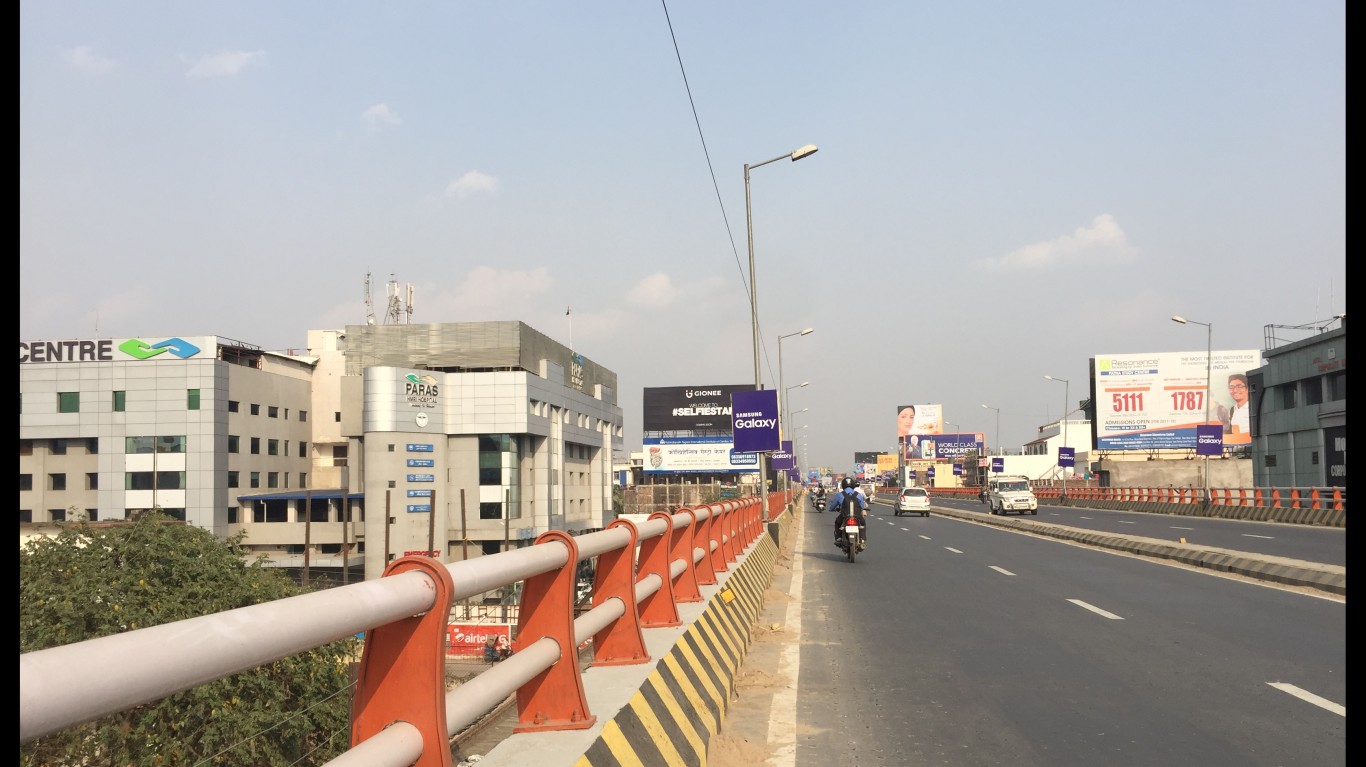
6. Patna, East India
> Population: 2.2 million
> Average annual PM2.5 pollution per cubic meter: 144.3 micrograms
> Average annual PM10 pollution per cubic meter: 265.7 micrograms
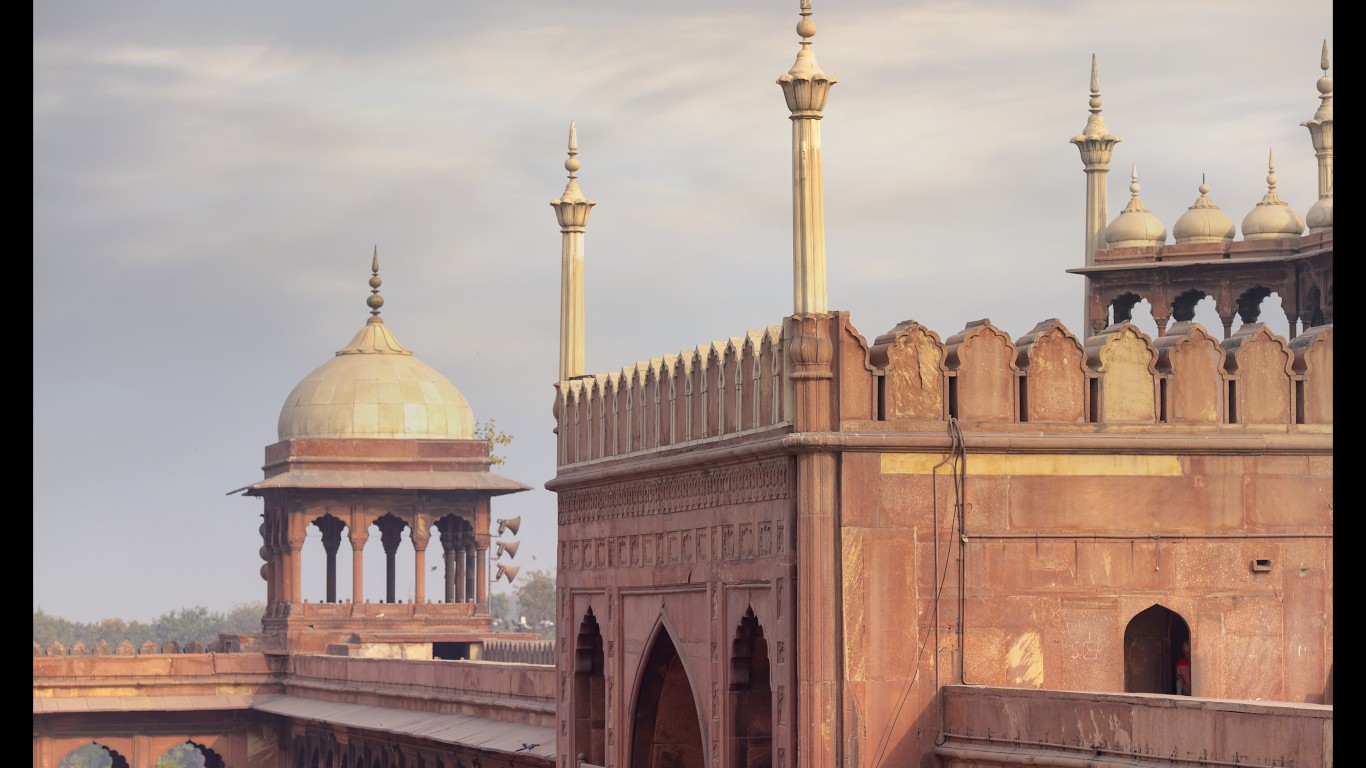
5. Varanasi, North India
> Population: 1.5 million
> Average annual PM2.5 pollution per cubic meter: 146.3 micrograms
> Average annual PM10 pollution per cubic meter: 260.1 micrograms
[in-text-ad-2]
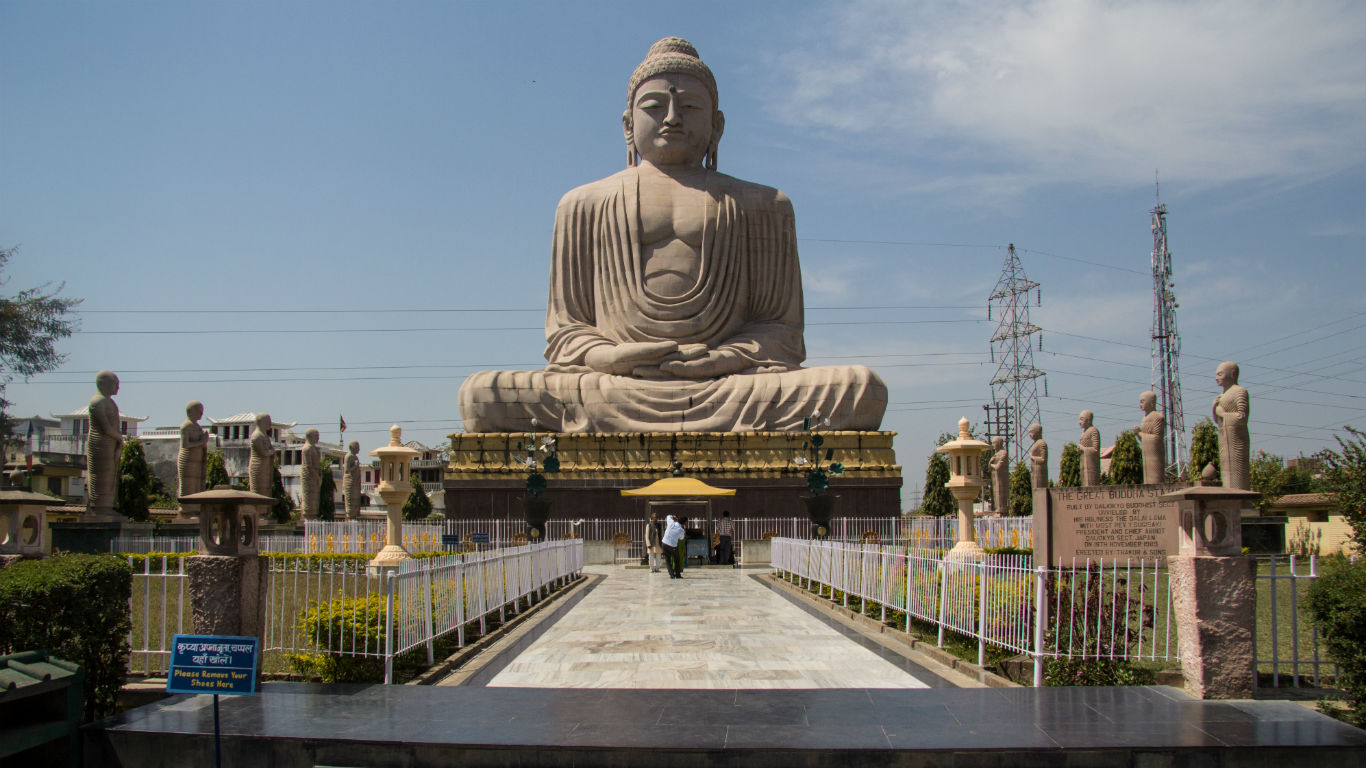
4. Gaya, East India
> Population: 508,000
> Average annual PM2.5 pollution per cubic meter: 149.1 micrograms
> Average annual PM10 pollution per cubic meter: 274.6 micrograms
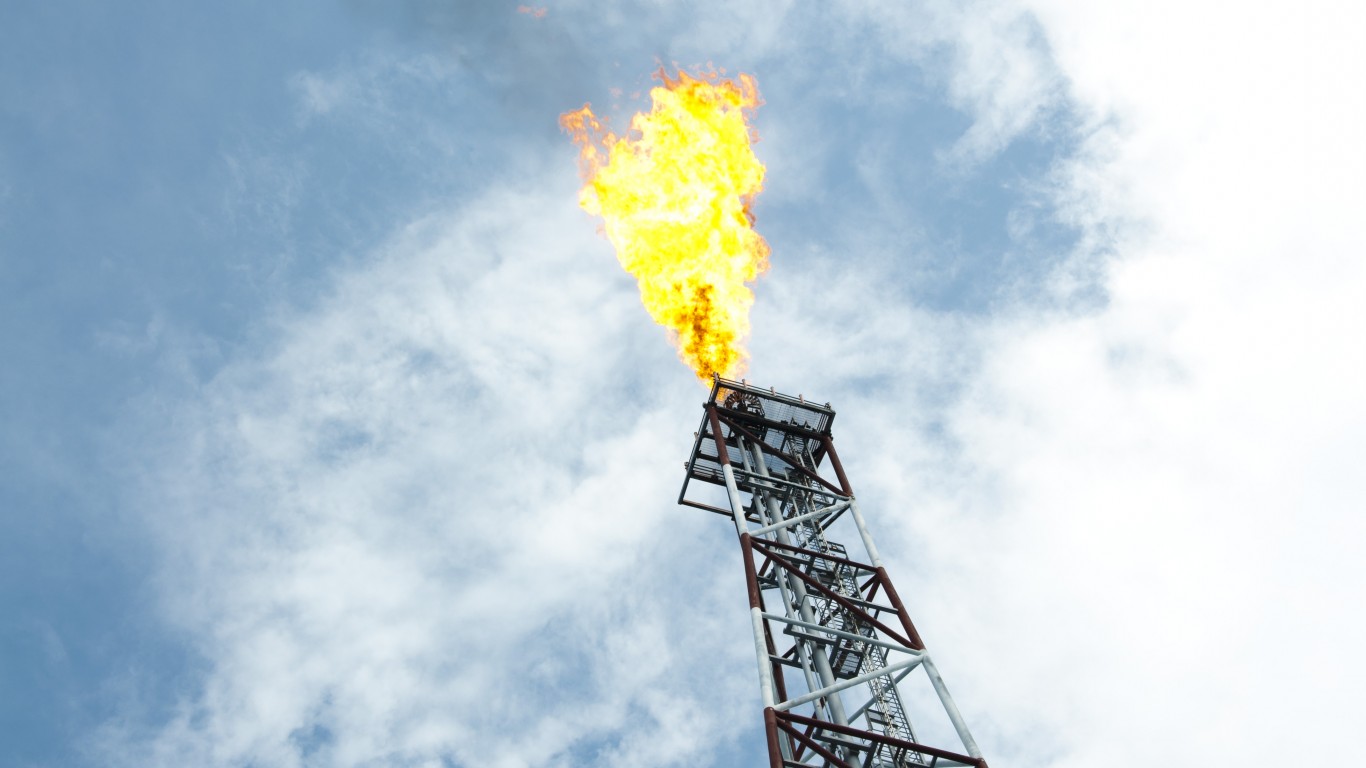
3. Pasakha, Bhutan
> Population: 20,000
> Average annual PM2.5 pollution per cubic meter: 149.9 micrograms
> Average annual PM10 pollution per cubic meter: 275.0 micrograms
[in-text-ad]
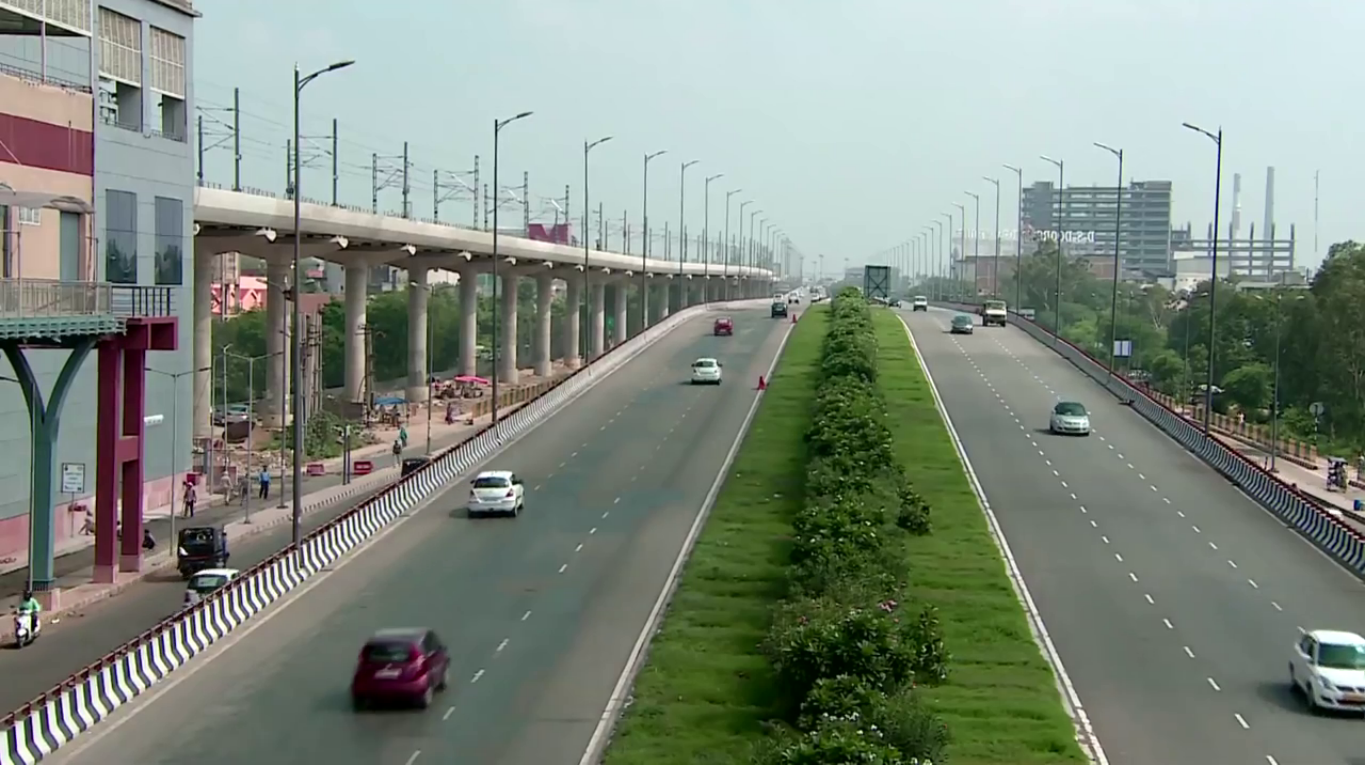
2. Faridabad, North India
> Population: 1.8 million
> Average annual PM2.5 pollution per cubic meter: 171.5 micrograms
> Average annual PM10 pollution per cubic meter: 315.9 micrograms

1. Kanpur, North India
> Population: 3.0 million
> Average annual PM2.5 pollution per cubic meter: 173.0 micrograms
> Average annual PM10 pollution per cubic meter: 318.5 micrograms
In 20 Years, I Haven’t Seen A Cash Back Card This Good
After two decades of reviewing financial products I haven’t seen anything like this. Credit card companies are at war, handing out free rewards and benefits to win the best customers.
A good cash back card can be worth thousands of dollars a year in free money, not to mention other perks like travel, insurance, and access to fancy lounges.
Our top pick today pays up to 5% cash back, a $200 bonus on top, and $0 annual fee. Click here to apply before they stop offering rewards this generous.
Flywheel Publishing has partnered with CardRatings for our coverage of credit card products. Flywheel Publishing and CardRatings may receive a commission from card issuers.
Thank you for reading! Have some feedback for us?
Contact the 24/7 Wall St. editorial team.
 24/7 Wall St.
 24/7 Wall St.
