Special Report
32 Worst Cities to Find a Job for Recent Graduates

Published:
Last Updated:

After finishing college, most graduates strike out on their own, looking for a job where they can apply their recently-earned degree. With a very low U.S. unemployment rate and a record-setting streak of 106 consecutive months of job growth, 2019 might be one of the best years in recent memory for job seekers.
Despite the overall strength of the U.S. job market, entry-level jobs for college graduates cannot be found everywhere. There are several cities where recent college graduates are much more likely to struggle to find a career in their field.
24/7 Wall St. created an index using data from the U.S. Census Bureau’s American Community Survey and from the U.S. Bureau of Labor Statistics Quarterly Workforce Indicators to determine the worst cities to find a job for recent college graduates. The index consists of three components: job growth for young workers, wages for young workers, and the concentration of jobs in sectors that tend to require a college education in U.S. metropolitan statistical areas.
Many of the worst cities for recent college grads are located in states with challenging economic conditions. Certain states have few full-time jobs available, and these jobs are often filled by people with work experience in the field — something recent college grads usually do not have. These are the states where it is hardest to find full-time work.
There is a big difference between having a job and having a good job. If young adults take a low-paying job, it can set them back for years by preventing them from saving their money and becoming more financially secure with time. Even if they are hired in their desired field, that is no guarantee they will be financially secure. Many college grads earn relatively little, sometimes less than $40,000 per year–or roughly $20,000 less than that of the typical worker with a bachelor’s degree. These are the worst paying jobs for college graduates.
Click here to see the 32 worst cities to find a job for recent graduates
Click here to read our methodology

32. Daphne-Fairhope-Foley, AL
> Professional and administrative employment: 8.5% of total employment (lowest 10%)
> Avg. monthly wage, 22-24 year olds: $1,861 (lowest 20%)
> Poverty: 9.4% (lowest 20%)
> June 2019 unemployment: 2.9% (lowest 20%)
> Adults with at least a bachelor’s degree: 33.6%
[in-text-ad]

31. Punta Gorda, FL
> Professional and administrative employment: 7.1% of total employment (lowest 10%)
> Avg. monthly wage, 22-24 year olds: $2,054
> Poverty: 10.1% (lowest 20%)
> June 2019 unemployment: 4.0%
> Adults with at least a bachelor’s degree: 23.6%

30. Flagstaff, AZ
> Professional and administrative employment: 9.1% of total employment (lowest 20%)
> Avg. monthly wage, 22-24 year olds: $1,947 (lowest 20%)
> Poverty: 19.0% (highest 20%)
> June 2019 unemployment: 6.1% (highest 10%)
> Adults with at least a bachelor’s degree: 37.3% (highest 20%)
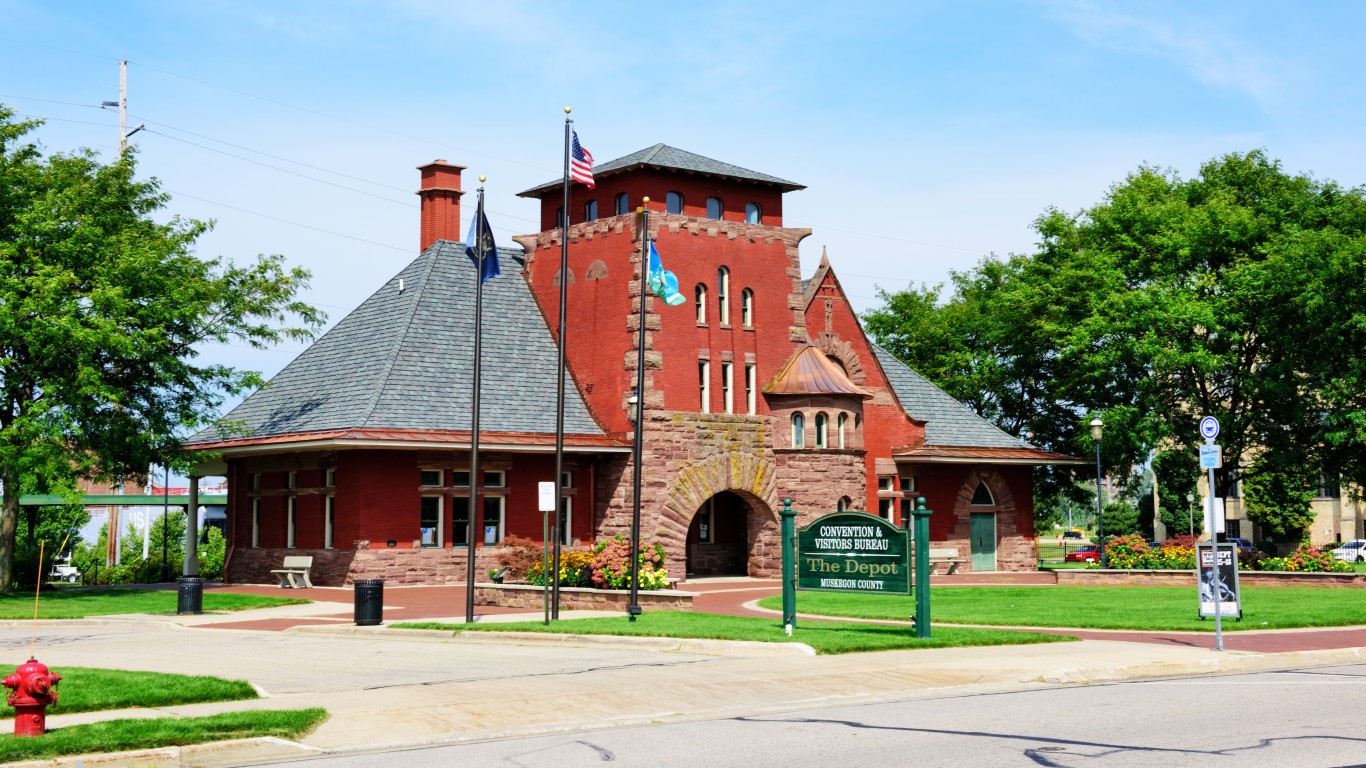
29. Muskegon, MI
> Professional and administrative employment: 5.9% of total employment (lowest 10%)
> Avg. monthly wage, 22-24 year olds: $2,195
> Poverty: 15.0%
> June 2019 unemployment: 4.6%
> Adults with at least a bachelor’s degree: 19.4% (lowest 20%)
[in-text-ad-2]

28. Missoula, MT
> Professional and administrative employment: 12.2% of total employment
> Avg. monthly wage, 22-24 year olds: $1,687 (lowest 10%)
> Poverty: 15.4%
> June 2019 unemployment: 2.8% (lowest 20%)
> Adults with at least a bachelor’s degree: 46.0% (highest 10%)
27. Florence, SC
> Professional and administrative employment: 9.9% of total employment (lowest 20%)
> Avg. monthly wage, 22-24 year olds: $1,914 (lowest 20%)
> Poverty: 19.3% (highest 20%)
> June 2019 unemployment: 4.0%
> Adults with at least a bachelor’s degree: 24.1%
[in-text-ad]

26. Saginaw, MI
> Professional and administrative employment: 7.9% of total employment (lowest 10%)
> Avg. monthly wage, 22-24 year olds: $2,001
> Poverty: 17.4%
> June 2019 unemployment: 5.1% (highest 20%)
> Adults with at least a bachelor’s degree: 20.4% (lowest 20%)

25. Atlantic City-Hammonton, NJ
> Professional and administrative employment: 9.4% of total employment (lowest 20%)
> Avg. monthly wage, 22-24 year olds: $1,866 (lowest 20%)
> Poverty: 14.8%
> June 2019 unemployment: 4.0%
> Adults with at least a bachelor’s degree: 28.4%
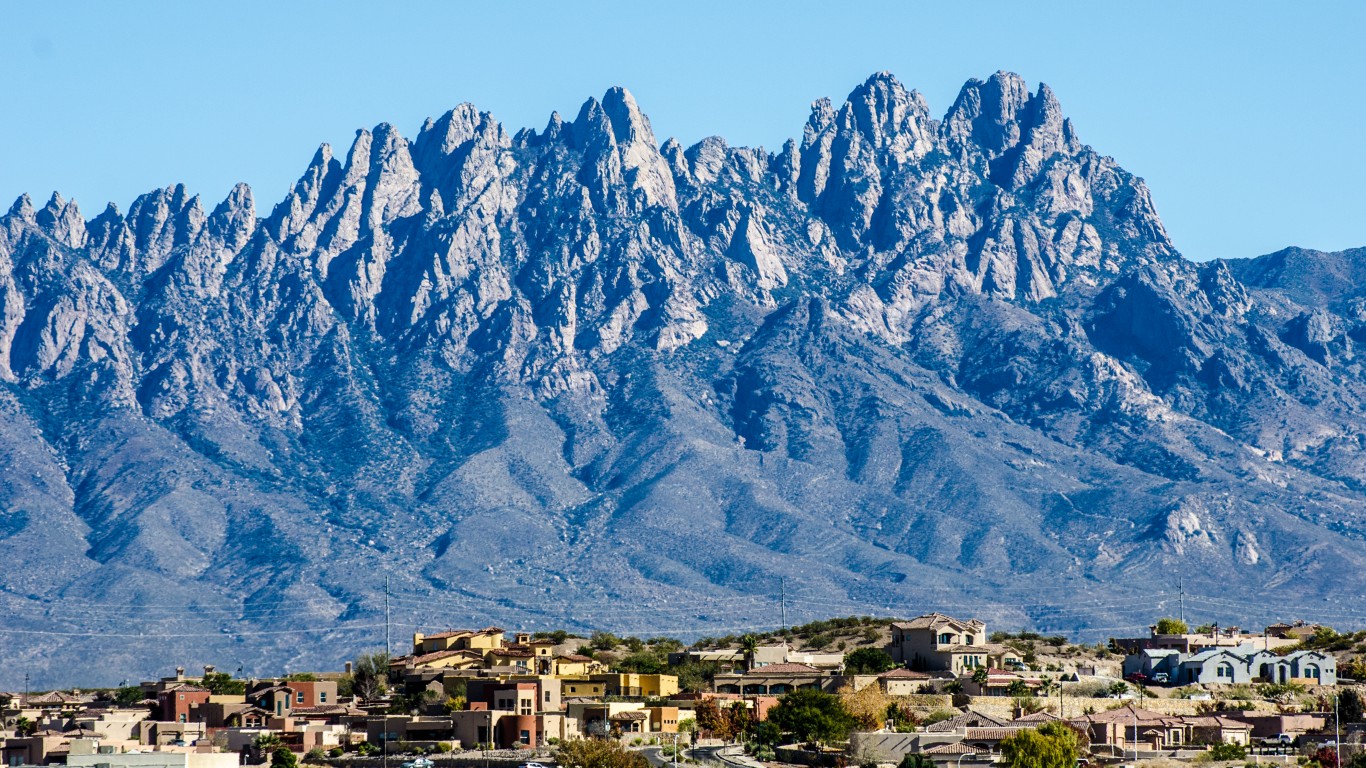
24. Las Cruces, NM
> Professional and administrative employment: 12.8% of total employment
> Avg. monthly wage, 22-24 year olds: $1,713 (lowest 10%)
> Poverty: 28.1% (highest 10%)
> June 2019 unemployment: 6.3% (highest 10%)
> Adults with at least a bachelor’s degree: 24.9%
[in-text-ad-2]
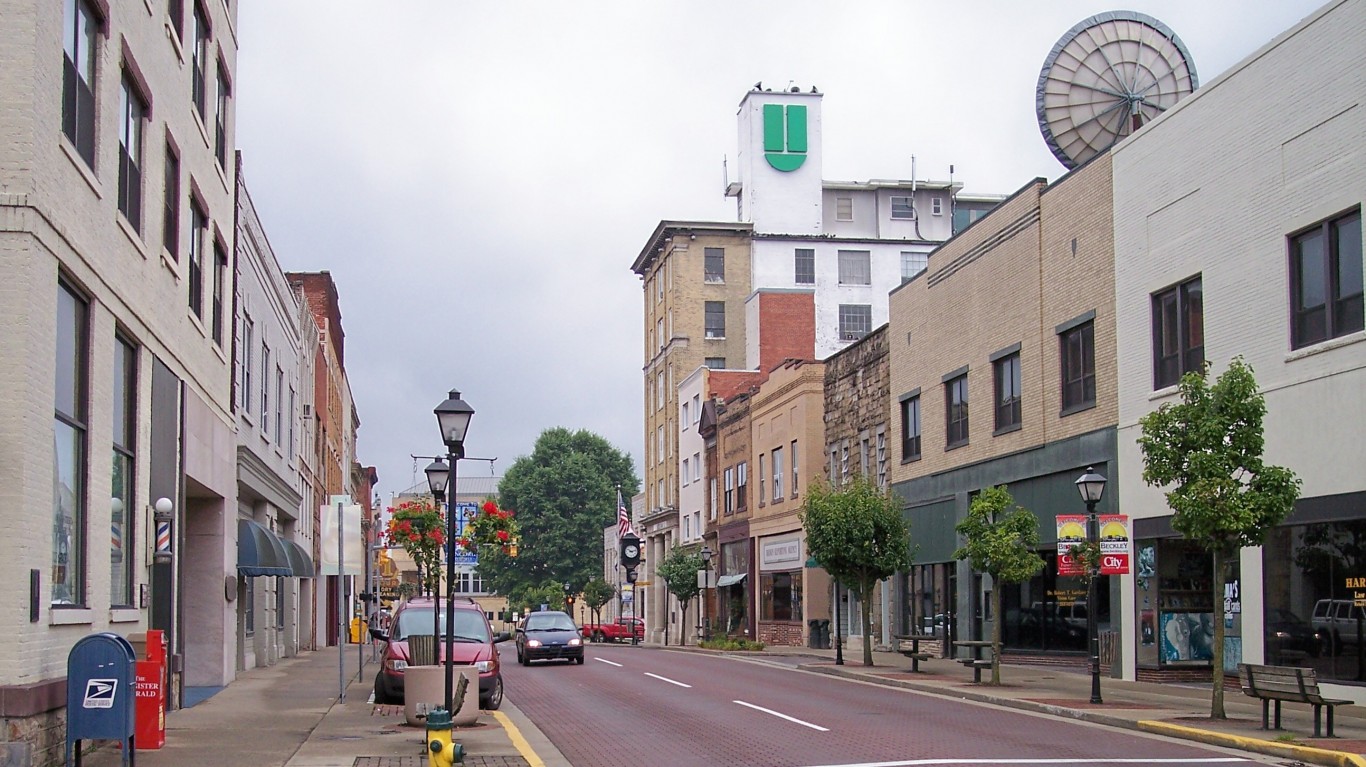
23. Beckley, WV
> Professional and administrative employment: 6.4% of total employment (lowest 10%)
> Avg. monthly wage, 22-24 year olds: $2,040
> Poverty: 20.0% (highest 10%)
> June 2019 unemployment: 5.0% (highest 20%)
> Adults with at least a bachelor’s degree: 19.2% (lowest 20%)

22. Sebring, FL
> Professional and administrative employment: 9.9% of total employment (lowest 20%)
> Avg. monthly wage, 22-24 year olds: $1,865 (lowest 20%)
> Poverty: 20.2% (highest 10%)
> June 2019 unemployment: 5.1% (highest 20%)
> Adults with at least a bachelor’s degree: 17.8% (lowest 10%)
[in-text-ad]
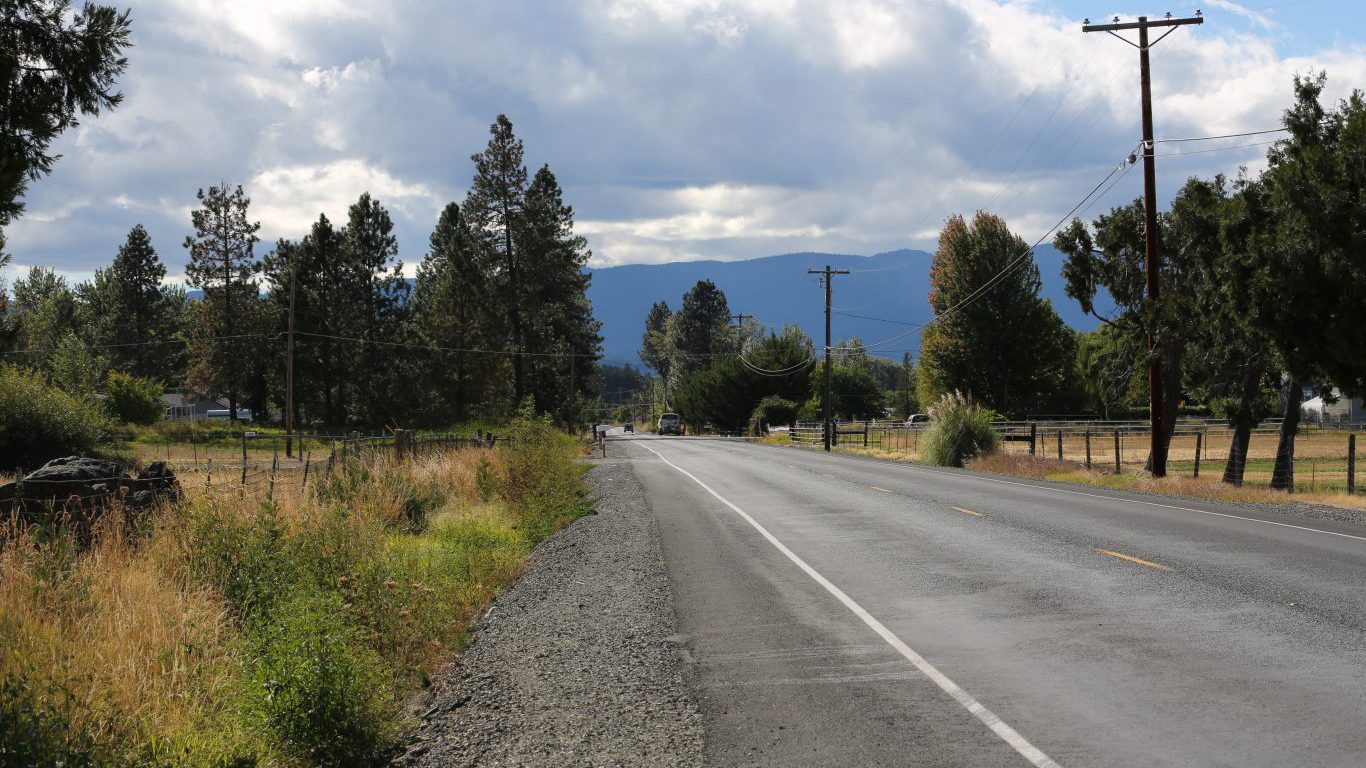
21. Grants Pass, OR
> Professional and administrative employment: 8.3% of total employment (lowest 10%)
> Avg. monthly wage, 22-24 year olds: $1,897 (lowest 20%)
> Poverty: 17.4%
> June 2019 unemployment: 5.1% (highest 20%)
> Adults with at least a bachelor’s degree: 18.9% (lowest 20%)
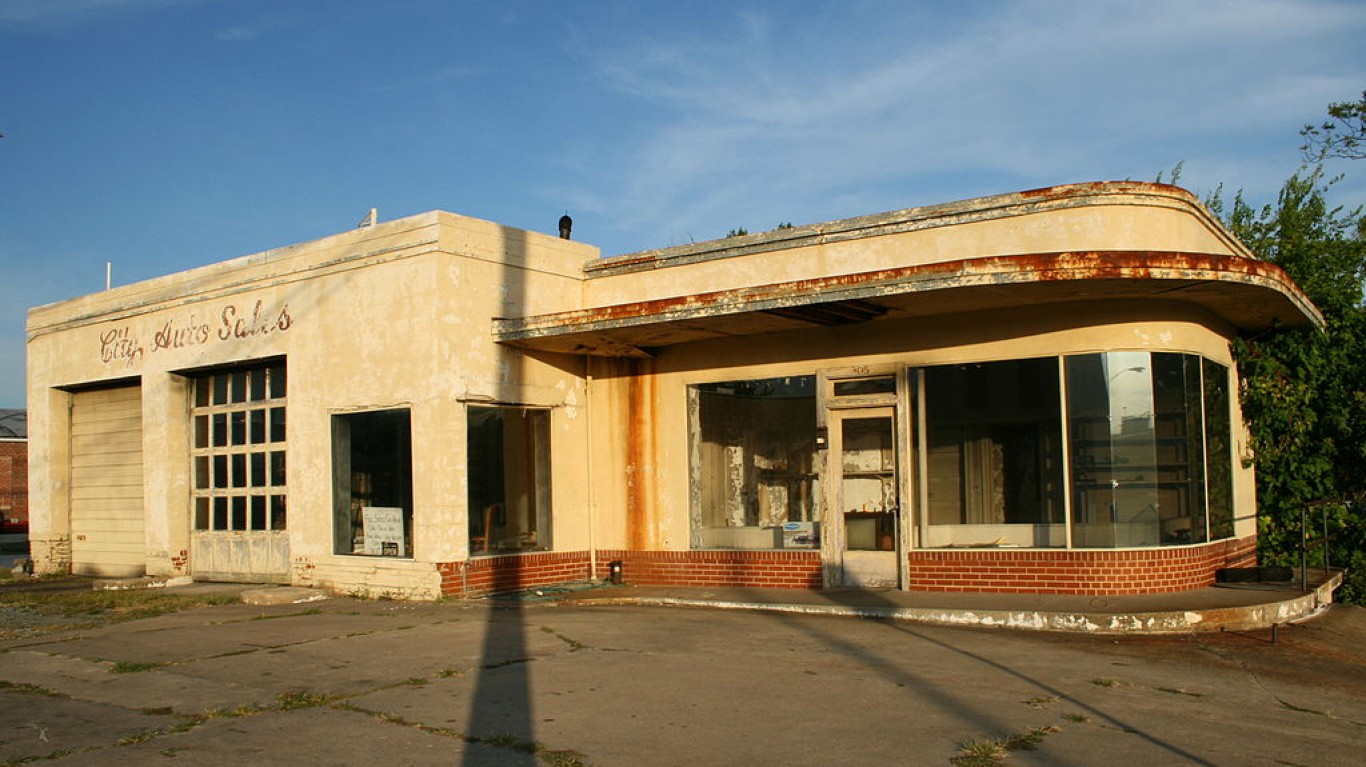
20. Burlington, NC
> Professional and administrative employment: 9.9% of total employment (lowest 20%)
> Avg. monthly wage, 22-24 year olds: $1,887 (lowest 20%)
> Poverty: 14.4%
> June 2019 unemployment: 4.4%
> Adults with at least a bachelor’s degree: 23.4%

19. Youngstown-Warren-Boardman, OH-PA
> Professional and administrative employment: 8.0% of total employment (lowest 10%)
> Avg. monthly wage, 22-24 year olds: $1,827 (lowest 10%)
> Poverty: 15.9%
> June 2019 unemployment: 5.6% (highest 10%)
> Adults with at least a bachelor’s degree: 21.5%
[in-text-ad-2]

18. Warner Robins, GA
> Professional and administrative employment: 10.1% of total employment (lowest 20%)
> Avg. monthly wage, 22-24 year olds: $1,836 (lowest 10%)
> Poverty: 14.1%
> June 2019 unemployment: 3.9%
> Adults with at least a bachelor’s degree: 27.7%

17. Florence-Muscle Shoals, AL
> Professional and administrative employment: 8.3% of total employment (lowest 10%)
> Avg. monthly wage, 22-24 year olds: $1,936 (lowest 20%)
> Poverty: 13.7%
> June 2019 unemployment: 4.1%
> Adults with at least a bachelor’s degree: 22.2%
[in-text-ad]
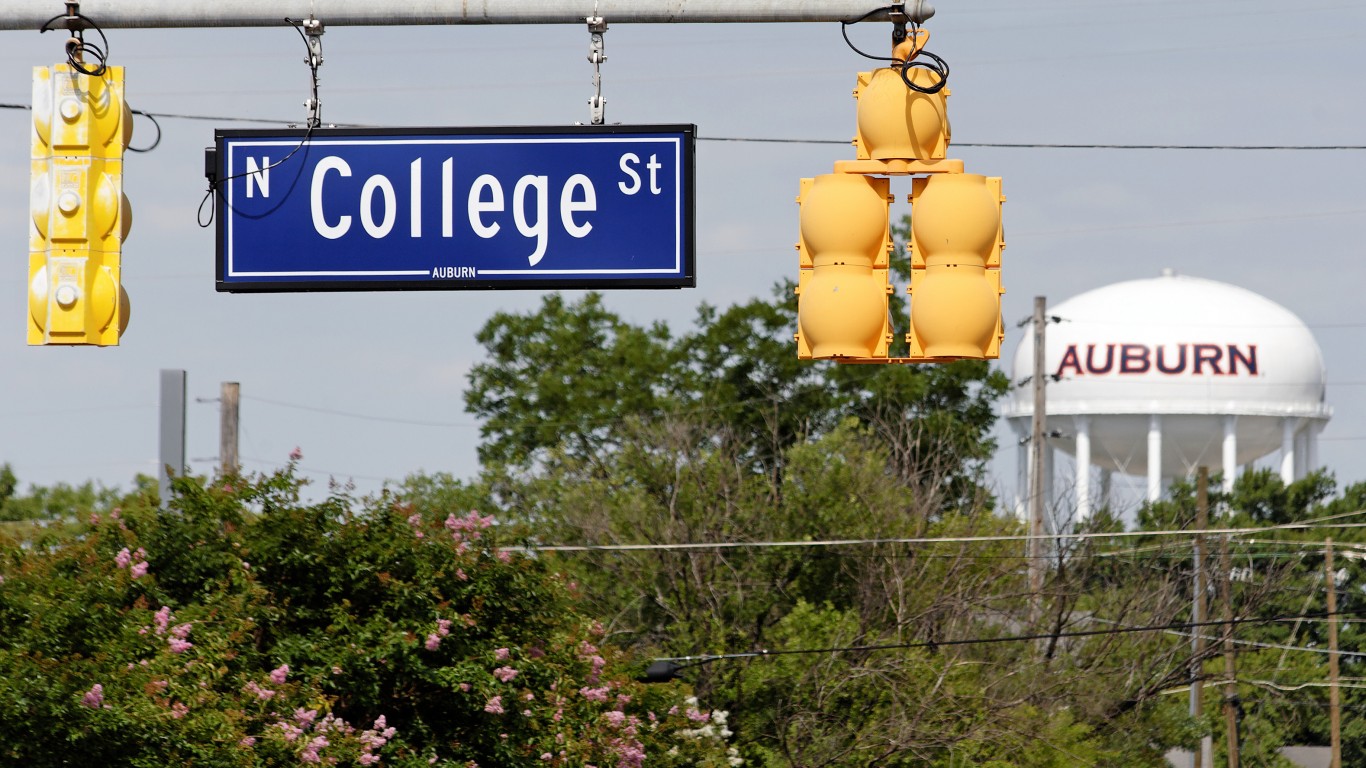
16. Auburn-Opelika, AL
> Professional and administrative employment: 13.5% of total employment
> Avg. monthly wage, 22-24 year olds: $1,648 (lowest 10%)
> Poverty: 19.5% (highest 20%)
> June 2019 unemployment: 3.2%
> Adults with at least a bachelor’s degree: 33.4%
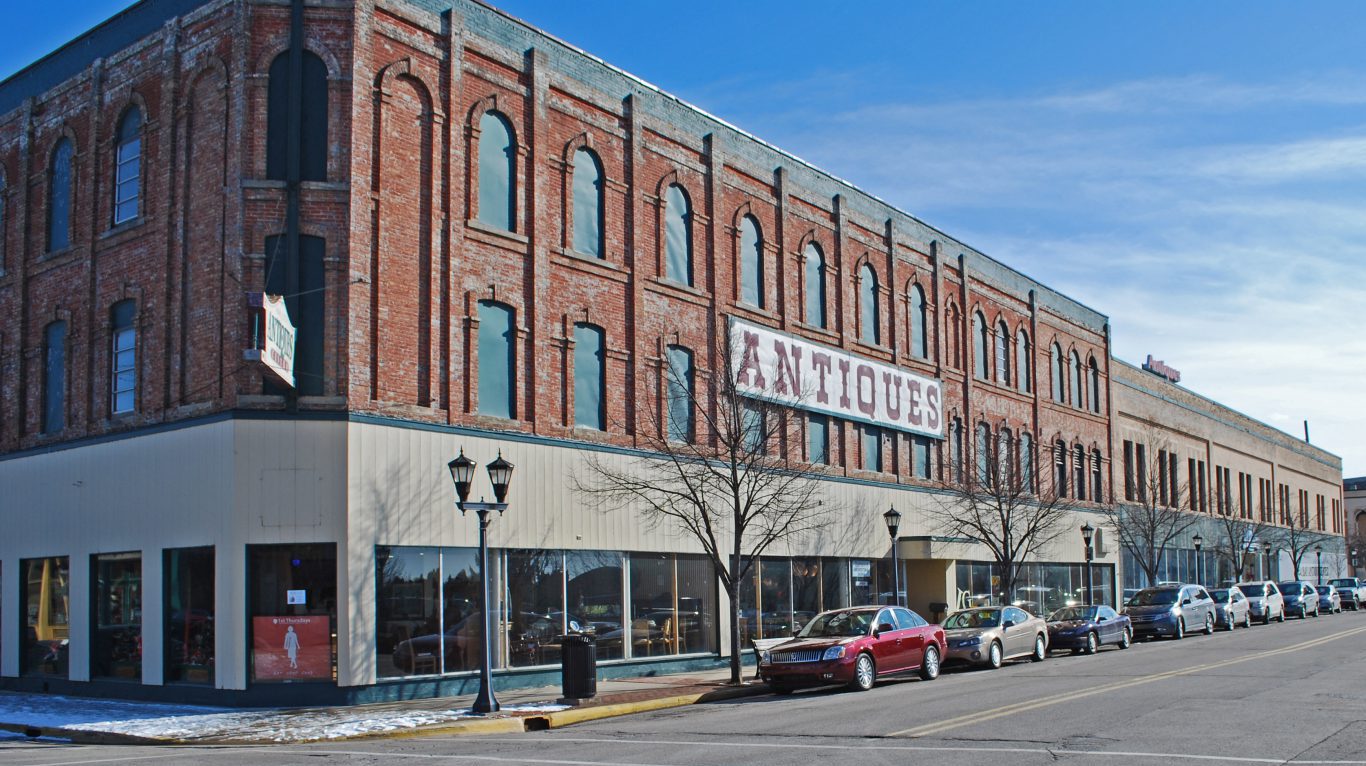
15. Bay City, MI
> Professional and administrative employment: 11.4% of total employment
> Avg. monthly wage, 22-24 year olds: $1,750 (lowest 10%)
> Poverty: 15.1%
> June 2019 unemployment: 5.0% (highest 20%)
> Adults with at least a bachelor’s degree: 21.9%
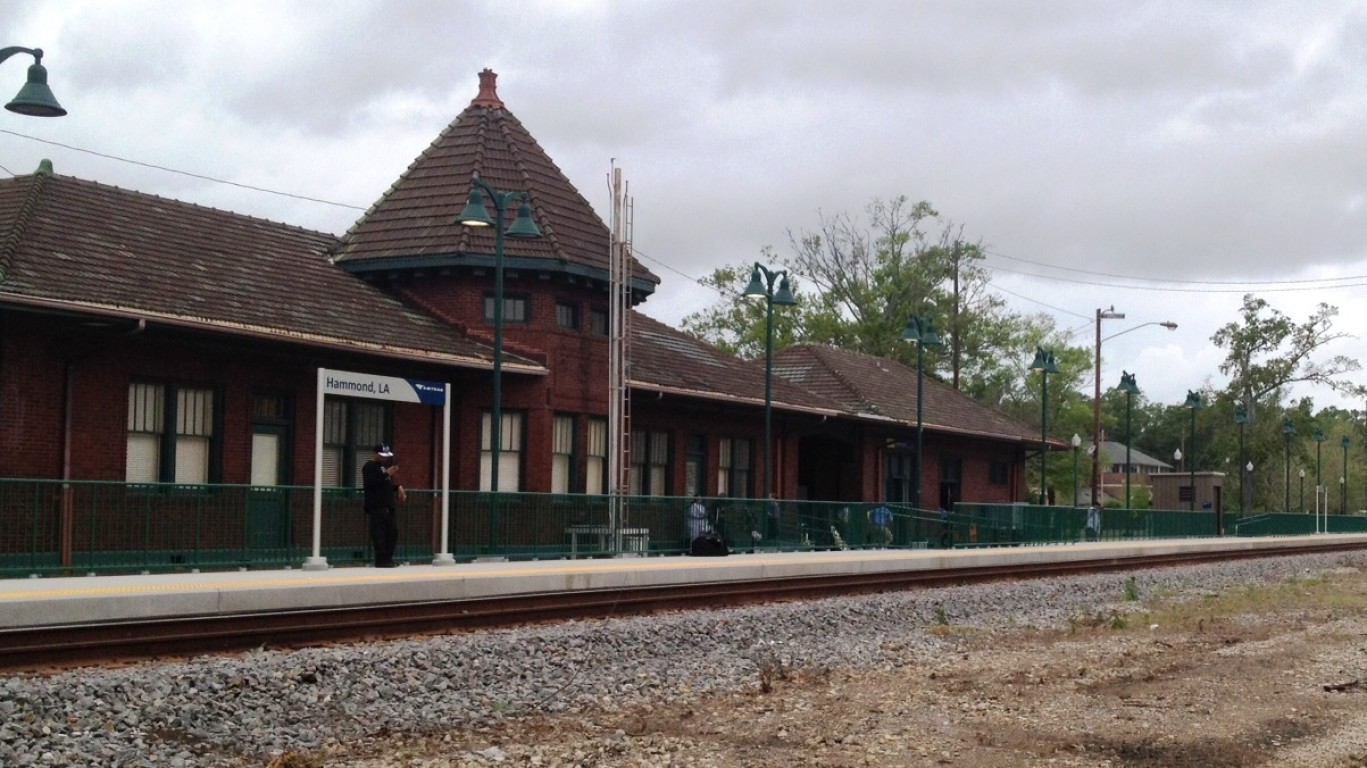
14. Hammond, LA
> Professional and administrative employment: 11.5% of total employment
> Avg. monthly wage, 22-24 year olds: $1,805 (lowest 10%)
> Poverty: 20.7% (highest 10%)
> June 2019 unemployment: 6.2% (highest 10%)
> Adults with at least a bachelor’s degree: 19.1% (lowest 20%)
[in-text-ad-2]
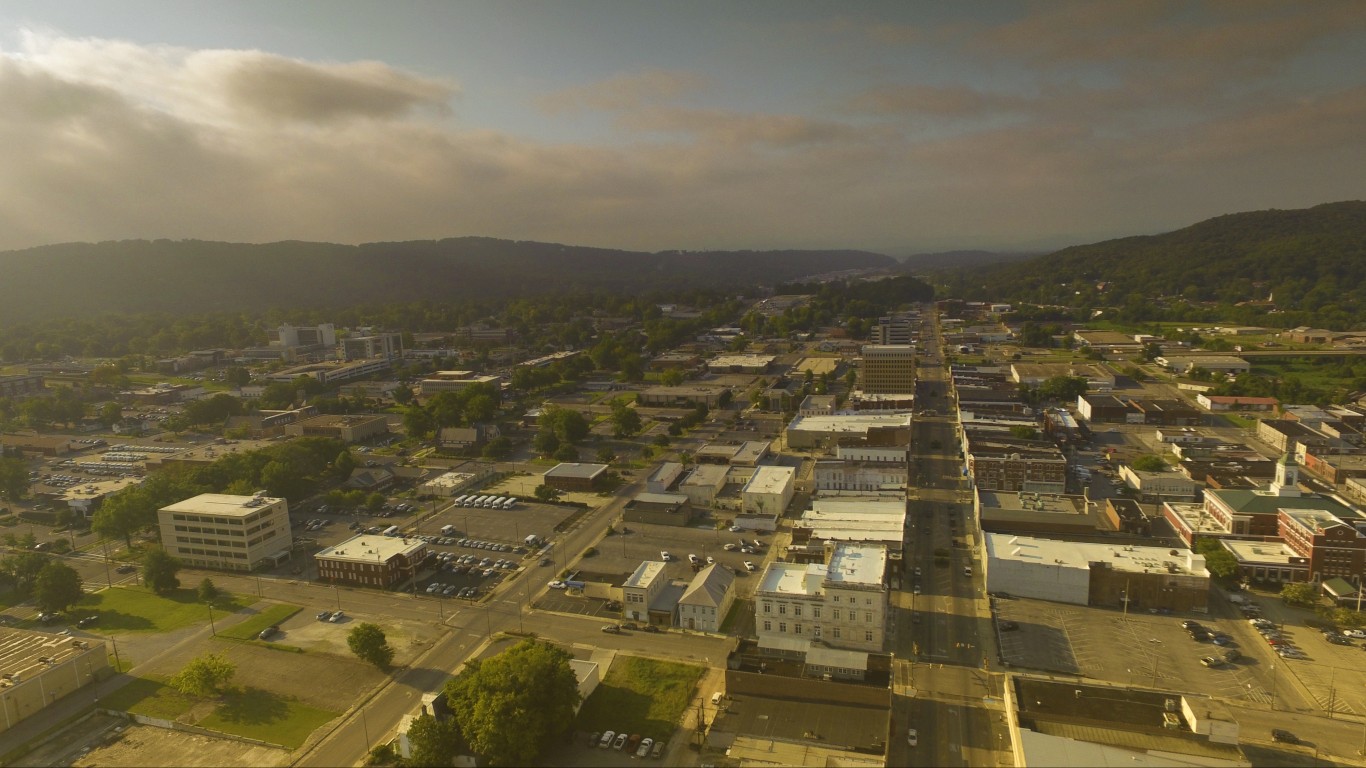
13. Anniston-Oxford-Jacksonville, AL
> Professional and administrative employment: 9.0% of total employment (lowest 10%)
> Avg. monthly wage, 22-24 year olds: $1,938 (lowest 20%)
> Poverty: 17.7%
> June 2019 unemployment: 4.1%
> Adults with at least a bachelor’s degree: 19.3% (lowest 20%)

12. Hot Springs, AR
> Professional and administrative employment: 7.1% of total employment (lowest 10%)
> Avg. monthly wage, 22-24 year olds: $1,843 (lowest 10%)
> Poverty: 15.1%
> June 2019 unemployment: 3.8%
> Adults with at least a bachelor’s degree: 19.5% (lowest 20%)
[in-text-ad]

11. Sumter, SC
> Professional and administrative employment: 6.6% of total employment (lowest 10%)
> Avg. monthly wage, 22-24 year olds: $2,033
> Poverty: 18.8% (highest 20%)
> June 2019 unemployment: 4.2%
> Adults with at least a bachelor’s degree: 19.6% (lowest 20%)

10. Ocean City, NJ
> Professional and administrative employment: 10.7% of total employment
> Avg. monthly wage, 22-24 year olds: $1,587 (lowest 10%)
> Poverty: 9.7% (lowest 20%)
> June 2019 unemployment: 3.8%
> Adults with at least a bachelor’s degree: 33.5%

9. Dothan, AL
> Professional and administrative employment: 8.2% of total employment (lowest 10%)
> Avg. monthly wage, 22-24 year olds: $1,914 (lowest 20%)
> Poverty: 17.5%
> June 2019 unemployment: 3.6%
> Adults with at least a bachelor’s degree: 20.2% (lowest 20%)
[in-text-ad-2]

8. Brunswick, GA
> Professional and administrative employment: 7.9% of total employment (lowest 10%)
> Avg. monthly wage, 22-24 year olds: $1,878 (lowest 20%)
> Poverty: 17.0%
> June 2019 unemployment: 3.7%
> Adults with at least a bachelor’s degree: 25.3%
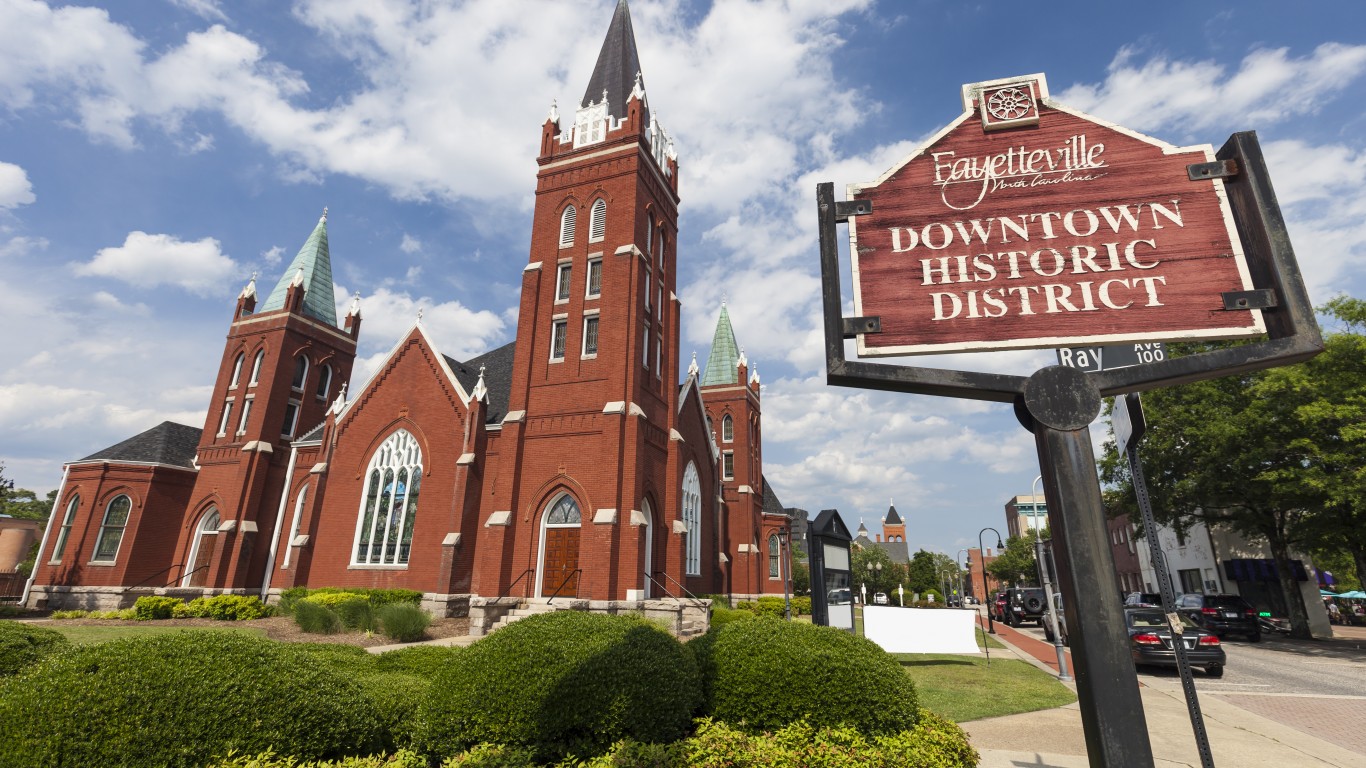
7. Fayetteville, NC
> Professional and administrative employment: 10.4% of total employment
> Avg. monthly wage, 22-24 year olds: $1,771 (lowest 10%)
> Poverty: 18.2% (highest 20%)
> June 2019 unemployment: 5.7% (highest 10%)
> Adults with at least a bachelor’s degree: 23.6%
[in-text-ad]
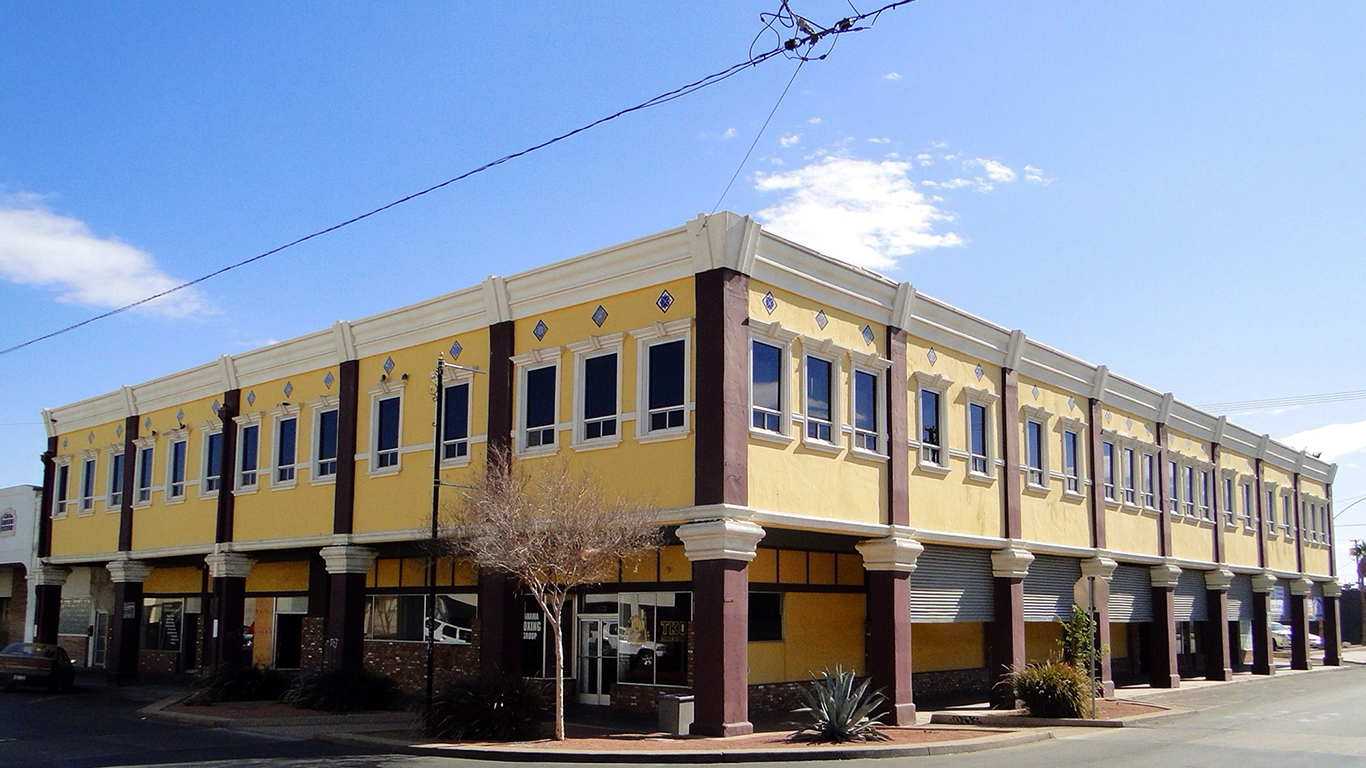
6. El Centro, CA
> Professional and administrative employment: 12.4% of total employment
> Avg. monthly wage, 22-24 year olds: $1,835 (lowest 10%)
> Poverty: 20.7% (highest 10%)
> June 2019 unemployment: 18.6% (highest 10%)
> Adults with at least a bachelor’s degree: 15.1% (lowest 10%)

5. Hattiesburg, MS
> Professional and administrative employment: 9.6% of total employment (lowest 20%)
> Avg. monthly wage, 22-24 year olds: $1,714 (lowest 10%)
> Poverty: 21.6% (highest 10%)
> June 2019 unemployment: 5.2% (highest 20%)
> Adults with at least a bachelor’s degree: 30.5%

4. Gadsden, AL
> Professional and administrative employment: 5.9% of total employment (lowest 10%)
> Avg. monthly wage, 22-24 year olds: $1,919 (lowest 20%)
> Poverty: 18.2% (highest 20%)
> June 2019 unemployment: 3.8%
> Adults with at least a bachelor’s degree: 19.3% (lowest 20%)
[in-text-ad-2]

3. Jacksonville, NC
> Professional and administrative employment: 9.5% of total employment (lowest 20%)
> Avg. monthly wage, 22-24 year olds: $1,689 (lowest 10%)
> Poverty: 12.9%
> June 2019 unemployment: 5.3% (highest 20%)
> Adults with at least a bachelor’s degree: 22.3%
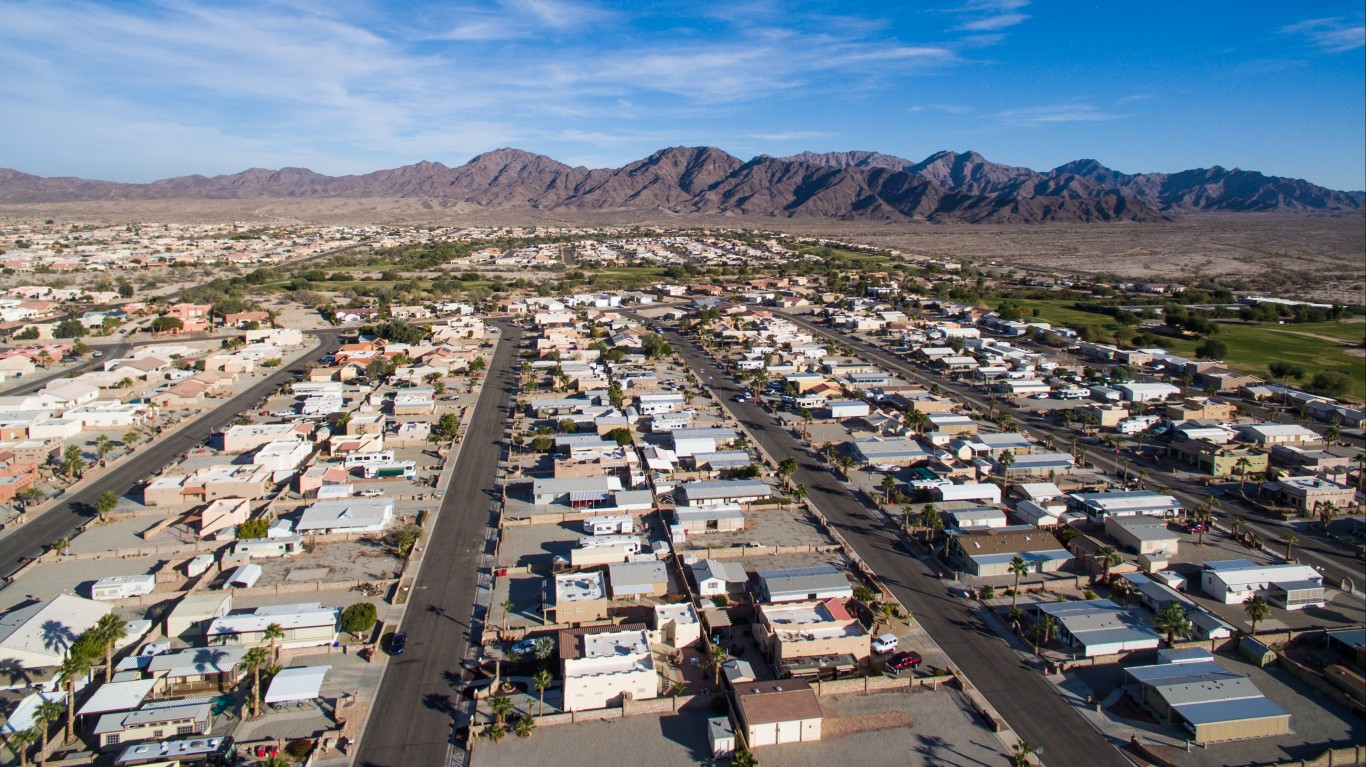
2. Yuma, AZ
> Professional and administrative employment: 11.2% of total employment
> Avg. monthly wage, 22-24 year olds: $2,069
> Poverty: 18.3% (highest 20%)
> June 2019 unemployment: 19.6% (highest 10%)
> Adults with at least a bachelor’s degree: 13.5% (lowest 10%)
[in-text-ad]
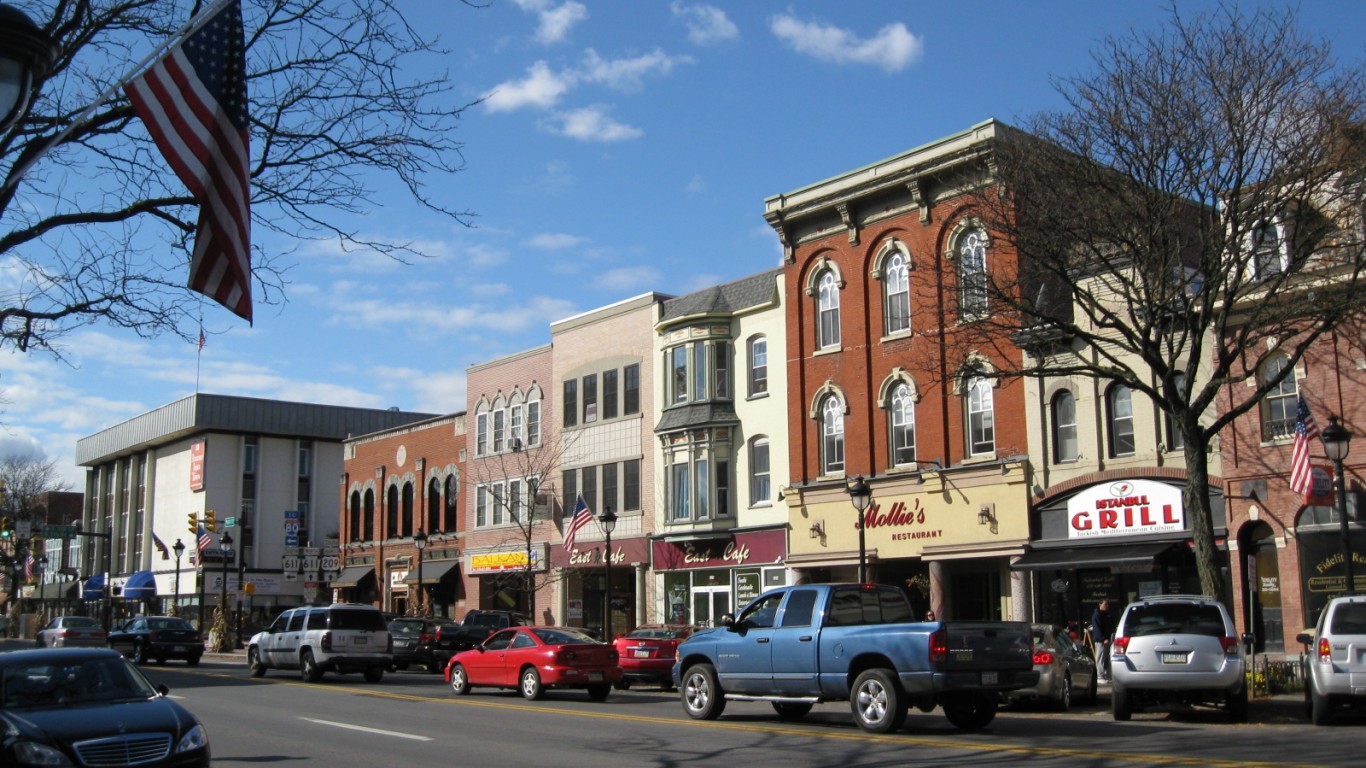
1. East Stroudsburg, PA
> Professional and administrative employment: 6.5% of total employment (lowest 10%)
> Avg. monthly wage, 22-24 year olds: $1,816 (lowest 10%)
> Poverty: 7.3% (lowest 10%)
> June 2019 unemployment: 4.9% (highest 20%)
> Adults with at least a bachelor’s degree: 24.1%
Methodology:
To identify the worst cities to find a job for new grads, 24/7 Wall St. created an index of three components: job growth for young workers, wages for young workers, and the concentration of white collar jobs in U.S. metropolitan statistical areas (MSAs). To construct the index, we used the U.S. Bureau of Labor Statistics Quarterly Workforce Indicators (QWI) extraction tool.
For the wages component, our index included average monthly wages for 22- to 24-year-old workers of all education levels employed in all industries for at least one quarter obtained from the QWI. Quarters were selected for each state’s MSAs based on how recent the data was and the availability of the data used to calculate the index. In order to have a unified average monthly earnings figure for MSAs that span multiple states, weighted averages were calculated based on population distribution among the states the MSA occupies.
For the job growth component we reviewed new jobs added in these metropolitan areas in the most recent quarter less job losses in the same quarter. All QWI data are for the first quarter of 2018 for all states except for Alaska (2016 Q1), South Dakota (2016 Q4), and Maine (2017 Q4).
The final component of our index was professional and administrative employment as a share of total employment for 22-to-24-year old workers, which is total employment in business and professional services, information, financial activities, and educational services sectors in each MSA as a share of total MSA employment.
We also considered the percentage of adults in each MSA with at least a bachelor’s degree and the percentage of people with incomes below the poverty line, both of which came from the U.S. Census Bureau’s 2017 American Community Survey. Industry employment as a percent of total employment for all workers in each MSA also came from the ACS.
Retirement can be daunting, but it doesn’t need to be.
Imagine having an expert in your corner to help you with your financial goals. Someone to help you determine if you’re ahead, behind, or right on track. With SmartAsset, that’s not just a dream—it’s reality. This free tool connects you with pre-screened financial advisors who work in your best interests. It’s quick, it’s easy, so take the leap today and start planning smarter!
Don’t waste another minute; get started right here and help your retirement dreams become a retirement reality.
Thank you for reading! Have some feedback for us?
Contact the 24/7 Wall St. editorial team.