Special Report
American Jobs With the Biggest Sick Leave Problems Right Now

Published:
Last Updated:

The COVID-19 pandemic is sweeping across the United States, closing businesses, idling workers, and forcing people to shelter in place. Another 6.6 million people filed for jobless claims in the first week of April, bringing the total job losses as a result of the coronavirus to 16.8 million in less than a month. With significant shares of the U.S. labor force receiving health insurance through their employers, these job losses have serious health consequences — especially in a time of a pandemic.
The economic carnage has also revealed a divide between those workers who get paid sick leave and those who do not — and many of those who do not get paid sick leave work in essential jobs.
According to the Bureau of Labor Statistics National Compensation Survey, 76% of the civilian workforce had access to paid sick leave in 2019. Although that percentage is up from 67% in 2010, it still leaves 33.6 million workers without paid sick leave.
To determine the jobs with the worst sick leave problems right now, 24/7 Wall St. created an index consisting of the percentage of workers consistently exposed to human contact from workforce survey data compiled by O*NET and the percentage of employees in each occupation with access to paid sick leave from the Bureau of Labor Statistics’ National Compensation Survey. Only detailed occupations with total estimated employment of 5,000 or greater were considered.
Just 64% of workers have access to paid sick leave in the sales and related occupations industry — a category comprising nine of the 30 jobs with the worst sick leave problem.
Click here to see American jobs with the biggest sick leave problems right now.
Click here to read our methodology.
The BLS data reveals a varied paid sick leave landscape. Among those workers in the bottom 10th of earnings distribution, just 31% receive paid sick leave. In contrast, 92% of the top 10th of earners receive paid sick leave. In addition, those in the higher-earnings category are more likely to have other benefits such as paid time off, and many more of them are also able to work remotely.
By occupational groups, at least 90% of teachers, financial workers, and registered nurses have access to paid sick leave, according to BLS data. In the sales, construction, farming, and fishing categories, 64% or fewer of workers have access to paid sick leave.
Many of those filling jobs that are considered at-risk for health reasons by the Occupational Information Network because the employees work in close proximity with others — cashiers, butchers and meat cutters, flight attendants, and drivers, for example — have annual median wages below the national median wage of $39,810.

30. Demonstrators and product promoters
> Exposure-risk index score: 0.37
> Workers consistently exposed to human contact: 67%
> Total workers: 77,760
> Annual median wage: $30,930
> Workers in occupational group, sales and related occupations, with access to paid sick leave: 64.0%
[in-text-ad]

29. Securities and commodities traders
> Exposure-risk index score: 0.37
> Workers consistently exposed to human contact: 67%
> Total workers: 437,880
> Annual median wage: $62,270
> Workers in occupational group, sales and related occupations, with access to paid sick leave: 64.0%

28. Parts salespersons
> Exposure-risk index score: 0.37
> Workers consistently exposed to human contact: 67%
> Total workers: 256,170
> Annual median wage: $31,710
> Workers in occupational group, sales and related occupations, with access to paid sick leave: 64.0%

27. Medical appliance technicians
> Exposure-risk index score: 0.37
> Workers consistently exposed to human contact: 71%
> Total workers: 14,130
> Annual median wage: $40,690
> Workers in occupational group, production occupations, with access to paid sick leave: 68.0%
[in-text-ad-2]

26. Transportation security screeners
> Exposure-risk index score: 0.37
> Workers consistently exposed to human contact: 86%
> Total workers: 46,730
> Annual median wage: $41,770
> Workers in occupational group, protective service occupations, with access to paid sick leave: 83.0%

25. Counter and rental clerks
> Exposure-risk index score: 0.37
> Workers consistently exposed to human contact: 68%
> Total workers: 411,560
> Annual median wage: $28,820
> Workers in occupational group, sales and related occupations, with access to paid sick leave: 64.0%
[in-text-ad]

24. Registered nurses
> Exposure-risk index score: 0.37
> Workers consistently exposed to human contact: 94%
> Total workers: 2,982,280
> Annual median wage: $73,300
> Workers in occupational group, registered nurses, with access to paid sick leave: 90.0%

23. Retail salespersons
> Exposure-risk index score: 0.38
> Workers consistently exposed to human contact: 69%
> Total workers: 4,317,950
> Annual median wage: $25,250
> Workers in occupational group, sales and related occupations, with access to paid sick leave: 64.0%

22. Nuclear power reactor operators
> Exposure-risk index score: 0.38
> Workers consistently exposed to human contact: 73%
> Total workers: 5,050
> Annual median wage: $100,530
> Workers in occupational group, production occupations, with access to paid sick leave: 68.0%
[in-text-ad-2]

21. Food cooking machine operators and tenders
> Exposure-risk index score: 0.38
> Workers consistently exposed to human contact: 73%
> Total workers: 30,030
> Annual median wage: $31,110
> Workers in occupational group, production occupations, with access to paid sick leave: 68.0%

20. Slaughterers and meat packers
> Exposure-risk index score: 0.38
> Workers consistently exposed to human contact: 73%
> Total workers: 73,390
> Annual median wage: $29,230
> Workers in occupational group, production occupations, with access to paid sick leave: 68.0%
[in-text-ad]

19. Driver/sales workers
> Exposure-risk index score: 0.38
> Workers consistently exposed to human contact: 77%
> Total workers: 444,660
> Annual median wage: $25,860
> Workers in occupational group, Transportation and material moving occupations, with access to paid sick leave: 72.0%

18. Gaming change persons and booth cashiers
> Exposure-risk index score: 0.38
> Workers consistently exposed to human contact: 70%
> Total workers: 21,290
> Annual median wage: $25,690
> Workers in occupational group, sales and related occupations, with access to paid sick leave: 64.0%

17. Coating, painting, and spraying machine setters, operators, and tenders
> Exposure-risk index score: 0.38
> Workers consistently exposed to human contact: 74%
> Total workers: 146,350
> Annual median wage: $38,150
> Workers in occupational group, production occupations, with access to paid sick leave: 68.0%
[in-text-ad-2]
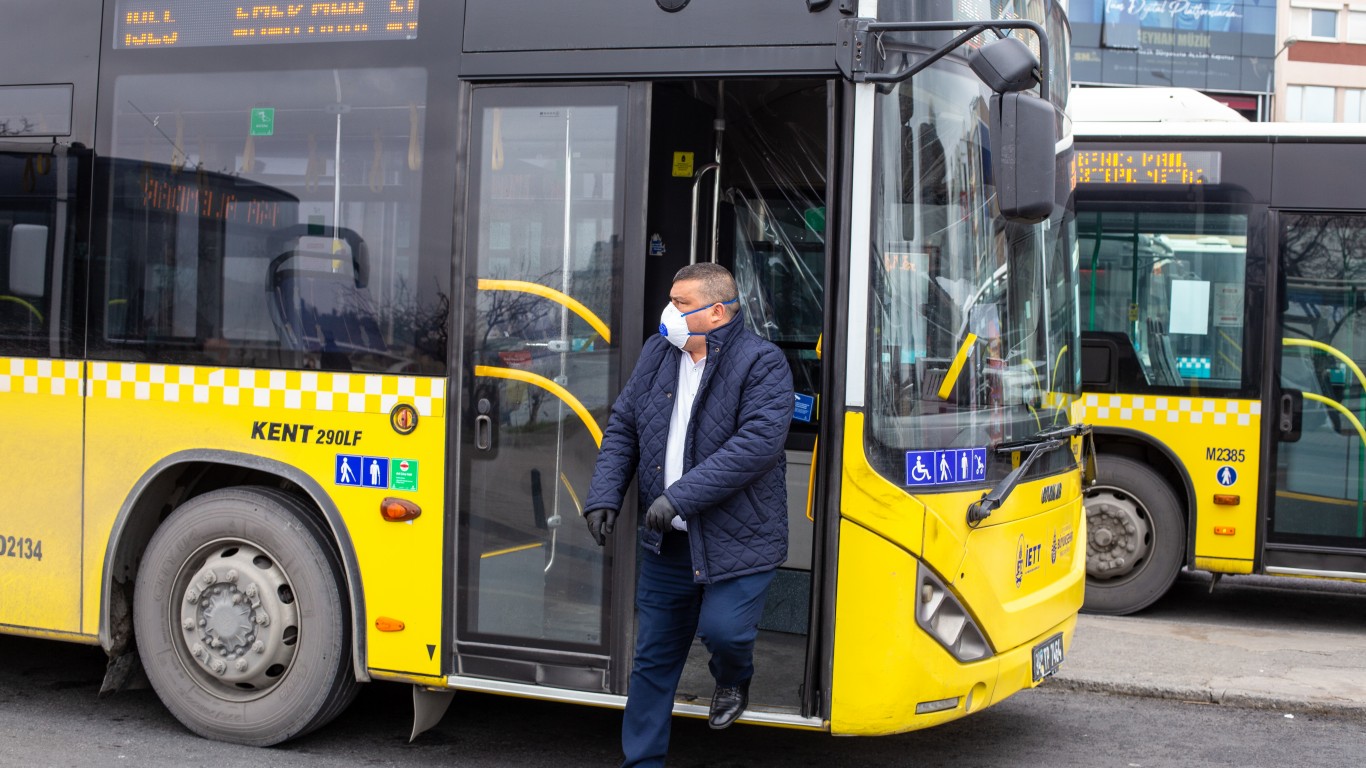
16. Bus drivers, transit and intercity
> Exposure-risk index score: 0.38
> Workers consistently exposed to human contact: 78%
> Total workers: 179,510
> Annual median wage: $43,030
> Workers in occupational group, transportation and material moving occupations, with access to paid sick leave: 72.0%

15. Municipal firefighters
> Exposure-risk index score: 0.38
> Workers consistently exposed to human contact: 89%
> Total workers: 324,620
> Annual median wage: $50,850
> Workers in occupational group, protective service occupations, with access to paid sick leave: 83.0%
[in-text-ad]

14. Real estate sales agents
> Exposure-risk index score: 0.38
> Workers consistently exposed to human contact: 71%
> Total workers: 162,330
> Annual median wage: $48,930
> Workers in occupational group, sales and related occupations, with access to paid sick leave: 64.0%

13. Hydroelectric plant technicians
> Exposure-risk index score: 0.39
> Workers consistently exposed to human contact: 77%
> Total workers: 12,950
> Annual median wage: $58,390
> Workers in occupational group, production occupations, with access to paid sick leave: 68.0%

12. Butchers and meat cutters
> Exposure-risk index score: 0.39
> Workers consistently exposed to human contact: 77%
> Total workers: 136,770
> Annual median wage: $32,500
> Workers in occupational group, production occupations, with access to paid sick leave: 68.0%
[in-text-ad-2]
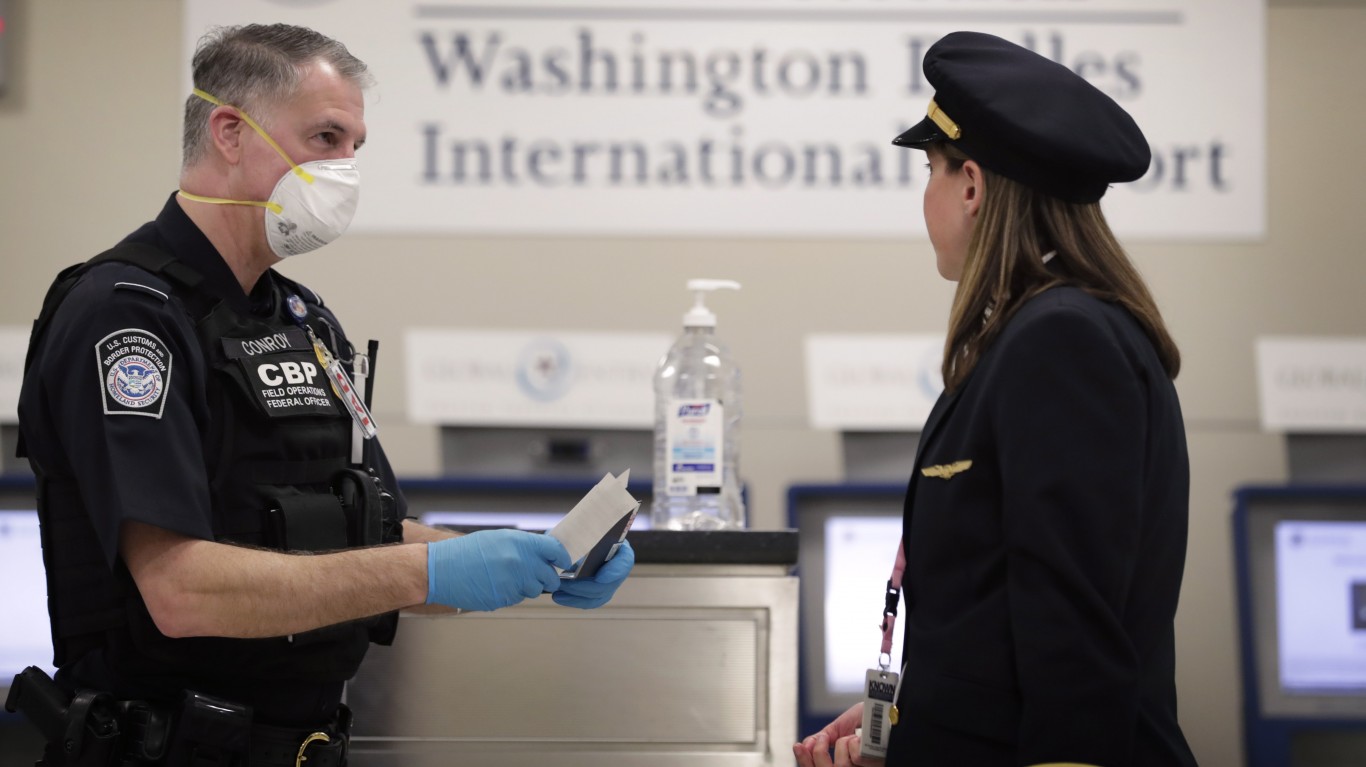
11. Commercial pilots
> Exposure-risk index score: 0.39
> Workers consistently exposed to human contact: 81%
> Total workers: 37,830
> Annual median wage: $86,080
> Workers in occupational group, transportation and material moving occupations, with access to paid sick leave: 72.0%

10. Air traffic controllers
> Exposure-risk index score: 0.40
> Workers consistently exposed to human contact: 82%
> Total workers: 22,090
> Annual median wage: $122,990
> Workers in occupational group, transportation and material moving occupations, with access to paid sick leave: 72.0%
[in-text-ad]
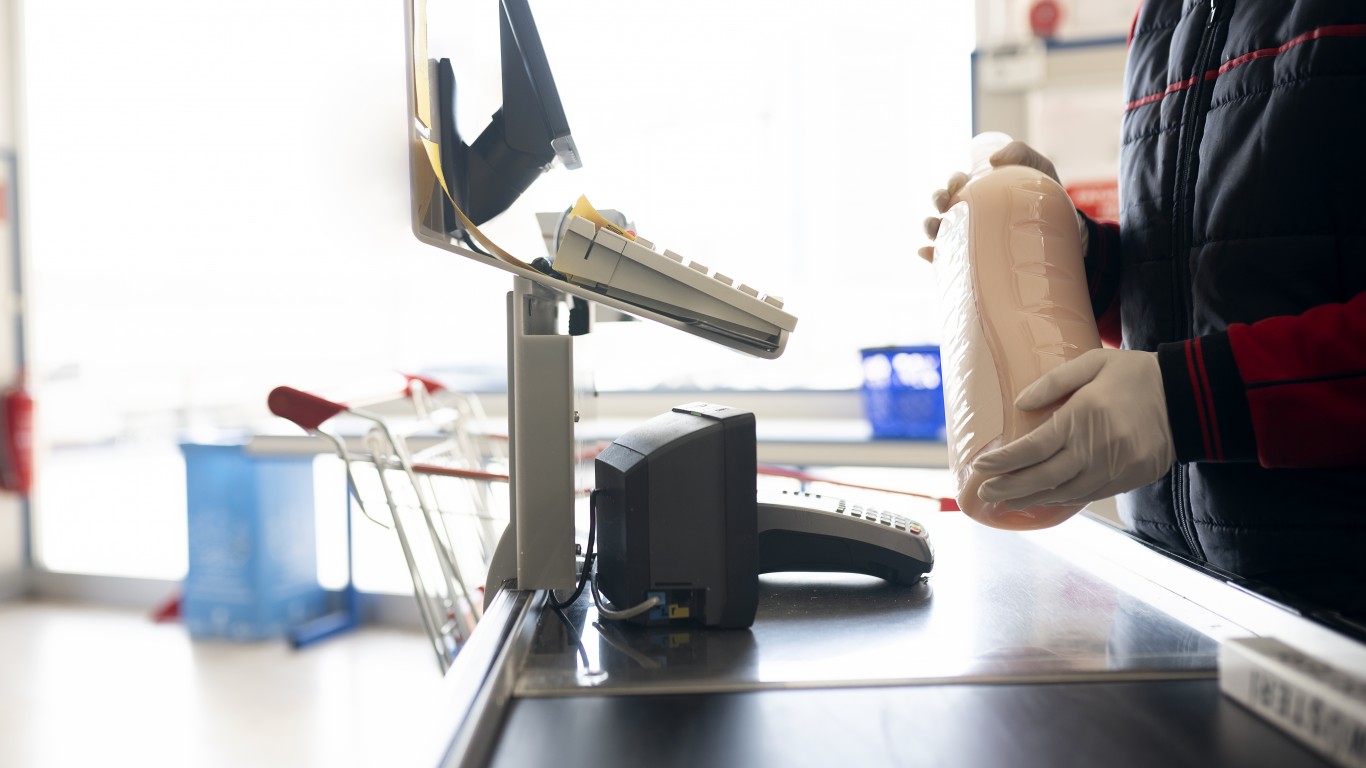
9. Cashiers
> Exposure-risk index score: 0.40
> Workers consistently exposed to human contact: 75%
> Total workers: 3,596,630
> Annual median wage: $23,650
> Workers in occupational group, sales and related occupations, with access to paid sick leave: 64.0%

8. Airline pilots, copilots, and flight engineers
> Exposure-risk index score: 0.40
> Workers consistently exposed to human contact: 83%
> Total workers: 84,520
> Annual median wage: $147,220
> Workers in occupational group, transportation and material moving occupations, with access to paid sick leave: 72.0%

7. Electrical and electronics repairers, powerhouse, substation, and relay
> Exposure-risk index score: 0.40
> Workers consistently exposed to human contact: 88%
> Total workers: 22,650
> Annual median wage: $82,780
> Workers in occupational group, installation, maintenance, and repair occupations, with access to paid sick leave: 77.0%
[in-text-ad-2]

6. Telemarketers
> Exposure-risk index score: 0.41
> Workers consistently exposed to human contact: 77%
> Total workers: 134,800
> Annual median wage: $26,290
> Workers in occupational group, sales and related occupations, with access to paid sick leave: 64.0%

5. Fiberglass laminators and fabricators
> Exposure-risk index score: 0.42
> Workers consistently exposed to human contact: 83%
> Total workers: 20,010
> Annual median wage: $35,480
> Workers in occupational group, production occupations, with access to paid sick leave: 68.0%
[in-text-ad]

4. Meat, poultry, and fish cutters and trimmers
> Exposure-risk index score: 0.42
> Workers consistently exposed to human contact: 85%
> Total workers: 153,990
> Annual median wage: $28,100
> Workers in occupational group, production occupations, with access to paid sick leave: 68.0%

3. Ambulance drivers and attendants, except emergency medical technicians
> Exposure-risk index score: 0.43
> Workers consistently exposed to human contact: 90%
> Total workers: 14,740
> Annual median wage: $25,890
> Workers in occupational group, transportation and material moving occupations, with access to paid sick leave: 72.0%

2. Transportation attendants, except flight attendants
> Exposure-risk index score: 0.44
> Workers consistently exposed to human contact: 93%
> Total workers: 28,200
> Annual median wage: $26,570
> Workers in occupational group, transportation and material moving occupations, with access to paid sick leave: 72.0%
[in-text-ad-2]
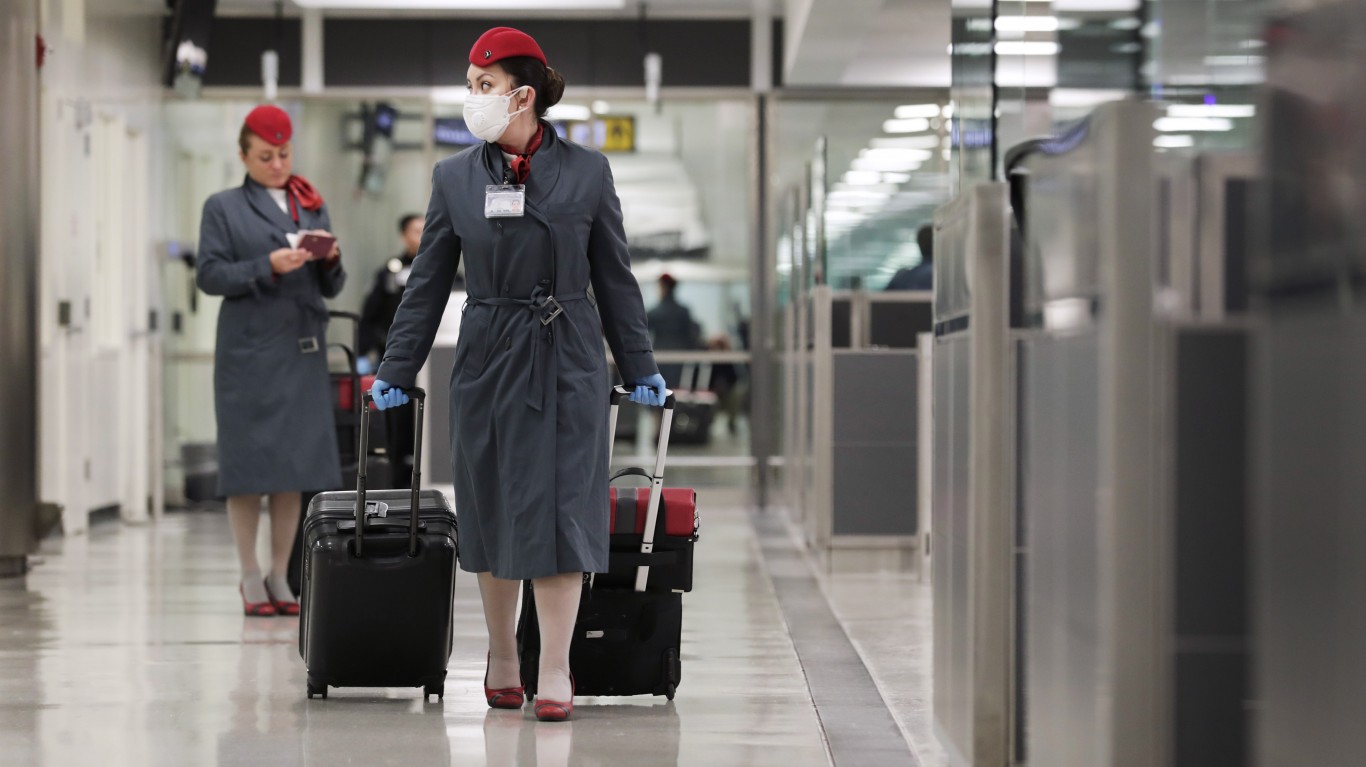
1. Flight attendants
> Exposure-risk index score: 0.45
> Workers consistently exposed to human contact: 96%
> Total workers: 120,840
> Annual median wage: $56,640
> Workers in occupational group, transportation and material moving occupations, with access to paid sick leave: 72.0%
Methodology
To determine the jobs with sick leave problems right now, 24/7 Wall St. created an index of the percentage of workers consistently exposed to human contact from workforce survey data compiled by O*NET, and the percentage occupational group employment with access to paid sick leaves from the Bureau of Labor Statistics’ National Compensation Survey. Only detailed occupations with total estimated employment of 5,000 or greater were considered. All data is for 2019.
The workplace proximity index was based on a survey of 24 million workers taken by O*NET, an online database of occupational data sponsored by the Department of Labor. Median wage and estimated employment by detailed occupation came from the Bureau of Labor Statistics’ Occupational Employment Statistics survey for May 2019.
Credit card companies are at war. The biggest issuers are handing out free rewards and benefits to win the best customers.
It’s possible to find cards paying unlimited 1.5%, 2%, and even more today. That’s free money for qualified borrowers, and the type of thing that would be crazy to pass up. Those rewards can add up to thousands of dollars every year in free money, and include other benefits as well.
We’ve assembled some of the best credit cards for users today. Don’t miss these offers because they won’t be this good forever.
Flywheel Publishing has partnered with CardRatings for our coverage of credit card products. Flywheel Publishing and CardRatings may receive a commission from card issuers.
Thank you for reading! Have some feedback for us?
Contact the 24/7 Wall St. editorial team.