Special Report
Cities With the Worst COVID-19 Unemployment Crisis Right Now
Published:

The COVID-19 pandemic has ushered in an unemployment crisis on a scale not seen in modern U.S. history. Nearly every week since mid-March, initial jobless claims in the U.S. have topped 1 million — a threshold not previously reached since the Department of Labor began keeping records over half a century ago.
Though it may take years to bring back the more than 12 million jobs that have been lost since January, the U.S. job market is showing signs of improvement. The unemployment rate stood at 10.2% as of July, down from a more than 70-year high of 14.7% in April 2020. In some U.S. cities, however, including several major economic hubs, jobs are returning at a much slower pace, if at all, and the unemployment crisis is far worse than it is nationwide.
24/7 Wall St. reviewed seasonally adjusted unemployment rates from the Bureau of Labor Statistics at the metropolitan area level to identify the cities with the worst unemployment problem.
All else being equal, the consequences of unemployment for the 13.6 million Americans who are out of work varies, depending on where they live. Some parts of the country have relatively strong social safety nets, providing residents who are out of work access to a range of benefits with few restrictions, while others provide relatively little help and for shorter times. Here is a look at the worst states in which to be unemployed.
The current economic crisis is the result of the COVID-19 pandemic. There have been nearly 6.2 million confirmed COVID-19 cases in the United States to date, including over 178,000 deaths attributed to the virus. In addition to soaring unemployment, many of the metro areas on this list have been disproportionately affected by the coronavirus, reporting high caseloads per capita. Here is a look at the cities where COVID-19 is growing the fastest.
Click here to see the cities with the worst COVID-19 unemployment crisis right now
Click here to read our methodology

35. Rockford, IL
> Unemployment rate, July 2020: 13.9%
> Year-to-date employment change: -9.4%
> Poverty rate: 15.8%
> Population: 337,658
The unemployment rate in Rockford, Illinois soared to 23.7% in April, up from just 5.5% a month earlier, as the COVID-19 pandemic forced companies to idle workers. Almost 34,000 jobs were lost, with employment plunging to 121,642 in April from 155,049 in January.
Some jobs have returned since April, with the jobless rate falling almost 10 percentage points to 13.9% in July from the 23.7% peak in April. But the metro area’s job market has a long way to go. Nearly one in 10 jobs that existed in Rockford at the beginning of January have disappeared. Among the companies impacted by the pandemic was Collins Aerospace, a division of United Technologies, which announced in April it was going to enact pay cuts, layoffs, and furloughs. At the time of the announcement, about 2,200 local residents were employed at Collins Aerospace.
[in-text-ad]

34. Fresno, CA
> Unemployment rate, July 2020: 13.9%
> Year-to-date employment change: -9.5%
> Poverty rate: 21.5%
> Population: 994,400
At the beginning of the year, before the effects of the COVID-19 pandemic were felt in the United States, Fresno already had one of the worst job markets in the country. The metro area’s January 2020 unemployment rate was 6.9%, nearly double the comparable national unemployment rate of 3.6%. Over the months since, over 40,000 jobs in the metro area have disappeared, and the unemployment rate now stands at 13.9%, one of the highest of any U.S. metro area.

33. Allentown-Bethlehem-Easton, PA-NJ
> Unemployment rate, July 2020: 13.9%
> Year-to-date employment change: -9.8%
> Poverty rate: 10.8%
> Population: 842,913
More than 56,000 jobs were lost in the Allentown-Bethlehem-Easton region in eastern Pennsylvania from January to April, as the unemployment rate soared to 16.7% in April from 5.6% a month earlier. Though several thousand jobs have returned in recent months, the metro area’s 13.9% unemployment rate is among the highest in the country.
The region, once known for heavy industry such as steel manufacturing, has transitioned to an economy more dependent on hospitality, one of the sectors hurt most by COVID-19. One of the region’s biggest employers, the casino and hotel Wind Creek Bethlehem, reopened in June.

32. Watertown-Fort Drum, NY
> Unemployment rate, July 2020: 13.9%
> Year-to-date employment change: -11.8%
> Poverty rate: 11.8%
> Population: 111,755
Nearly 12% of jobs in the Watertown-Fort Drum metro area in upstate New York have disappeared since January. Hit hard by the COVID-19 recession, unemployment in the area jumped from 6.4% in March to 17.1% in April.
In more recent months, jobs have steadily returned in much of the country. Watertown is a notable exception, however. The metro area’s July jobless rate stands at 13.9%, up from 13.0% in June. Meanwhile, the national jobless rate fell to 10.2% in July from 11.1% in June.
[in-text-ad-2]

31. Modesto, CA
> Unemployment rate, July 2020: 13.9%
> Year-to-date employment change: -13.1%
> Poverty rate: 15.6%
> Population: 549,815
The unemployment rate in Modesto, home to a large farming community, more than doubled to 13.9% in July from 5.8% in January. Over the same period, the city lost about 30,000 jobs, a 13.1% overall decline in employment.
Modesto has also been one of California’s hotspots for COVID-19 infections, and the pandemic has hit the farmworkers community, composed mostly of Latino workers, very hard.

30. Philadelphia-Camden-Wilmington, PA-NJ-DE-MD
> Unemployment rate, July 2020: 14.0%
> Year-to-date employment change: -9.7%
> Poverty rate: 12.3%
> Population: 6,096,372
Philadelphia is one of only 30 metro areas nationwide where the unemployment rate is 14.0% or higher. Since January, before the effects of the coronavirus pandemic were felt in the U.S., the metro area has shed nearly 300,000 jobs.
Across the Philadelphia metro area, the coronavirus has taken a devastating toll. To date, there have been 99 deaths for every 100,000 residents, well above the national death rate of 53.8 per 100,000. Philadelphia has also implemented especially restrictive policies to contain the virus. Limited indoor dining in the city was not permitted until Sept. 8, long after it was allowed in much of the country.
[in-text-ad]
29. Johnstown, PA
> Unemployment rate, July 2020: 14.0%
> Year-to-date employment change: -11.2%
> Poverty rate: 14.8%
> Population: 131,730
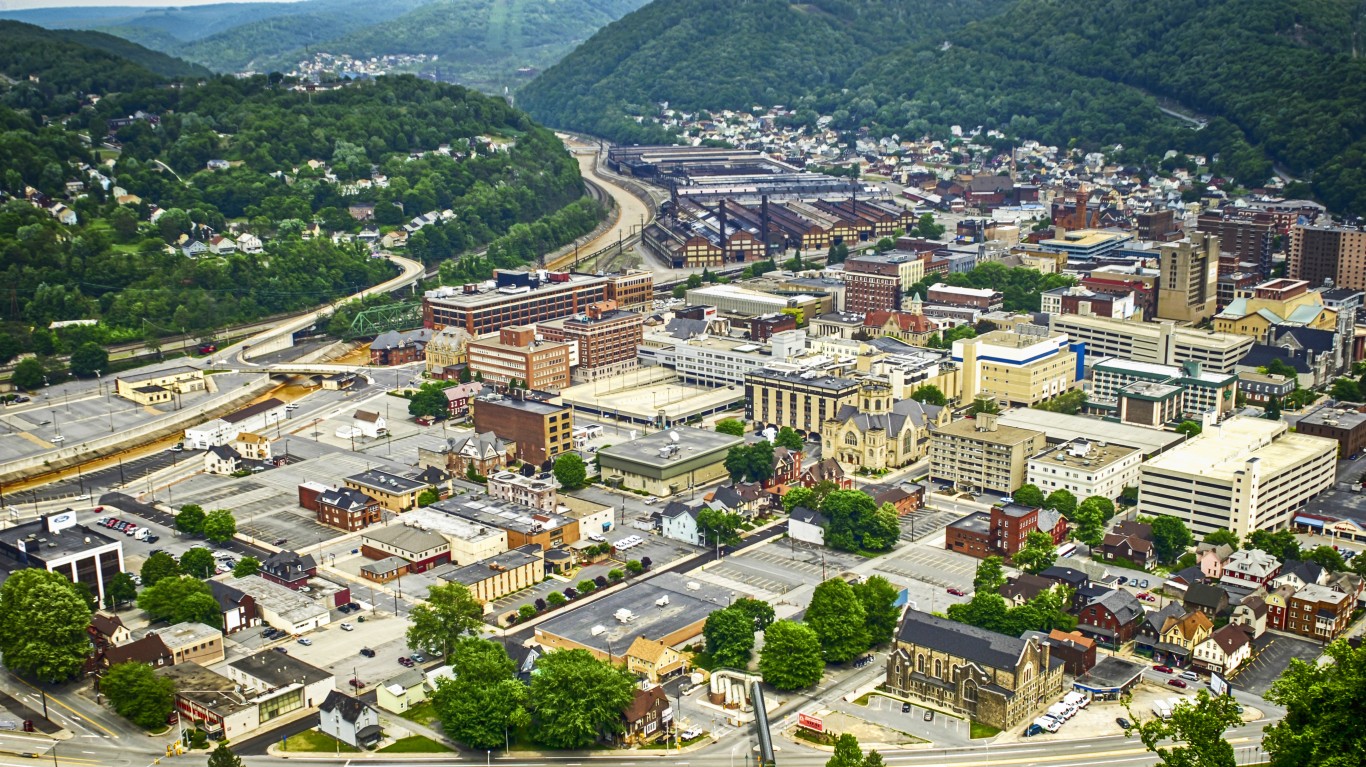
The unemployment rate in Johnstown, Pennsylvania rose to 14.0% in July, jumping from a relatively high 5.8% in January. Though the local unemployment rate has declined from a high of 18.1% in April, there are still more than 6,000 fewer jobs in the area now than there were at the beginning of the year. The median household income in Johnston is $45,084, one of the lowest of any U.S. metro area.

28. Buffalo-Cheektowaga-Niagara Falls, NY
> Unemployment rate, July 2020: 14.2%
> Year-to-date employment change: -5.8%
> Poverty rate: 13.7%
> Population: 1.1 million
Unemployment peaked in the Buffalo, New York, metro area in April, when about one in every five labor force participants were out of a job. Though the unemployment rate has improved since then, it remains higher than in much of the rest of the country. Currently, Buffalo has a 14.2% unemployment rate, well above the 10.2% national rate.
Tourism is one of the hardest hit industries by the COVID-19 recession as nonessential travel effectively ground to a halt for the first few months of the pandemic. The Buffalo metro area is home to Niagara Falls, where tourism is an economic pillar.

27. Yuba City, CA
> Unemployment rate, July 2020: 14.2%
> Year-to-date employment change: -17.3%
> Poverty rate: 15.1%
> Population: 174,848
More than 17% of the jobs that existed in Yuba City in northern California at the beginning of the year have now disappeared. Over the same period, the metro area’s unemployment rate jumped to 14.2% in July from an already high 6.5% in January.
Yuba City is located in Sutter County, one of two California counties (Yuba County is the other) that defied Gov. Gavin Newsom’s stay-at-home order and allowed restaurants, salons, gyms, and shopping centers to reopen in May.
[in-text-ad-2]
26. Salinas, CA
> Unemployment rate, July 2020: 14.2%
> Year-to-date employment change: -22.7%
> Poverty rate: 13.4%
> Population: 435,594
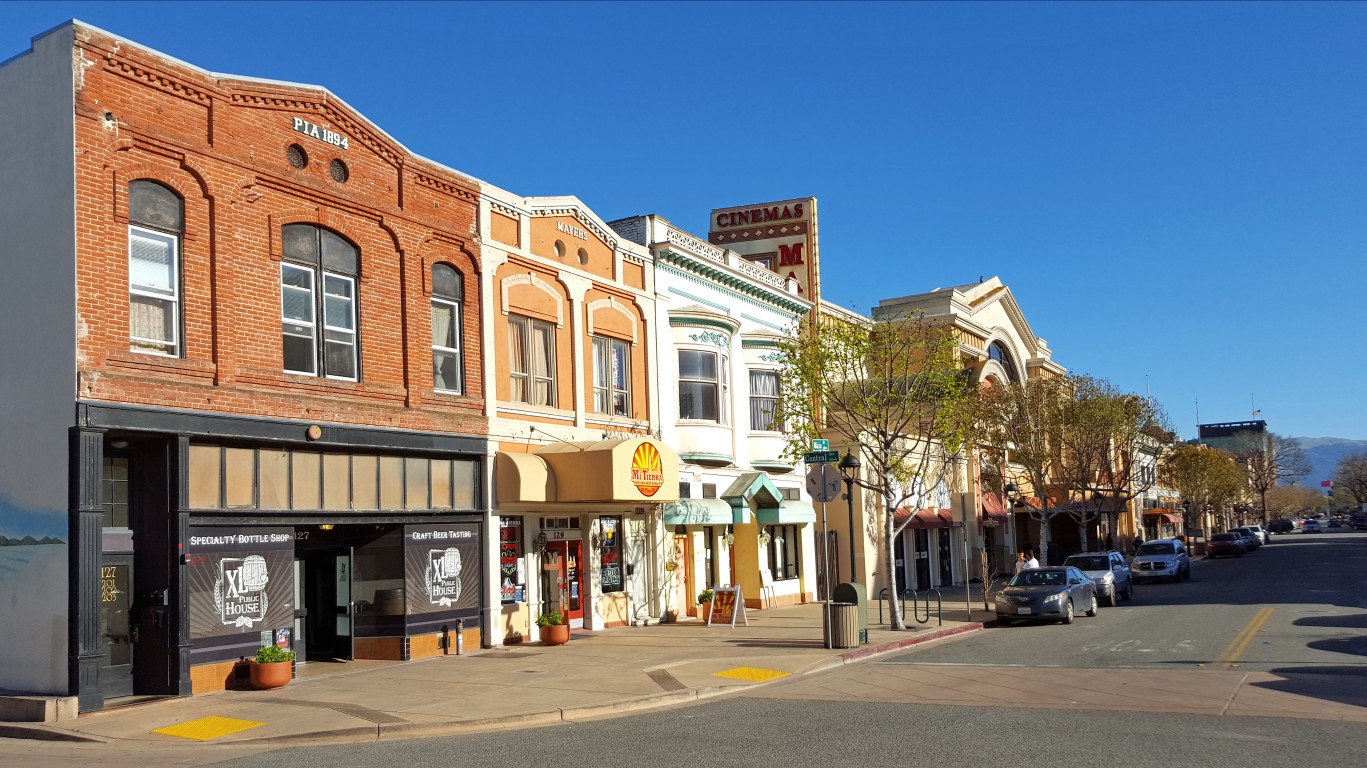
Salinas is one of 10 California metro areas to rank on this list. Since January, more than one in every five jobs have disappeared in Salinas. Over the same period, the metro area’s unemployment rate nearly tripled from 5.8% to 14.2%.
As is the case in much of the country — including many metro areas on this list — Salinas’ current unemployment rate is an improvement from the earliest months of the pandemic. The jobless rate in Salinas stood at 20.0% as recently as April.

25. Pittsburgh, PA
> Unemployment rate, July 2020: 14.3%
> Year-to-date employment change: -12.3%
> Poverty rate: 10.8%
> Population: 2,324,743
The unemployment rate in Pittsburgh, one of the more populous metro areas on the list, leapt more than threefold to 17.0% in April from 4.7% in January. As of July, the metro area’s jobless rate stands at 14.3%, as there are about 143,000 fewer jobs in Pittsburgh now than there were at the beginning of the year.
Restaurants in Pennsylvania received good news in early September, when Gov. Tom Wolf announced restaurants may raise indoor capacity to 50% starting Sept. 21. To what degree the move will reduce joblessness across the state remains to be seen.
[in-text-ad]
24. Vineland-Bridgeton, NJ
> Unemployment rate, July 2020: 14.4%
> Year-to-date employment change: -7.0%
> Poverty rate: 14.6%
> Population: 150,972
Many of the U.S. cities with the worst unemployment are in New Jersey. One of them is Vineland-Bridgeton, where 14.4% of the labor force is unemployed. Since January, more than 4,000 jobs in the metro area have disappeared.
Like much of the Northeast, Vineland-Bridgeton has had an especially high concentration of coronavirus cases. There have been 2,359 cases of COVID-19 for every 100,000 people to date, well above the national rate of 1,916 cases per 100,000 people.

23. Yakima, WA
> Unemployment rate, July 2020: 14.4%
> Year-to-date employment change: -10.6%
> Poverty rate: 16.6%
> Population: 251,446
The state of Washington was one of the first to be hit by the pandemic. In Yakima, there have been about 4,436 COVID-19 cases for every 100,000 people to date, considerably above the national rate of 1,916 cases per 100,000 people.
The unemployment rate in Yakima, located about 140 miles southeast of Seattle, climbed to 14.6% in April from 6.4% in January. After declining to 11.8% in June, the unemployment rate jumped up to 14.4% in July. The jobless surge exacerbated economic distress in Yakima, where 22.8% of households receive food stamps, one of the highest recipiency rates of any U.S. metro area.

22. Merced, CA
> Unemployment rate, July 2020: 14.5%
> Year-to-date employment change: -9.4%
> Poverty rate: 22.0%
> Population: 274,765
With an unemployment rate of 14.5%, the Merced, California, metro area has one of the worst job markets in the United States. Though the city has shed more than 10,000 jobs since January, largely due to the COVID-19 pandemic, unemployment has been higher than average in the city long before the novel coronavirus hit the U.S. At the beginning of the year, 7.8% of the local labor force was unemployed, more than double the 3.6% national jobless rate at the time.
The widespread unemployment in Merced is causing further economic harm to residents of a metro area already characterized with high poverty. In Merced, 22.0% of the population lives below the poverty line, compared with 13.1% of Americans nationwide.
[in-text-ad-2]
21. Worcester, MA-CT
> Unemployment rate, July 2020: 14.5%
> Year-to-date employment change: -13.8%
> Poverty rate: 9.3%
> Population: 947,866
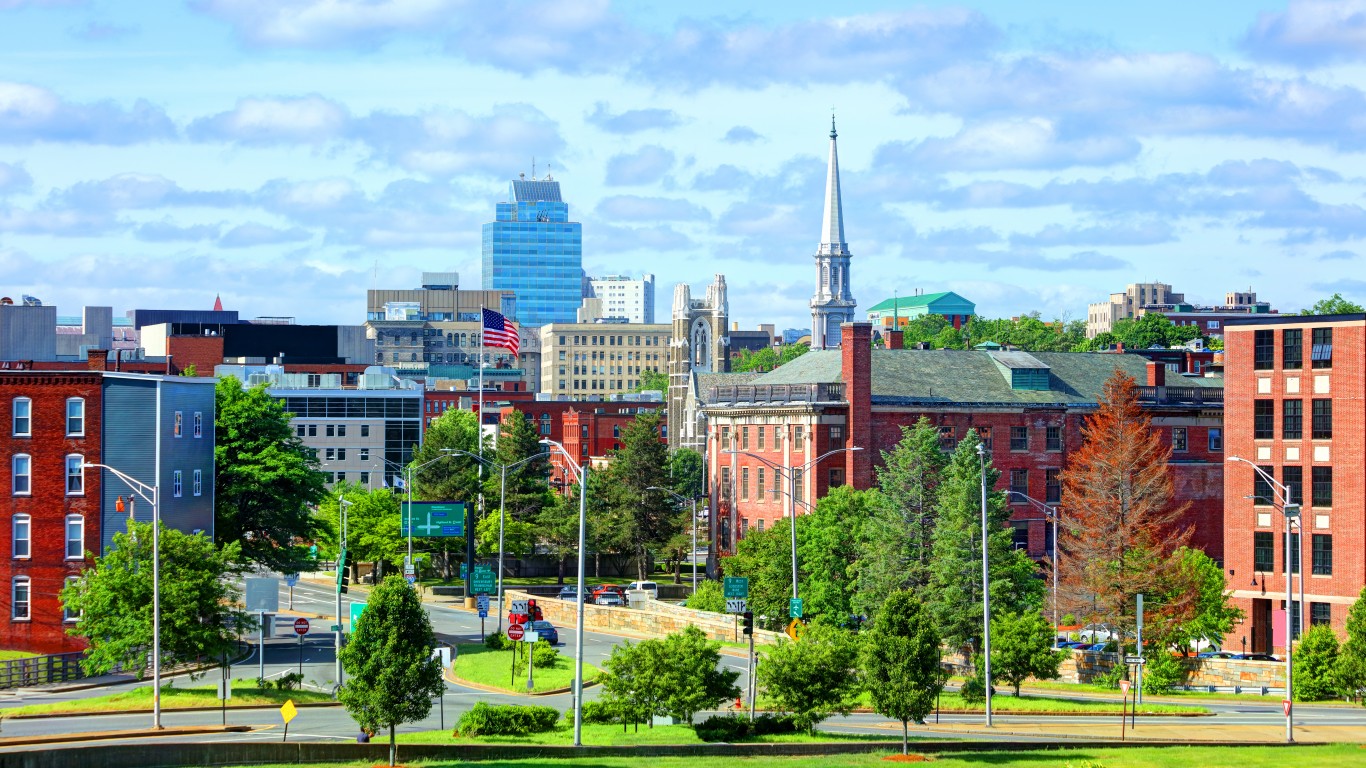
The Worcester, Massachusetts, metro area, which includes parts of Connecticut, has an unemployment rate of 14.5% — well above the 10.2% national jobless rate. The joblessness has soared more than fourfold from 3.1% in January. The metro area is one of several in Massachusetts with an economy that has been hit hard by the COVID-19 pandemic.
Since January, Worcester has shed over 48,000 jobs. An Assumption University report found that the Worcester region’s hospitality sector lost 11,000 jobs, or 42%, between June 2019 and June 2020.
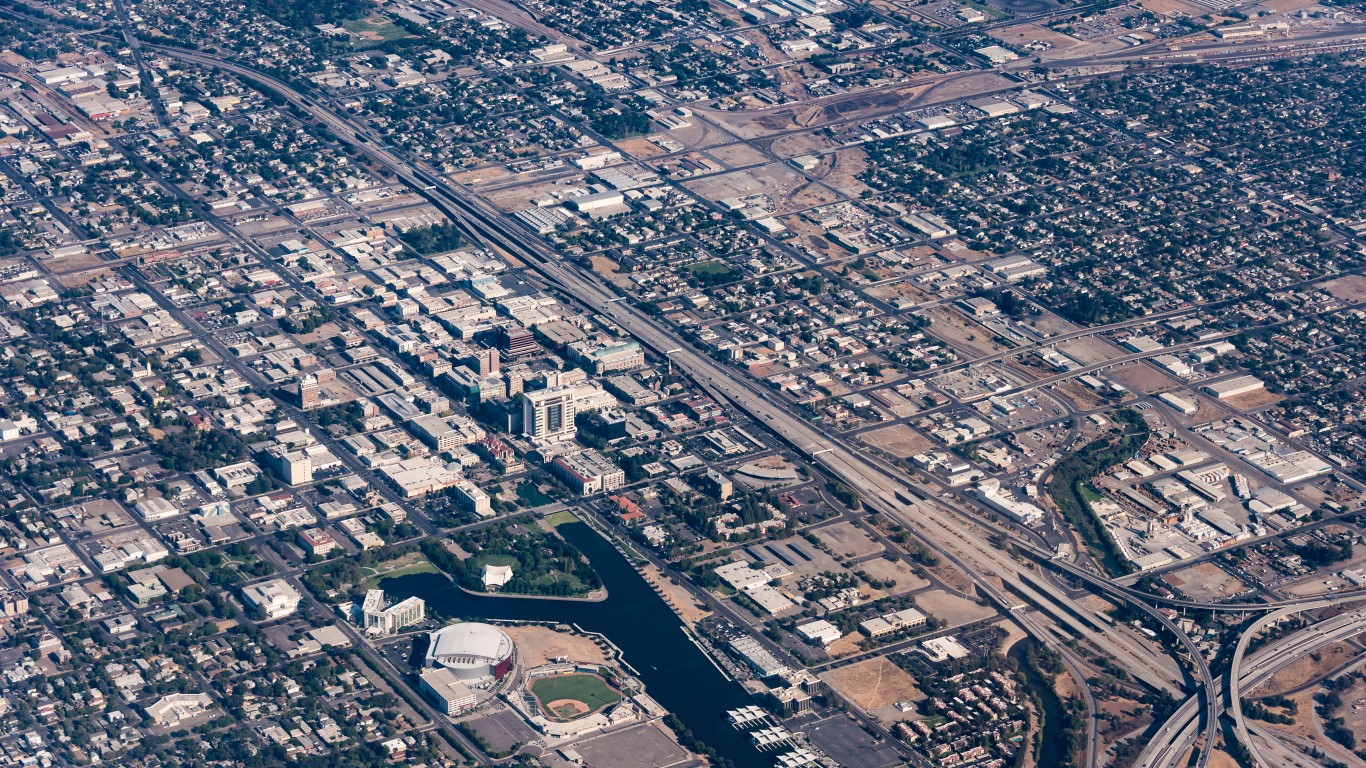
20. Stockton-Lodi, CA
> Unemployment rate, July 2020: 14.6%
> Year-to-date employment change: -10.8%
> Poverty rate: 14.2%
> Population: 752,660
In the Stockton-Lodi metro area, industries at high risk of slowdown during the COVID-19 pandemic, such as transportation and warehousing and tourism, account for a far higher than typical share of total employment. Partially as a result, about 33,000 jobs in the metro area — or more than one in every 10 — have disappeared so far this year. The unemployment rate in the Stockton-Lodi metro area now stands at 14.6%, up from 5.7% in January.
As is the case with several metro areas on this list, Stockton-Lodi has also had a higher than average concentration of coronavirus infections. To date, there have been 2,534 confirmed cases for every 100,000 people in the California metro area compared with 1,916 cases per 100,000 people nationwide.
[in-text-ad]
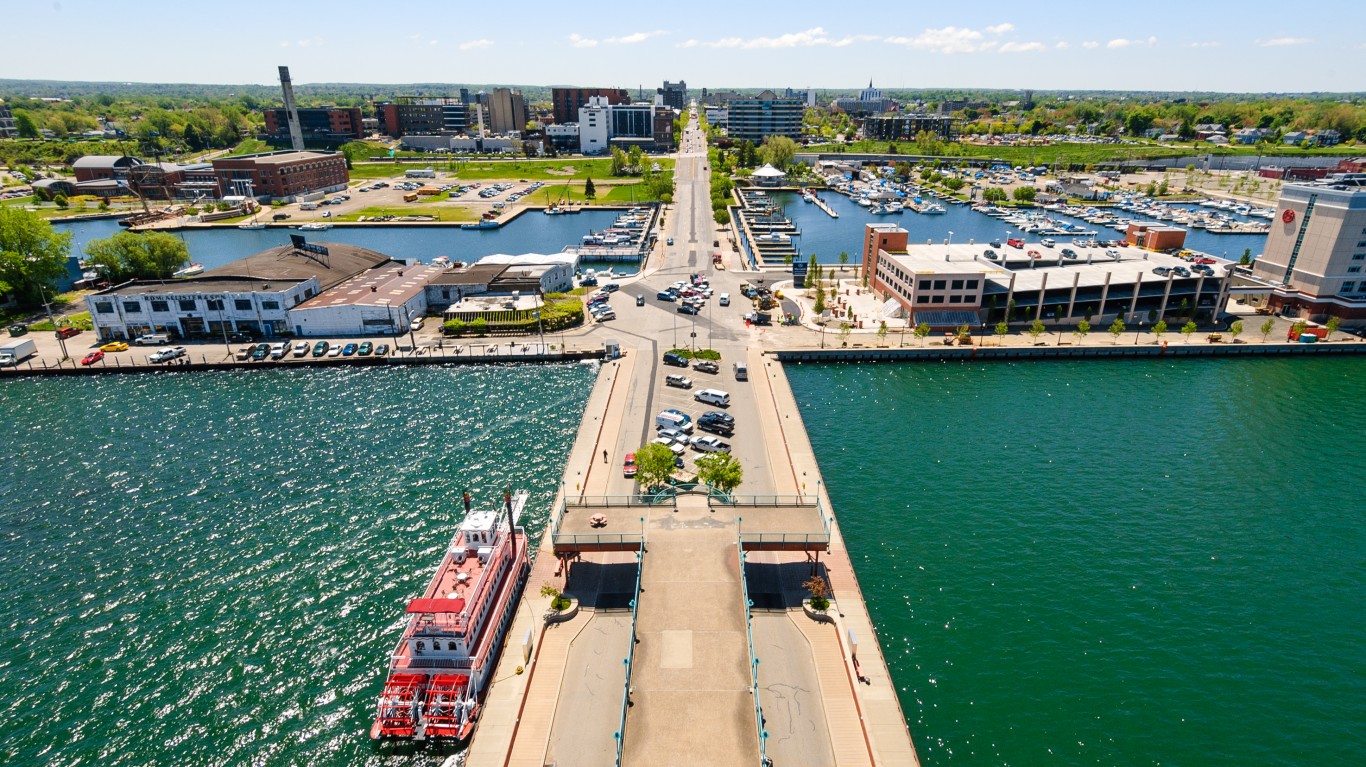
19. Erie, PA
> Unemployment rate, July 2020: 14.8%
> Year-to-date employment change: -12.1%
> Poverty rate: 15.5%
> Population: 272,061
The pandemic took a toll on the labor market in Erie, a metro area in northwest Pennsylvania. More than 14,000 jobs have disappeared from January through July. Over that period, the jobless rate swelled to 14.8% from 5.0%, which was already higher than the national jobless rate of 3.6%. The rate crested at 17.2% in April. The increased economic distress in Erie is likely felt with even greater intensity in the 18.7% of local households that rely on food stamps — one of the highest recipiency rates of any U.S. metro area.
Restaurants in Pennsylvania received good news in early September, when Gov. Tom Wolf announced restaurants may raise indoor capacity to 50% starting Sept. 21. To what degree the move will reduce joblessness across the state remains to be seen.

18. Farmington, NM
> Unemployment rate, July 2020: 14.8%
> Year-to-date employment change: -16.4%
> Poverty rate: 24.4%
> Population: 125,043
The coronavirus recession has exacerbated an existing unemployment problem in the Farmington, New Mexico, metro area. At the beginning of the year, before the economic effects of the virus were felt in the United States, Farmington had a 5.8% unemployment rate, well above the 3.6% national average. Now, the metro area’s jobless rate stands at 14.8% — higher than in all but 17 other metro areas.
Over the summer, jobs have been returning and unemployment has been falling in much of the country. In Farmington, however, the unemployment crisis appears to be only getting worse. As recently as June, the area’s unemployment rate was just 10.2% — 4.6 percentage points below where it stands now.

17. Scranton–Wilkes-Barre–Hazleton, PA
> Unemployment rate, July 2020: 15.2%
> Year-to-date employment change: -14.2%
> Poverty rate: 14.3%
> Population: 555,485
Scranton, one of two Pennsylvania metro areas with an unemployment rate above 15%, has been economically affected by the COVID-19 pandemic more than most American cities. Before COVID-19 was widespread in the U.S., more than one-fifth of the metro area’s workforce was employed in industries such as transportation and warehousing that are at a disproportionately high risk of slowdown in a pandemic scenario.
Many of those jobs are among the more than 37,000 positions that have disappeared in the Scranton metro area since the beginning of 2020, a decline of 14.2%.
[in-text-ad-2]

16. Orlando-Kissimmee-Sanford, FL
> Unemployment rate, July 2020: 15.3%
> Year-to-date employment change: -15.6%
> Poverty rate: 13.9%
> Population: 2,572,962
Few industries have been hit as hard by the COVID-19 recession as tourism. Home to several theme parks, including Walt Disney World and Universal Studios, Orlando’s economy depends on tourism. The number of people working in the metro area has fallen by over 15% since the beginning of the year.
Currently, the metropolitan area’s unemployment rate stands at 15.3%, well above the 10.2% national rate. However, the jobless rate in the metro area is considerably lower than it was in June, when 16.4% of the labor force was unemployed. The improvement could be due in part to the July reopening of Disney World, which had been shuttered for over three months due to the pandemic.

15. Boston-Cambridge-Newton, MA-NH
> Unemployment rate, July 2020: 15.3%
> Year-to-date employment change: -16.8%
> Poverty rate: 9.2%
> Population: 4,875,390
The Northeast was hit by the COVID-19 pandemic in the first few months, and economies across the region have been getting slammed. In Boston, the largest metro area in New England, 15.3% of the labor force was out of work as of July, one of the highest unemployment rates of any U.S. metro area. The region started the year with an unemployment rate of just 2.5%, more than 1 percentage point below the national jobless rate at the time of 3.6%.
In January 2020, before the COVID-19 recession, there were about 2.8 million people working in the Boston metro area. As of July, there were 2.3 million workers — a 16.8% decline.
[in-text-ad]

14. Springfield, MA
> Unemployment rate, July 2020: 15.9%
> Year-to-date employment change: -17.7%
> Poverty rate: 15.4%
> Population: 631,761
Massachusetts is one of the hardest hit states by the COVID-19 recession. In Springfield, one of several Massachusetts metro areas to rank on this list, the number of people working has declined by 17.7% since January. As of July, the unemployment rate in Springfield stood at 15.9%, compared with the 10.2% national jobless rate.
The widespread unemployment in Springfield is causing further economic harm to residents of a metro area where financial hardship was relatively common to begin with. In Springfield, 15.4% of the population lives below the poverty line, compared with 13.1% of Americans nationwide.

13. Los Angeles-Long Beach-Anaheim, CA
> Unemployment rate, July 2020: 16.0%
> Year-to-date employment change: -16.9%
> Poverty rate: 13.3%
> Population: 13,291,486
Along with other major American metro areas like Boston, New York, and Philadelphia, Los Angeles has so far had especially high unemployment during the COVID-19 pandemic. As of July, 16.0% of the LA metro area’s labor force was out of work, well above the 10.2% national jobless rate. The number of people working in the LA metro area stands at around 5.4 million, down 16.9% from 6.5 million at the beginning of 2020.
As of Sept. 6, there were 7,051 confirmed deaths from COVID-19 in the L.A. area, the third most of any U.S. metro area.

12. New York-Newark-Jersey City, NY-NJ-PA
> Unemployment rate, July 2020: 16.2%
> Year-to-date employment change: -13.3%
> Poverty rate: 12.3%
> Population: 19,979,477
New York City was long considered the epicenter of the COVID-19 pandemic in the United States. Across the broader New York metro area, there have been over half a million confirmed cases of the novel coronavirus, or 2,770 for every 100,000 people, well above the 1,916 per 100,000 national concentration.
The broader New York metropolitan area has also taken a harder hit economically than most of the country. The metro area’s unemployment rate stands at 16.2%, compared with the 10.2% national jobless rate. At the beginning of 2020, the unemployment rate in New York was just 3.6%, in line with the national average.
[in-text-ad-2]

11. Visalia-Porterville, CA
> Unemployment rate, July 2020: 16.2%
> Year-to-date employment change: -14.4%
> Poverty rate: 22.5%
> Population: 465,861
The unemployment rate in the Visalia-Porterville metro area, located in the agriculturally rich San Joaquin Valley, stood at 9.3% in January, well above the national jobless average of 3.6% at the time. The impact of the COVID-19 pandemic boosted the unemployment rate to 16.2% in July. From January to July, the region lost almost 27,000 jobs.
Generally, lower-income Americans have been at increased risk of unemployment during the COVID-19 pandemic. In Visalia-Porterville, most households earn less than $49,000 a year, while the typical American household earns about $62,000 annually.

10. Las Vegas-Henderson-Paradise, NV
> Unemployment rate, July 2020: 16.3%
> Year-to-date employment change: -17.1%
> Poverty rate: 13.9%
> Population: 2,231,647
The COVID-19 recession hit the job market in the Las Vegas metro area harder than most of the country. Tourism, one of the industries most affected by the pandemic, is the backbone of the local economy. Partially as a result, since the beginning of the year, the number of people working in Las Vegas fell by 17.1%. Over the same period, the unemployment rate spiked from just 3.8% to a staggering 16.3% as of July.
Still, as is the case in much of the country, the Las Vegas job market does appear to be improving. As recently as April, the area’s unemployment rate was 34.2%, making the city one of only four nationwide where more than one in every three members of the labor force were unemployed.
[in-text-ad]

9. Bakersfield, CA
> Unemployment rate, July 2020: 16.4%
> Year-to-date employment change: -15.9%
> Poverty rate: 20.6%
> Population: 896,764
There are 58,000 fewer people working in Bakersfield then there were at the beginning of 2020. Layoffs, spurred by the COVID-19 pandemic, drove the local unemployment rate up to 16.4% in July from 7.4% in January.
Bakersfield’s unemployment is causing further economic harm to residents of a metro area where financial hardship was relatively common to begin with. In Bakersfield, 20.6% of the population lives below the poverty line, compared with 13.1% of Americans nationwide, and 17.3% of households received food stamps, well above the 11.3% national average.
8. East Stroudsburg, PA
> Unemployment rate, July 2020: 17.4%
> Year-to-date employment change: -16.6%
> Poverty rate: 12.3%
> Population: 169,507
The economy of East Stroudsburg, Pennsylvania, depends on industries highly exposed to slowdown in a pandemic scenario. These industries, which include tourism and transportation and warehousing, account for 27.8% of employment in the metropolitan area — 10 percentage points higher than the average concentration nationwide.
Due in part to the concentration of jobs in these sectors, the area’s unemployment rate of 17.4% is considerably higher than average. One year ago — in July 2019 — the metro area’s unemployment rate was just 5.3%.

7. Barnstable Town, MA
> Unemployment rate, July 2020: 17.6%
> Year-to-date employment change: -22.5%
> Poverty rate: 7.6%
> Population: 213,413
Barnstable Town metro area’s unemployment rate stands at 17.6%, higher than all but one other metro area in New England. The region includes Cape Cod, and the area’s economy is heavily dependent on tourism, one of the industries that has borne the brunt of the economic fallout during the COVID-19 pandemic. There are about 28,000 fewer jobs in the area than there were at the beginning of the year, a 22.5% decline in employment.
[in-text-ad-2]
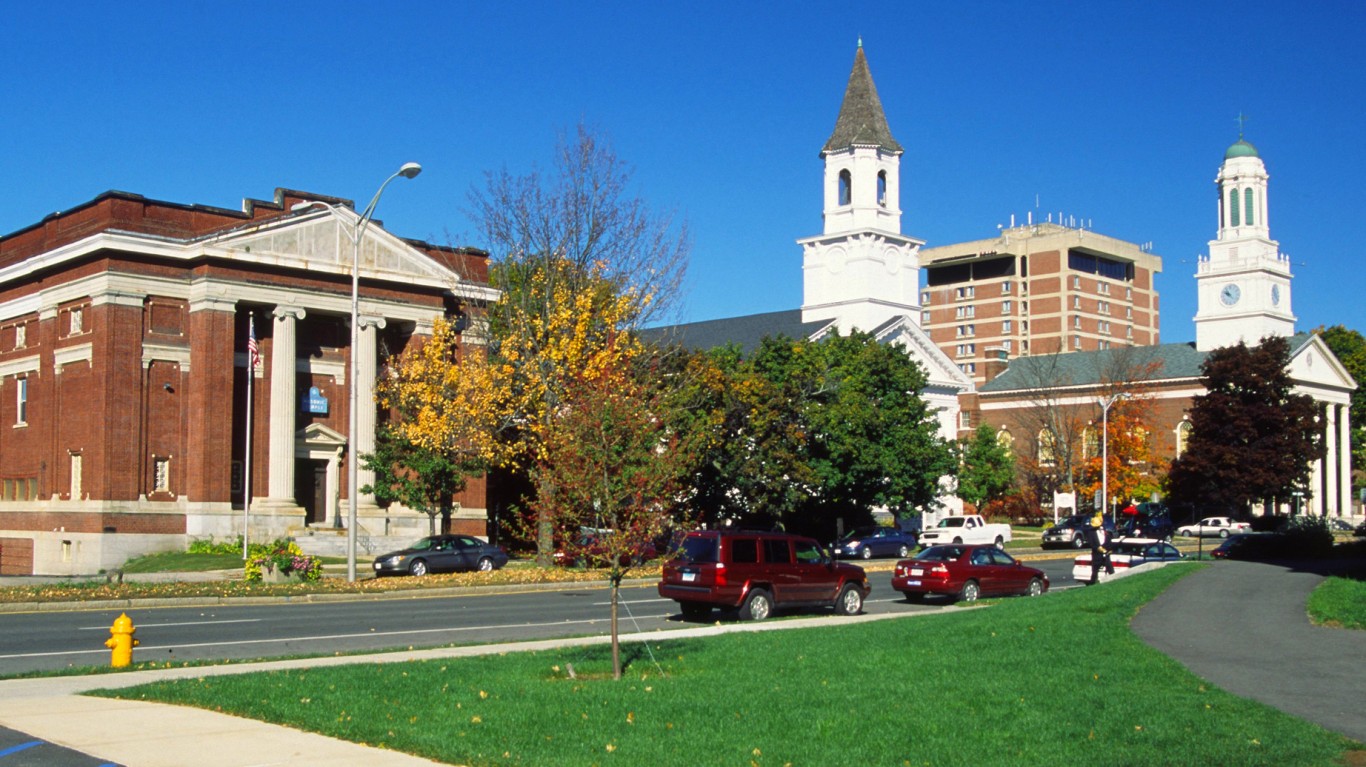
6. Pittsfield, MA
> Unemployment rate, July 2020: 17.8%
> Year-to-date employment change: -19.1%
> Poverty rate: 10.8%
> Population: 126,348
Nearly every corner of the country was devastated by rapid job losses in April as the novel coronavirus shut down much of the economy. Since then, however, businesses have reopened, jobs have steadily returned, and the unemployment rate declined to 10.2% nationwide from a height of 14.7% in April. The improvement has not been even, however. In Pittsfield, Massachusetts, the jobless rate stands at 17.8%, exactly where it was in April — though it has had some ups and downs in between.
Before the pandemic, Pittsfield had a healthy job market with a 3.4% unemployment rate in each of the first three months of 2020.
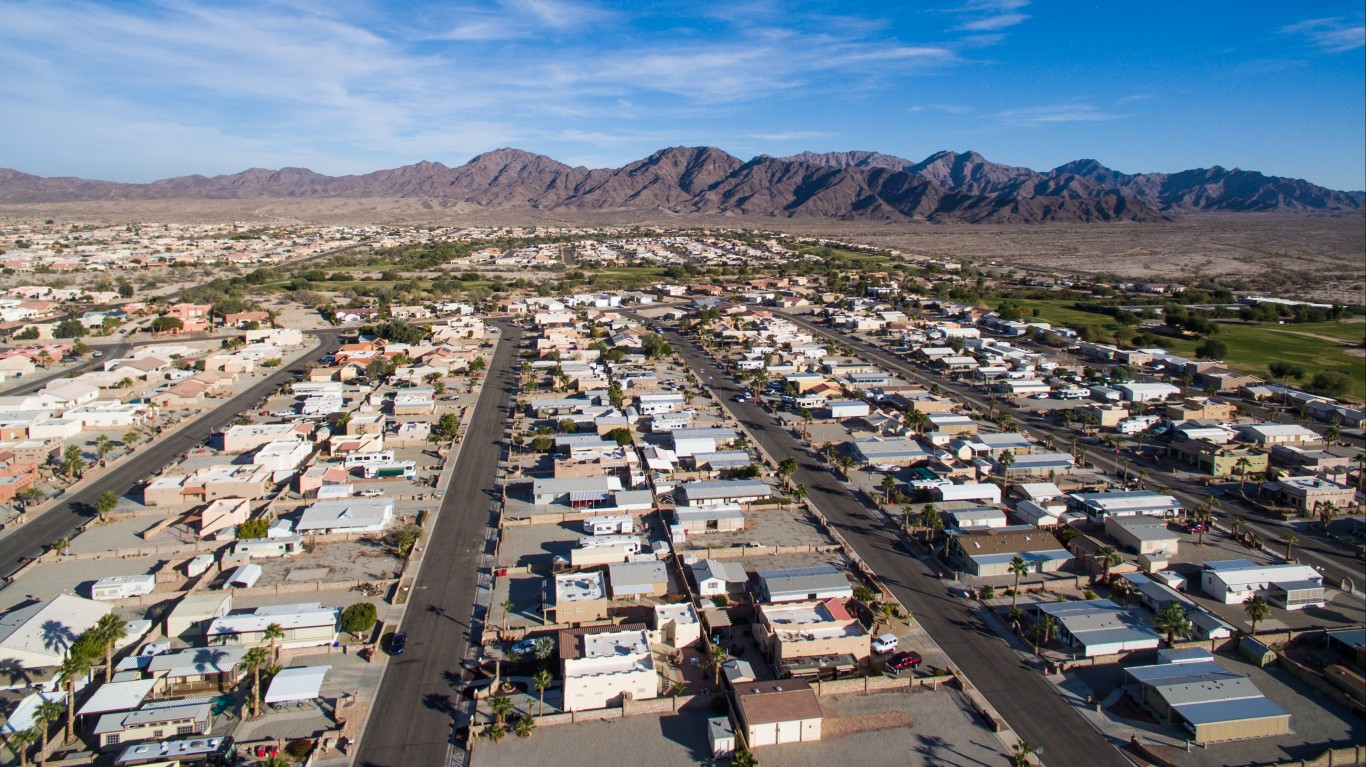
5. Yuma, AZ
> Unemployment rate, July 2020: 20.5%
> Year-to-date employment change: -7.1%
> Poverty rate: 19.6%
> Population: 212,128
Unlike many other cities on this list, the elevated unemployment level in Yuma, Arizona predates COVID-19. At the beginning of the year, the area’s unemployment rate was 16.5%, higher than all but one metro area — El Centro, California — in the country. Yuma’s jobless rate reached 25.0% in April, and it now stands at 20.5%, 4 percentage points higher than in January.
While COVID-19 appears to have had a smaller than typical impact on Yuma’s economy, it has taken a considerable toll on the metro area’s public health. There have been 5,930 known cases of COVID-19 for every 100,000 people in Yuma to date, the highest concentration of any metro area in the country.
[in-text-ad]

4. Kahului-Wailuku-Lahaina, HI
> Unemployment rate, July 2020: 21.3%
> Year-to-date employment change: -24.5%
> Poverty rate: 7.1%
> Population: 167,295
Few sectors of the economy have been hit as hard by the COVID-19 pandemic as tourism. For Hawaii’s Kahului-Wailuku-Lahaina metro area, where tourism is an economic backbone, overall employment has fallen by a staggering 24.5% since January, just before the pandemic hit. Currently, the metro area is one of only five nationwide where more than one in every five members of the labor force are out of work.
From January through July 2020, Hawaii reported just 2.1 million visitors by air and less than 30,000 by cruise ship, a 64.7% and 61.3% decline from the same period in 2019, respectively.
3. Ocean City, NJ
> Unemployment rate, July 2020: 22.8%
> Year-to-date employment change: -34.9%
> Poverty rate: 9.4%
> Population: 92,560
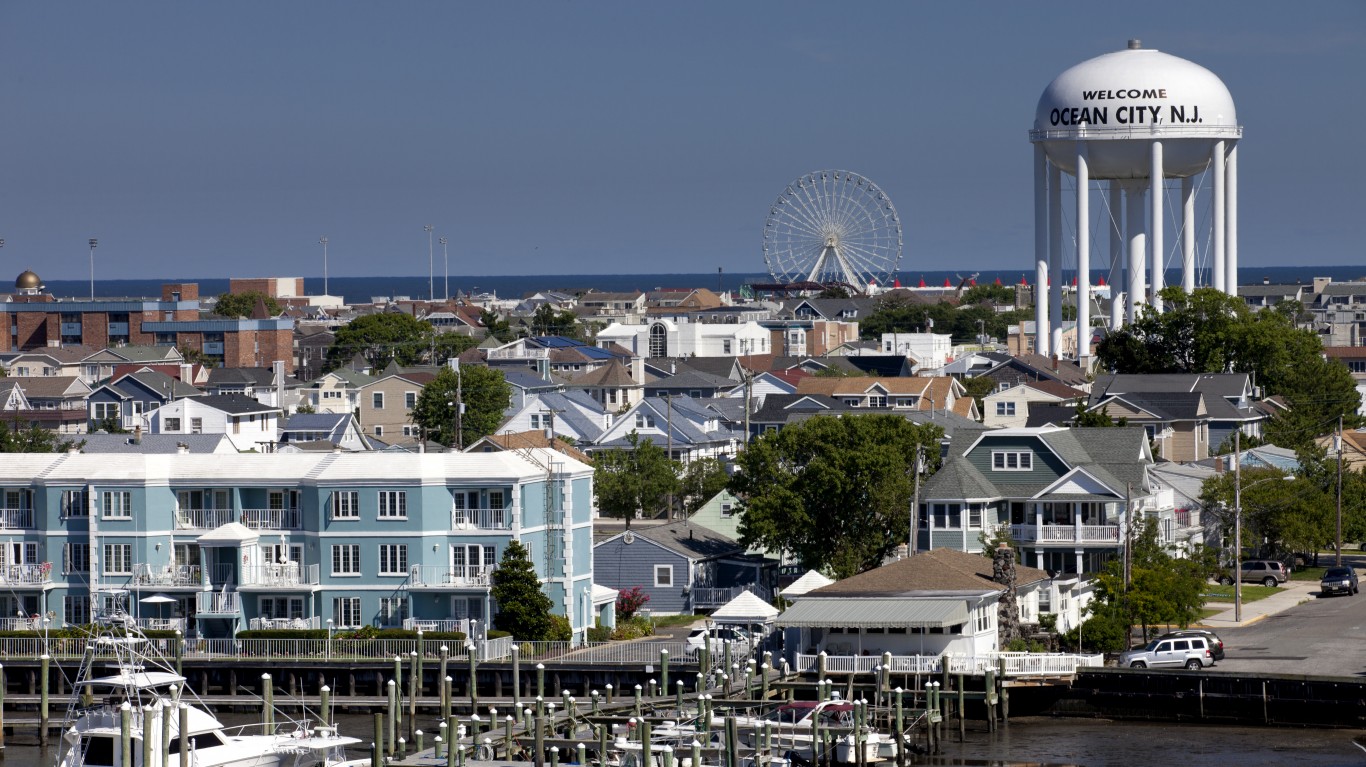
Ocean City, one of the smallest metro areas in the country, is one of only five nationwide where more than one in every five members of the labor force are out of work. The metro area of the Jersey Shore town is one several on this list that depends on tourism — an industry that has all but shut down in the first few months of the COVID-19 pandemic. The number of people working in the Ocean City metro area has fallen by over one-third since the beginning of the year, by far the largest year-to-date decline in employment of any U.S. metro area.

2. Atlantic City-Hammonton, NJ
> Unemployment rate, July 2020: 24.6%
> Year-to-date employment change: -18.5%
> Poverty rate: 12.9%
> Population: 265,429
Atlantic City, one of several New Jersey metro areas to rank on this list, has nearly the highest unemployment rate in the United States, at 24.6% — more than double the national jobless rate of 10.2%. Tourism, an industry that has been all but shut down during the first few months of the pandemic, is an economic pillar in Atlantic City. The leisure and hospitality sector accounts for about one-third of all jobs in the metro area. Since January, 18.5% of jobs in Atlantic City have disappeared.
The metro area’s current unemployment crisis is a marked improvement from one month ago. Before Atlantic City casinos reopened in July, unemployment hovered over 30% through April, May, and June.
[in-text-ad-2]
1. El Centro, CA
> Unemployment rate, July 2020: 25.8%
> Year-to-date employment change: -6.3%
> Poverty rate: 23.1%
> Population: 181,827
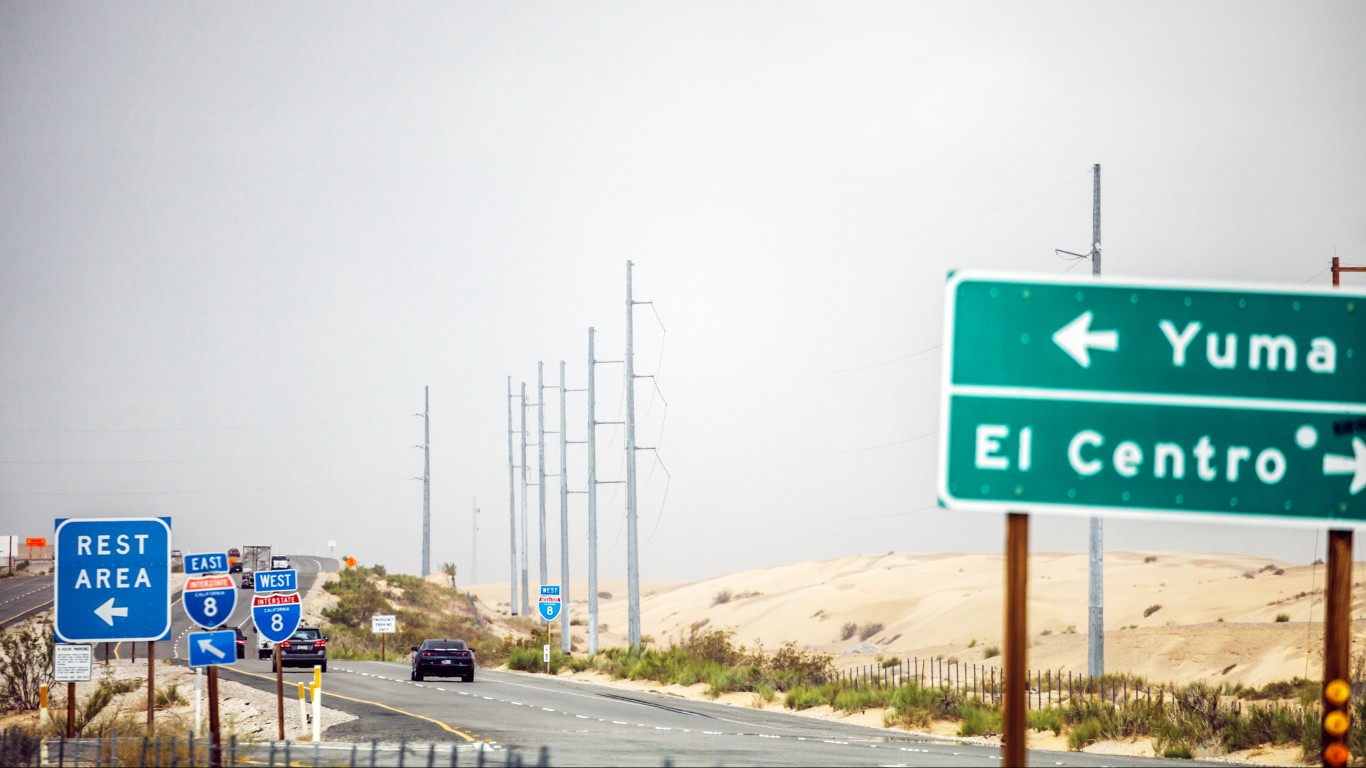
The unemployment rate in El Centro, California, of 25.8% is the highest among U.S. metro areas. Though the metro area has shed thousands of jobs during the COVID-19 pandemic, it was struggling with high unemployment before the coronavirus-induced recession. In January, El Centro’s jobless rate stood at 18.4%, higher than every other metro area at the time. In El Centro, 9.6% of households live on less than $10,000 a year, compared with the national average of 6.3%, and 19.8% of households receive food stamps, well above the U.S. average of 11.3%.
In addition to weakening El Centro’s already struggling economy, COVID-19 has also taken a public health toll in the metro area. The area reported 5,633 known cases of the virus for every 100,000 people, the second-highest concentration in the country.
Methodology
To identify the cities with the worst unemployment problem right now, 24/7 Wall St. reviewed seasonally adjusted July 2020 unemployment rates at the metropolitan area level from the Bureau of Labor Statistics. We only listed the 35 U.S. metro areas with the highest unemployment rates.
In the case of a tie, the metro area that had a larger percentage decline in overall employment from January to July 2020 was ranked lower. Overall employment figures also came from the BLS.
Data on COVID-19 cases and cases per capita is current as of Sept. 6, 2020, and came from state and local health departments.
Data on population and poverty came from the U.S. Census Bureau’s 2018 American Community Survey.
Thank you for reading! Have some feedback for us?
Contact the 24/7 Wall St. editorial team.