The U.S. reported over 64,000 new cases of coronavirus on Feb. 17, bringing the total count to more than 27,400,000 confirmed cases of COVID-19. There have been more than 470,000 COVID-19-related deaths — the highest death toll of any country.
New cases continue to rise, albeit at a slowing rate. In the past week, there were an average of 27.8 daily new coronavirus cases per 100,000 Americans — a decrease from the week prior, when there were an average of 39 daily new coronavirus cases per 100,000 people.
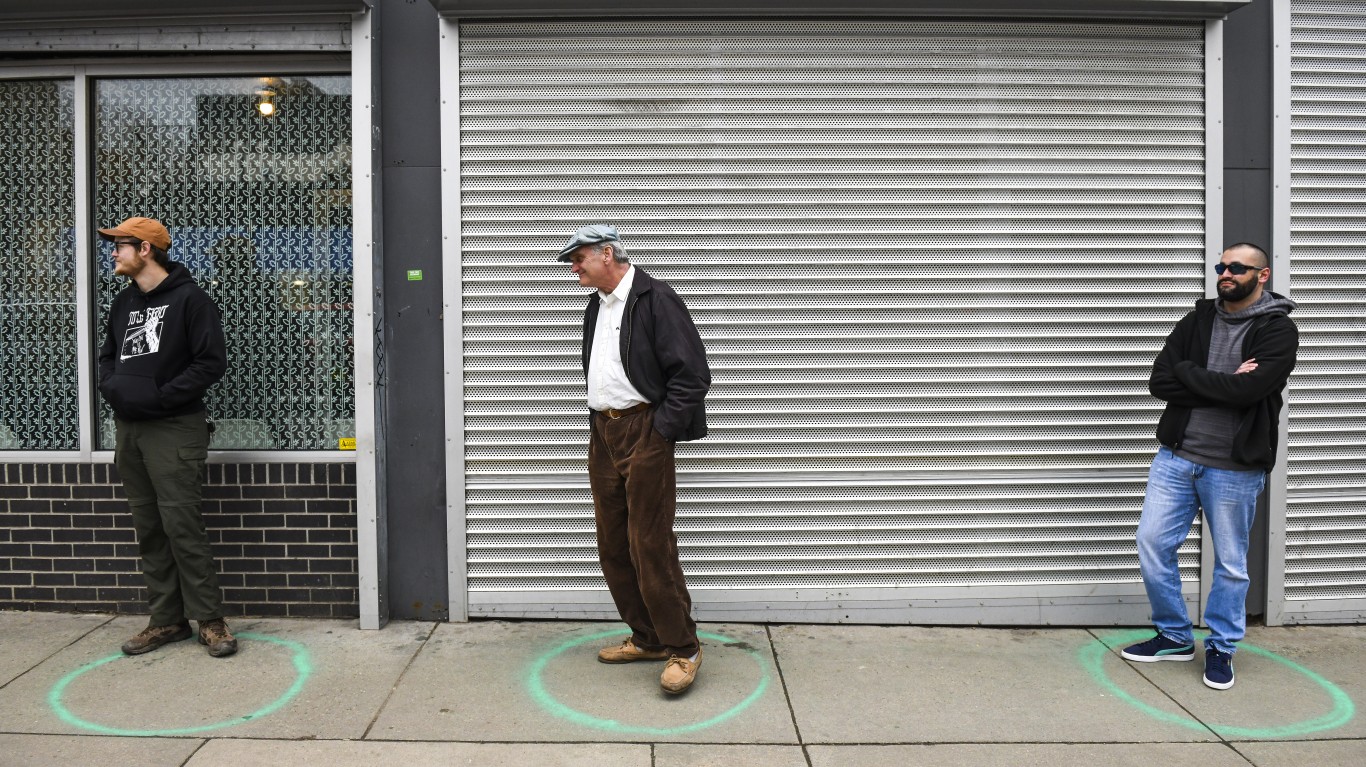
While new data shows that the risk of contracting COVID-19 is high in almost every part of the country, cities continue to be the sites of major outbreaks and superspreader events. Experts agree that the virus is more likely to spread in group settings where large numbers of people routinely have close contact with one another, such as colleges, nursing homes, bars, and restaurants. Metropolitan areas with a high degree of connectivity between different neighborhoods and a large population may be particularly at-risk.
The metro areas with the lowest incidence of COVID-19 cases are distributed relatively unevenly across the United States. Of the 50 metro areas with the lowest case counts per capita, 26 are in the West, 12 are in the Northeast, six are in the South, and six are in the Midwest.
The five metro areas with the smallest number of coronavirus cases per capita are: Kahului-Wailuku-Lahaina, HI; Bremerton-Silverdale-Port Orchard, WA; Urban Honolulu, HI; Bangor, ME; and Corvallis, OR. The incidence of COVID-19 in these metro areas range from 1,266.9 cases per 100,000 to 2,448.2 cases per 100,000. For comparison, there are currently 8,511.6 cases per 100,000 Americans nationwide.
The 50 cities with the lowest incidence of COVID-19 have more than 4,000 fewer coronavirus cases per capita than the U.S. as a whole, but cases are still growing at a steady pace. There were an average of 16.7 daily new coronavirus cases per 100,000 people in the week ending Feb. 17, roughly unchanged from the week prior, when there were an average of 21.2 daily new coronavirus cases per 100,000 people. In 46 of the 50 cities with the lowest COVID-19 incidence, new cases are rising at a slowing rate.
To determine the cities with the fewest COVID-19 cases, 24/7 Wall St. compiled and reviewed data from state and local health departments. We ranked metro areas based on the number of confirmed COVID-19 cases per 100,000 residents as of Feb. 17.To estimate the incidence of COVID-19 at the metropolitan level, we aggregated data from the county level using boundary definitions from the U.S. Census Bureau. Population data used to adjust case and death totals came from the U.S. Census Bureau’s 2018 American Community Survey and are five-year estimates. Unemployment data is from the Bureau of Labor Statistics and is seasonally adjusted.

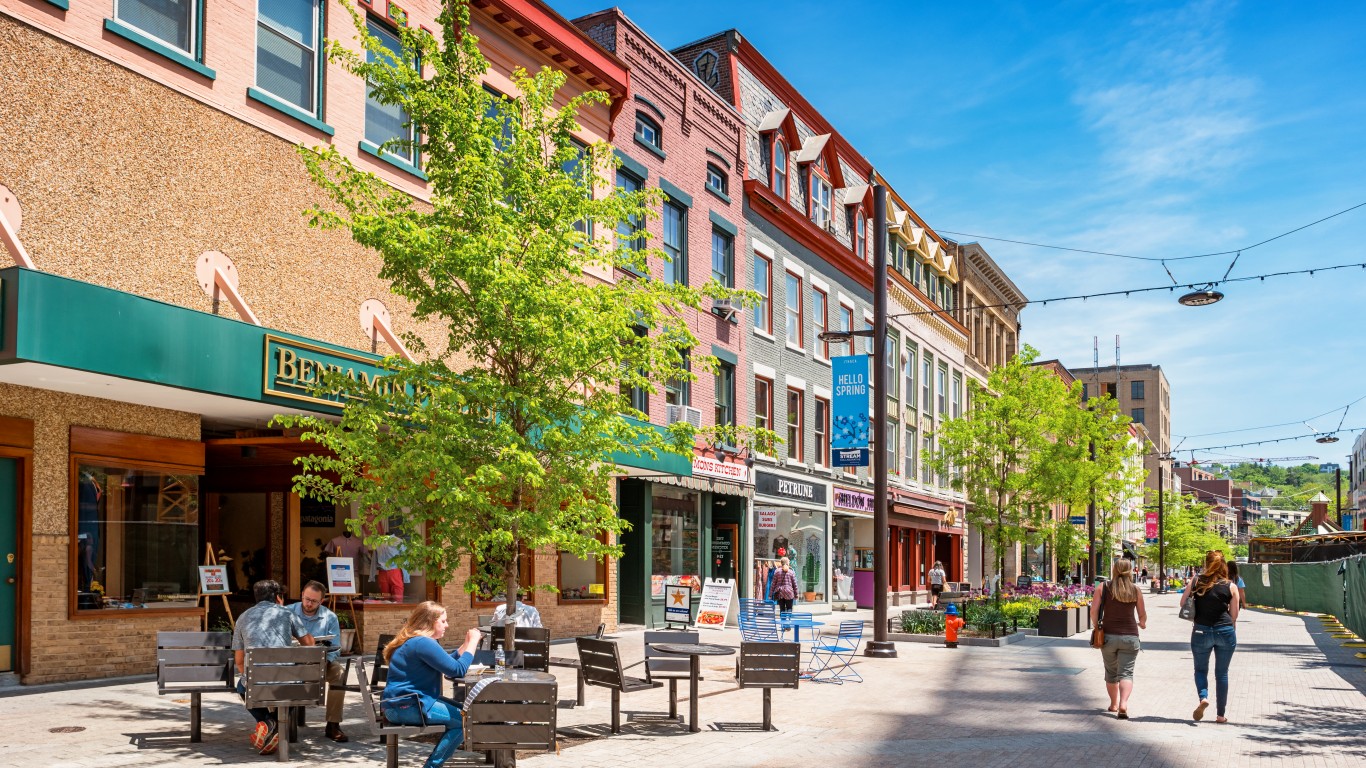
50. Albany-Schenectady-Troy, NY
> Confirmed COVID-19 cases as of Feb. 17: 51,859
> Confirmed COVID-19 cases as of Feb. 17 per 100,000 residents: 5,889.8
> Cumulative COVID-19 deaths as of Feb. 17: 773
> Cumulative COVID-19 deaths as of Feb. 17 per 100,000 residents: 87.8
> Population: 880,481

49. Detroit-Warren-Dearborn, MI
> Confirmed COVID-19 cases as of Feb. 17: 254,220
> Confirmed COVID-19 cases as of Feb. 17 per 100,000 residents: 5,888.6
> Cumulative COVID-19 deaths as of Feb. 17: 8,475
> Cumulative COVID-19 deaths as of Feb. 17 per 100,000 residents: 196.3
> Population: 4,317,179

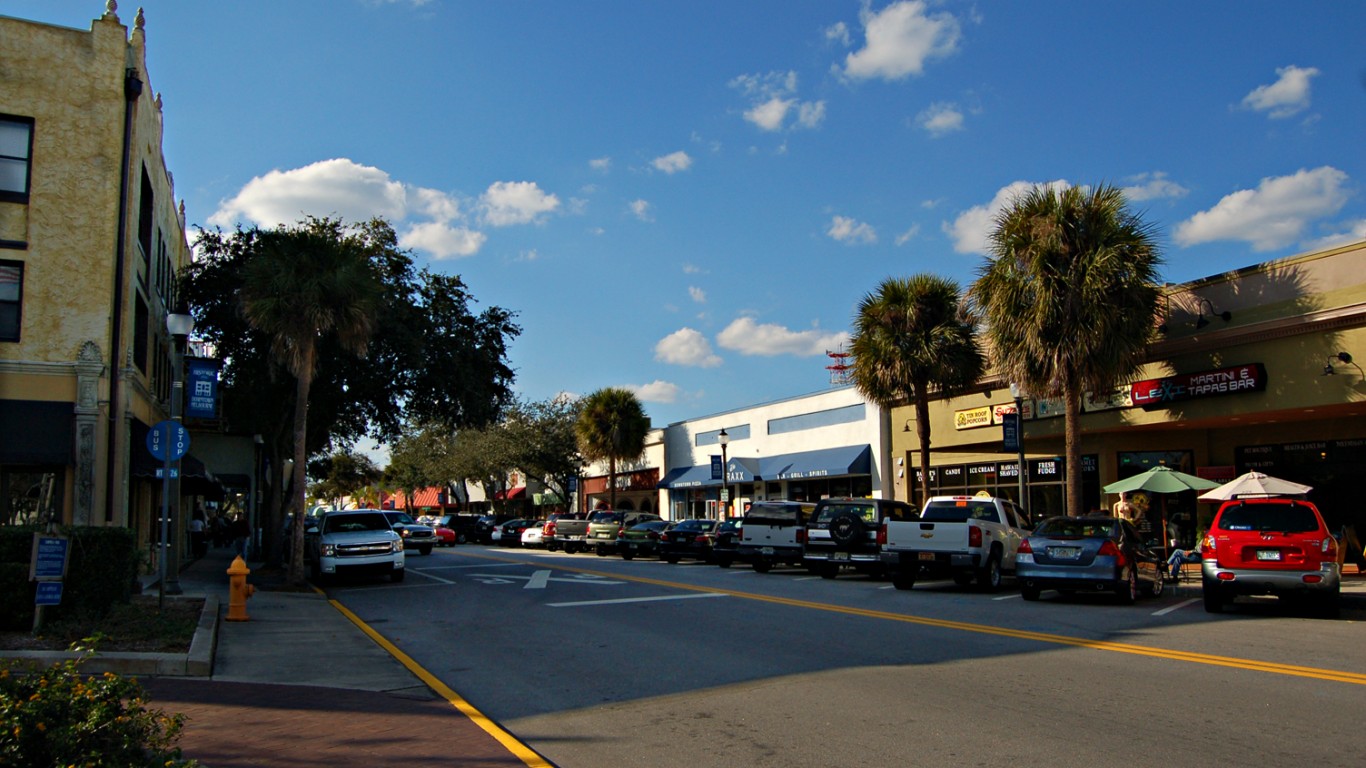
48. Punta Gorda, FL
> Confirmed COVID-19 cases as of Feb. 17: 10,393
> Confirmed COVID-19 cases as of Feb. 17 per 100,000 residents: 5,873.3
> Cumulative COVID-19 deaths as of Feb. 17: 338
> Cumulative COVID-19 deaths as of Feb. 17 per 100,000 residents: 191
> Population: 176,954
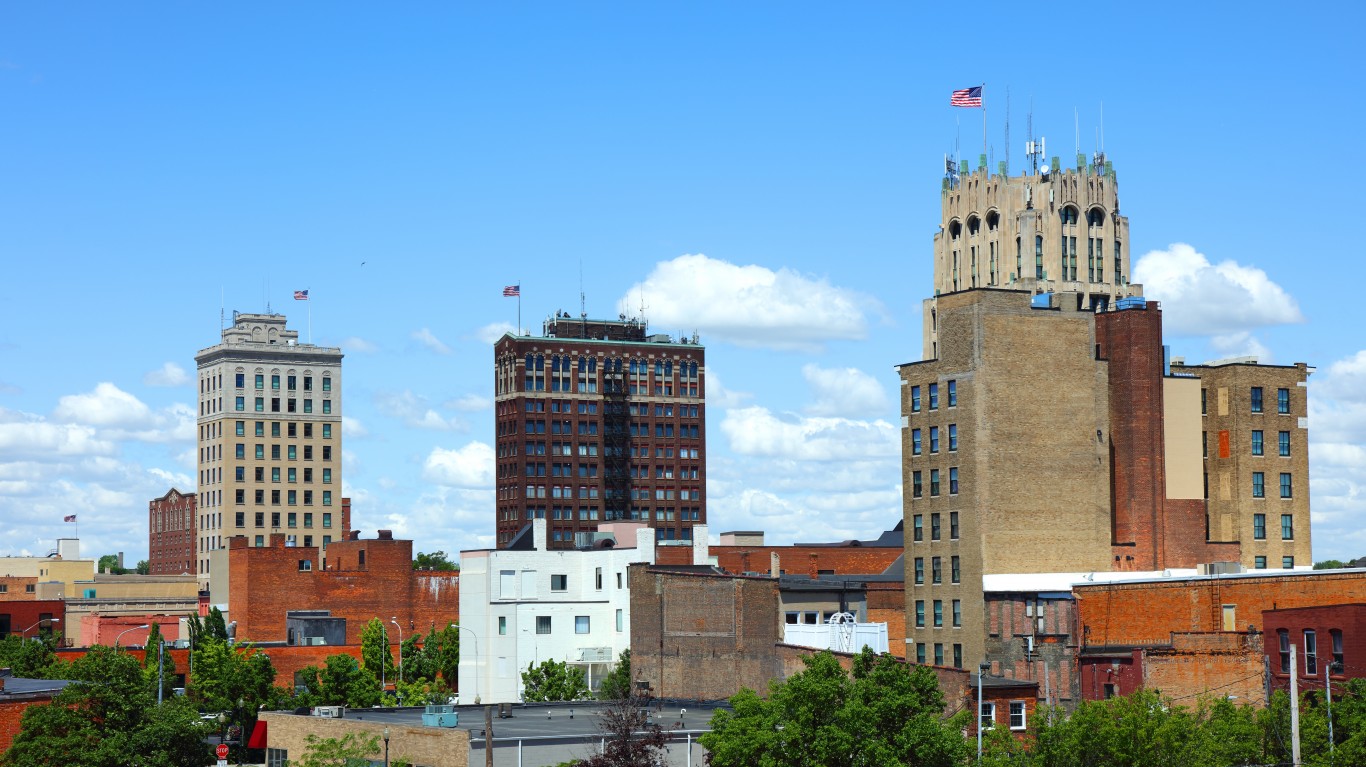
47. Jackson, MI
> Confirmed COVID-19 cases as of Feb. 17: 9,326
> Confirmed COVID-19 cases as of Feb. 17 per 100,000 residents: 5,868.6
> Cumulative COVID-19 deaths as of Feb. 17: 208
> Cumulative COVID-19 deaths as of Feb. 17 per 100,000 residents: 130.9
> Population: 158,913

46. Midland, MI
> Confirmed COVID-19 cases as of Feb. 17: 4,889
> Confirmed COVID-19 cases as of Feb. 17 per 100,000 residents: 5,862.9
> Cumulative COVID-19 deaths as of Feb. 17: 64
> Cumulative COVID-19 deaths as of Feb. 17 per 100,000 residents: 76.7
> Population: 83,389

45. Baltimore-Columbia-Towson, MD
> Confirmed COVID-19 cases as of Feb. 17: 161,315
> Confirmed COVID-19 cases as of Feb. 17 per 100,000 residents: 5,775.2
> Cumulative COVID-19 deaths as of Feb. 17: 3,295
> Cumulative COVID-19 deaths as of Feb. 17 per 100,000 residents: 118
> Population: 2,793,250

44. Sacramento-Roseville-Folsom, CA
> Confirmed COVID-19 cases as of Feb. 17: 131,906
> Confirmed COVID-19 cases as of Feb. 17 per 100,000 residents: 5,755.7
> Cumulative COVID-19 deaths as of Feb. 17: 1,868
> Cumulative COVID-19 deaths as of Feb. 17 per 100,000 residents: 81.5
> Population: 2,291,738

43. San Jose-Sunnyvale-Santa Clara, CA
> Confirmed COVID-19 cases as of Feb. 17: 113,413
> Confirmed COVID-19 cases as of Feb. 17 per 100,000 residents: 5,723.3
> Cumulative COVID-19 deaths as of Feb. 17: 1,726
> Cumulative COVID-19 deaths as of Feb. 17 per 100,000 residents: 87.1
> Population: 1,981,616

42. Boulder, CO
> Confirmed COVID-19 cases as of Feb. 17: 18,158
> Confirmed COVID-19 cases as of Feb. 17 per 100,000 residents: 5,656.2
> Cumulative COVID-19 deaths as of Feb. 17: 223
> Cumulative COVID-19 deaths as of Feb. 17 per 100,000 residents: 69.5
> Population: 321,030
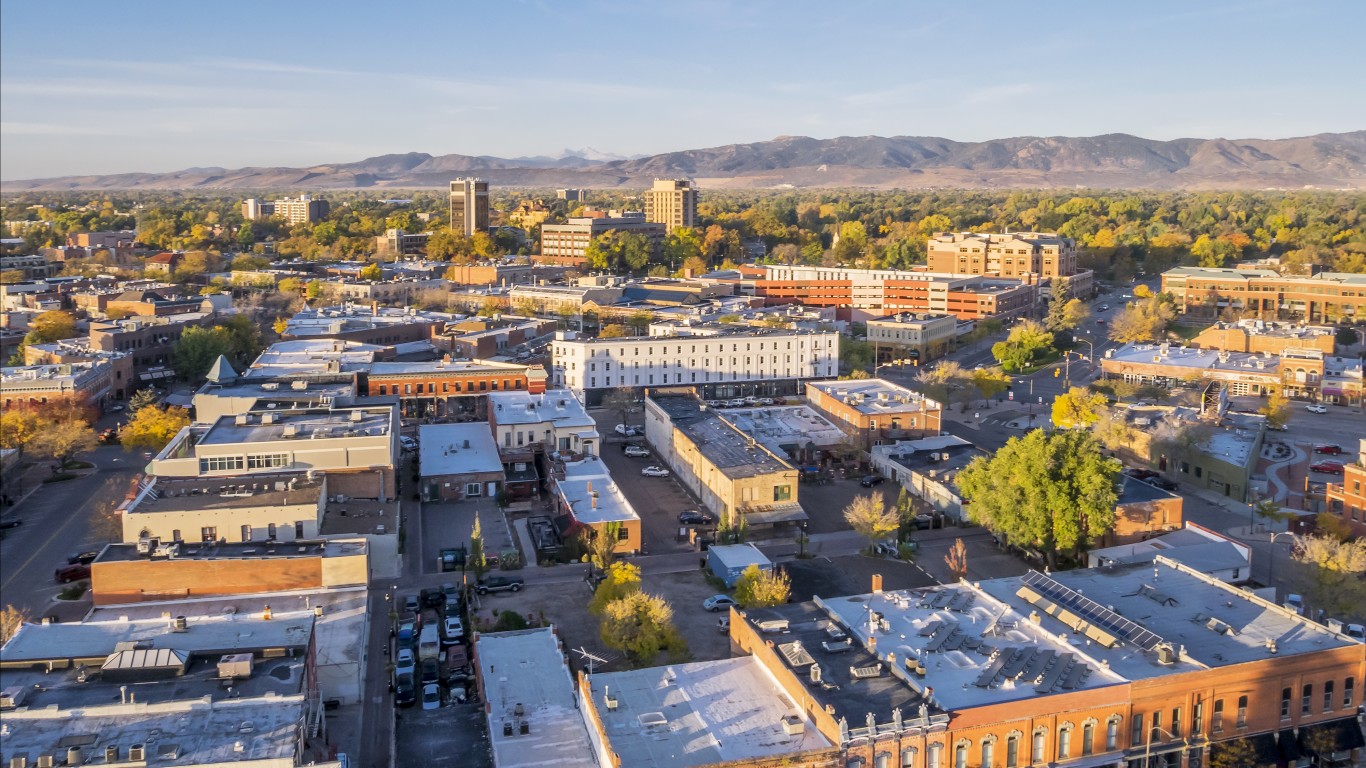
41. Fort Collins, CO
> Confirmed COVID-19 cases as of Feb. 17: 19,120
> Confirmed COVID-19 cases as of Feb. 17 per 100,000 residents: 5,654.1
> Cumulative COVID-19 deaths as of Feb. 17: 214
> Cumulative COVID-19 deaths as of Feb. 17 per 100,000 residents: 63.3
> Population: 338,161

40. Lansing-East Lansing, MI
> Confirmed COVID-19 cases as of Feb. 17: 30,760
> Confirmed COVID-19 cases as of Feb. 17 per 100,000 residents: 5,642.9
> Cumulative COVID-19 deaths as of Feb. 17: 562
> Cumulative COVID-19 deaths as of Feb. 17 per 100,000 residents: 103.1
> Population: 545,108
39. Palm Bay-Melbourne-Titusville, FL
> Confirmed COVID-19 cases as of Feb. 17: 32,445
> Confirmed COVID-19 cases as of Feb. 17 per 100,000 residents: 5,624.9
> Cumulative COVID-19 deaths as of Feb. 17: 710
> Cumulative COVID-19 deaths as of Feb. 17 per 100,000 residents: 123.1
> Population: 576,808
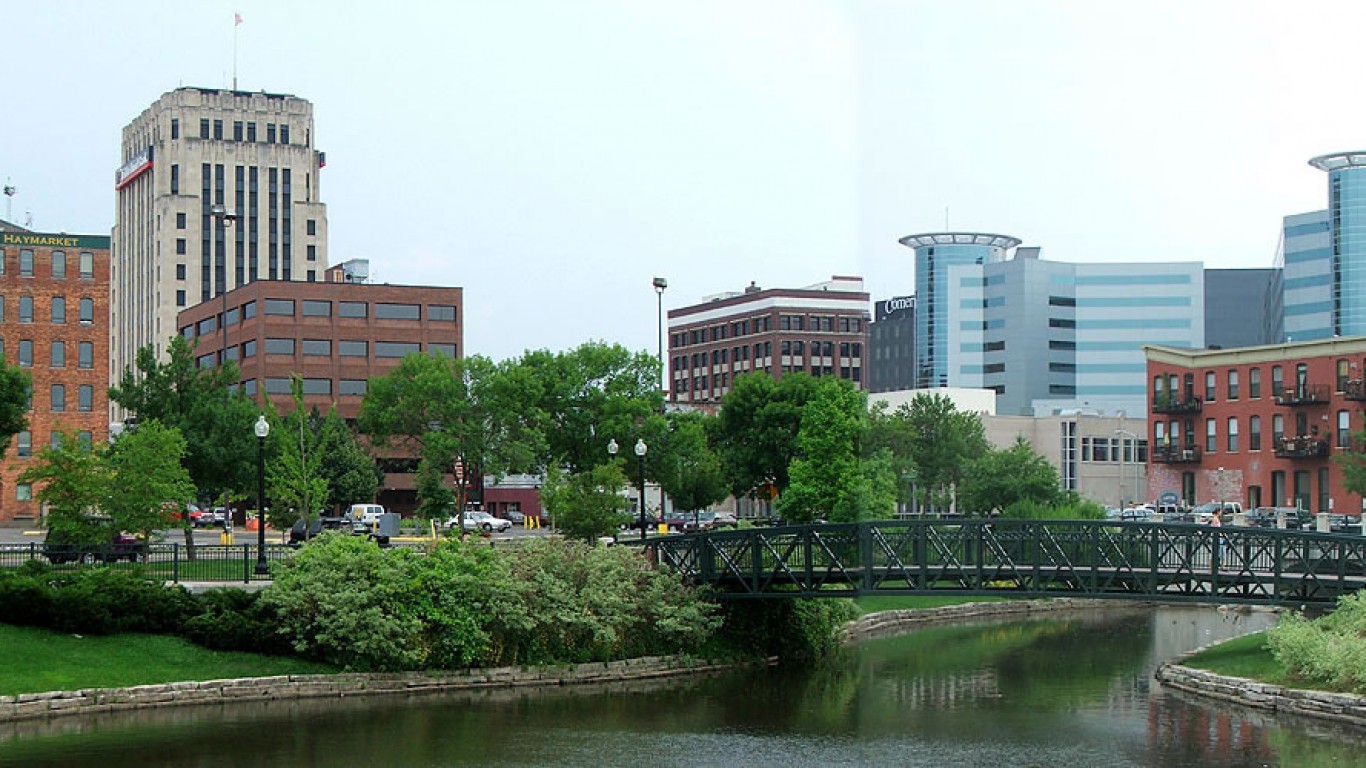
38. Kalamazoo-Portage, MI
> Confirmed COVID-19 cases as of Feb. 17: 14,656
> Confirmed COVID-19 cases as of Feb. 17 per 100,000 residents: 5,603.0
> Cumulative COVID-19 deaths as of Feb. 17: 316
> Cumulative COVID-19 deaths as of Feb. 17 per 100,000 residents: 120.8
> Population: 261,573
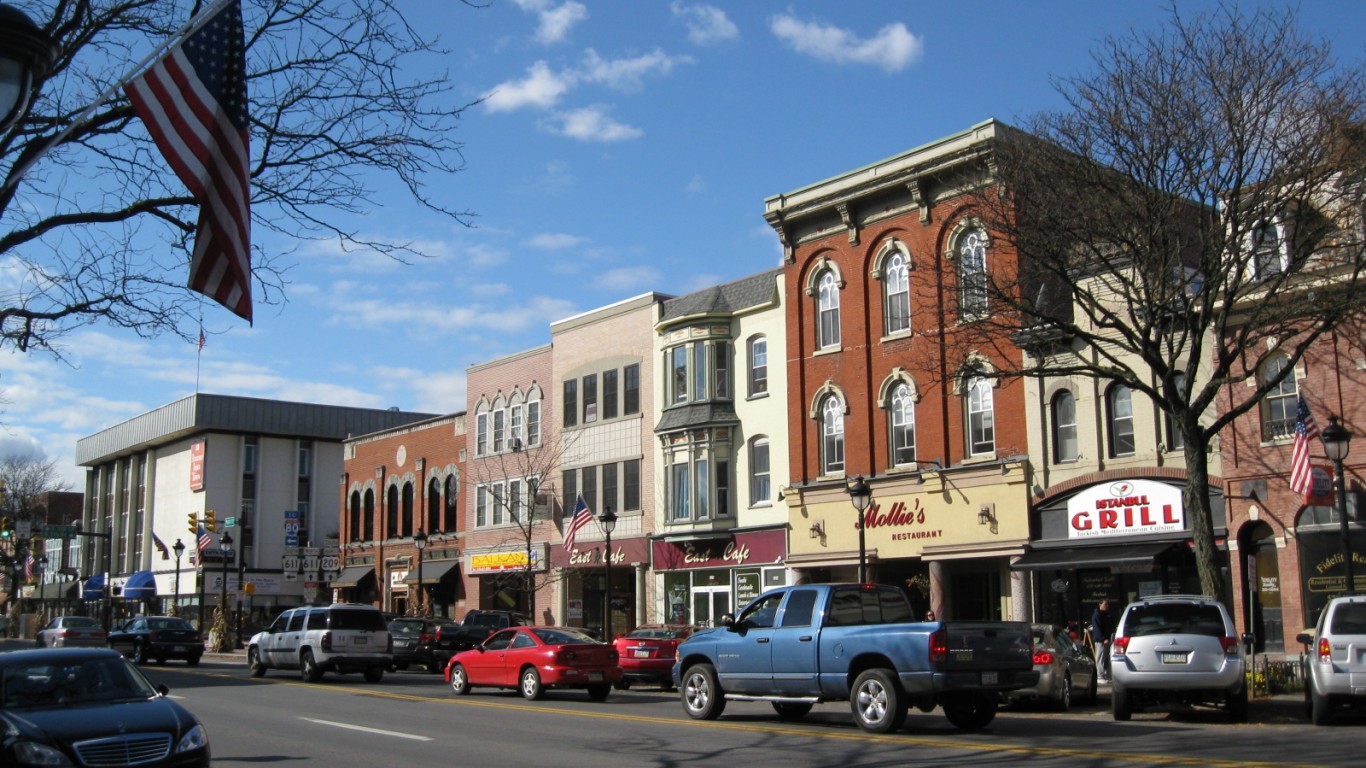
37. East Stroudsburg, PA
> Confirmed COVID-19 cases as of Feb. 17: 9,273
> Confirmed COVID-19 cases as of Feb. 17 per 100,000 residents: 5,533.3
> Cumulative COVID-19 deaths as of Feb. 17: 259
> Cumulative COVID-19 deaths as of Feb. 17 per 100,000 residents: 154.5
> Population: 167,586
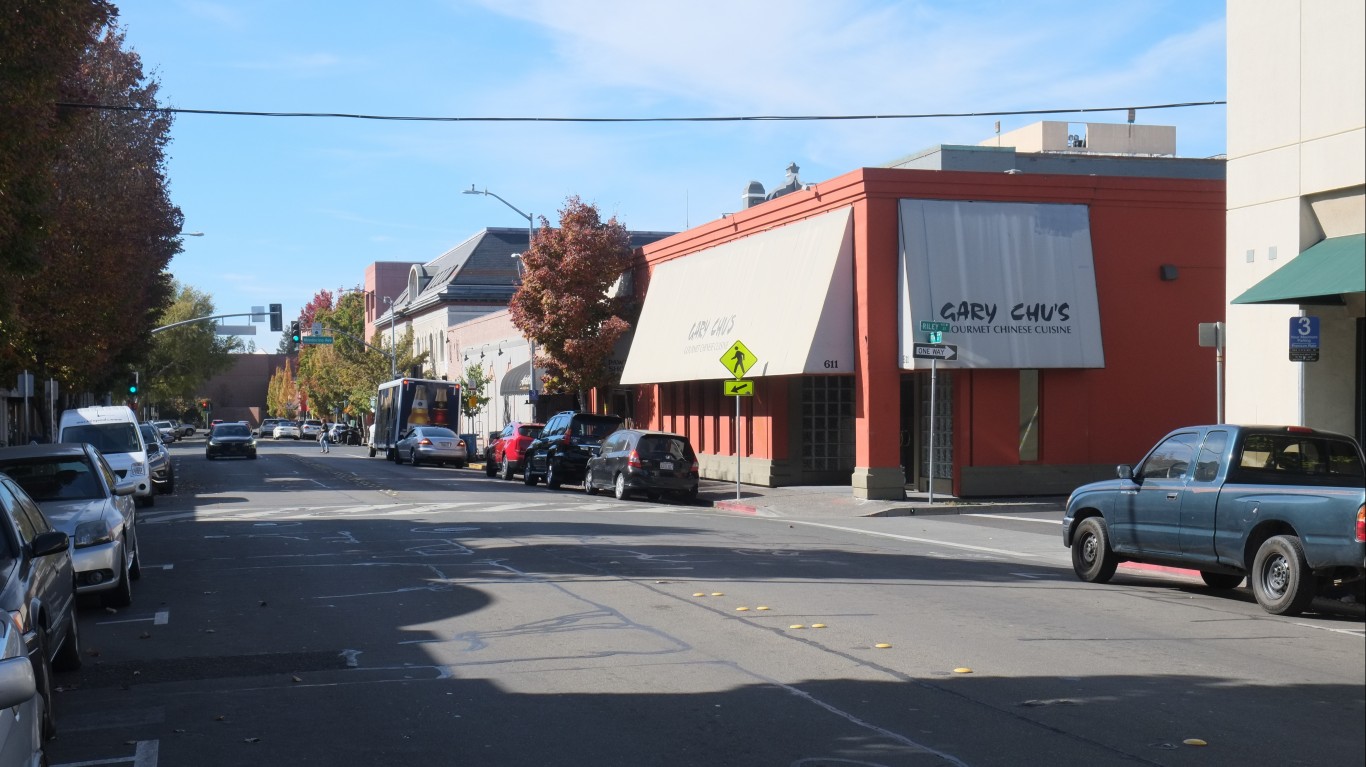
36. Santa Rosa-Petaluma, CA
> Confirmed COVID-19 cases as of Feb. 17: 27,380
> Confirmed COVID-19 cases as of Feb. 17 per 100,000 residents: 5,461.6
> Cumulative COVID-19 deaths as of Feb. 17: 287
> Cumulative COVID-19 deaths as of Feb. 17 per 100,000 residents: 57.2
> Population: 501,317

35. Kingston, NY
> Confirmed COVID-19 cases as of Feb. 17: 9,569
> Confirmed COVID-19 cases as of Feb. 17 per 100,000 residents: 5,336.8
> Cumulative COVID-19 deaths as of Feb. 17: 224
> Cumulative COVID-19 deaths as of Feb. 17 per 100,000 residents: 124.9
> Population: 179,303

34. Santa Cruz-Watsonville, CA
> Confirmed COVID-19 cases as of Feb. 17: 14,256
> Confirmed COVID-19 cases as of Feb. 17 per 100,000 residents: 5,207.4
> Cumulative COVID-19 deaths as of Feb. 17: 170
> Cumulative COVID-19 deaths as of Feb. 17 per 100,000 residents: 62.1
> Population: 273,765
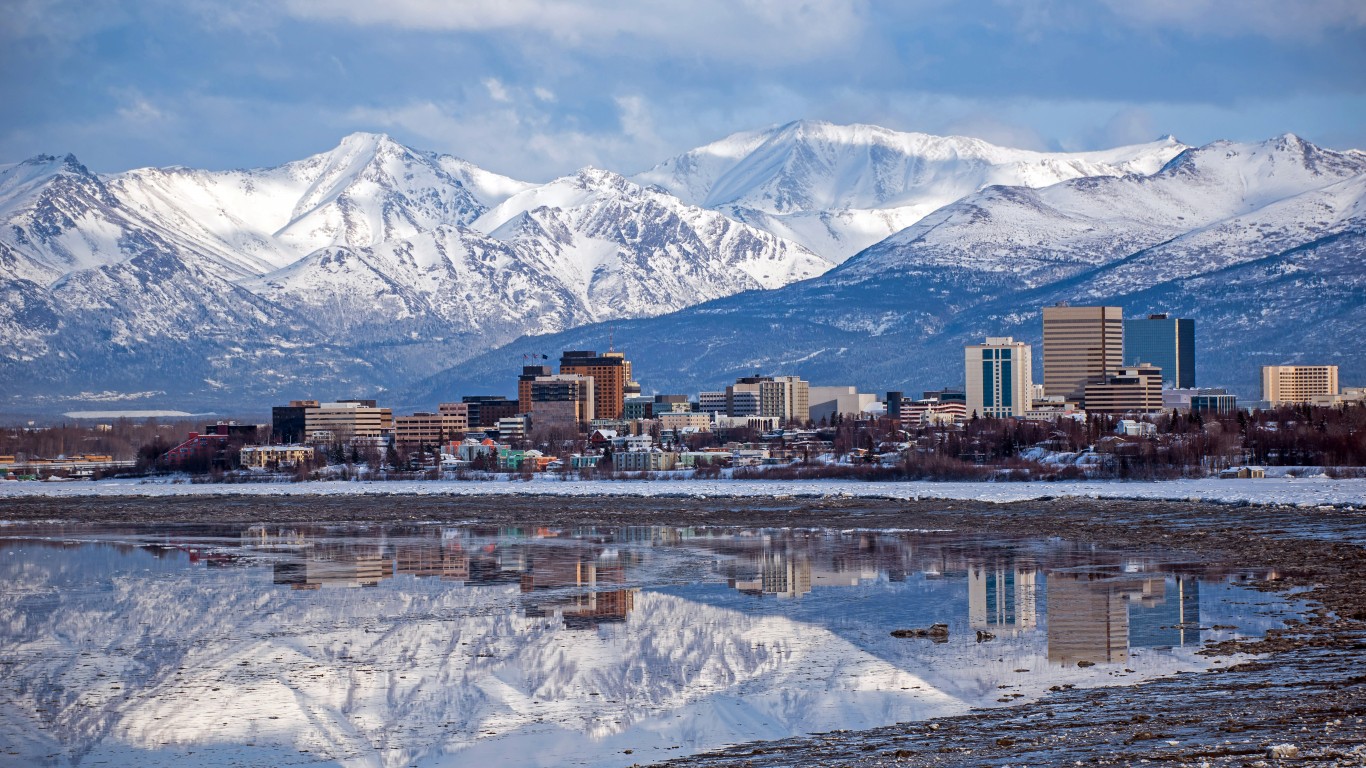
33. Anchorage, AK
> Confirmed COVID-19 cases as of Feb. 17: 20,248
> Confirmed COVID-19 cases as of Feb. 17 per 100,000 residents: 5,067.4
> Cumulative COVID-19 deaths as of Feb. 17: 188
> Cumulative COVID-19 deaths as of Feb. 17 per 100,000 residents: 47
> Population: 399,576
These are all the counties in Alaska where COVID-19 is slowing (and where it’s still getting worse).

32. Salem, OR
> Confirmed COVID-19 cases as of Feb. 17: 20,965
> Confirmed COVID-19 cases as of Feb. 17 per 100,000 residents: 5,027.8
> Cumulative COVID-19 deaths as of Feb. 17: 320
> Cumulative COVID-19 deaths as of Feb. 17 per 100,000 residents: 76.7
> Population: 416,980
These are all the counties in Oregon where COVID-19 is slowing (and where it’s still getting worse).
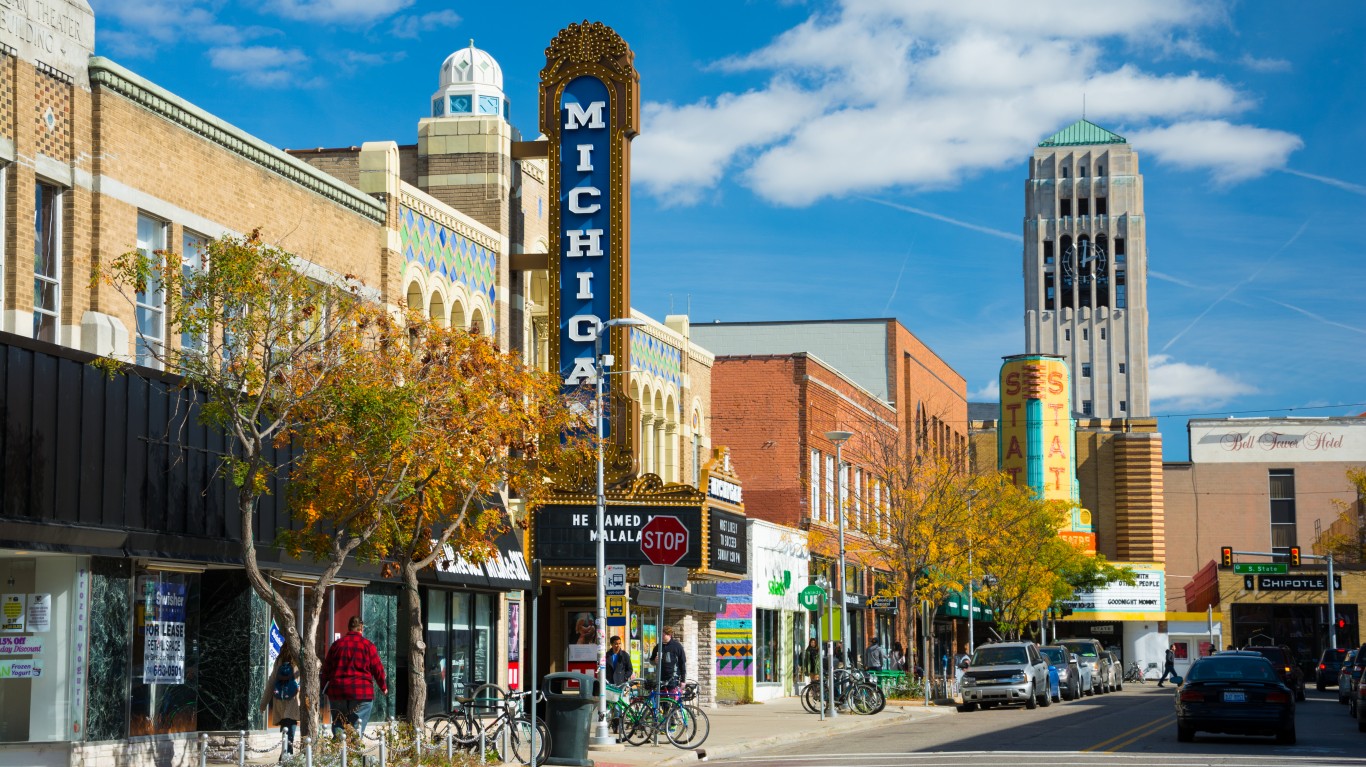
31. Ann Arbor, MI
> Confirmed COVID-19 cases as of Feb. 17: 18,064
> Confirmed COVID-19 cases as of Feb. 17 per 100,000 residents: 4,936.0
> Cumulative COVID-19 deaths as of Feb. 17: 237
> Cumulative COVID-19 deaths as of Feb. 17 per 100,000 residents: 64.8
> Population: 365,961
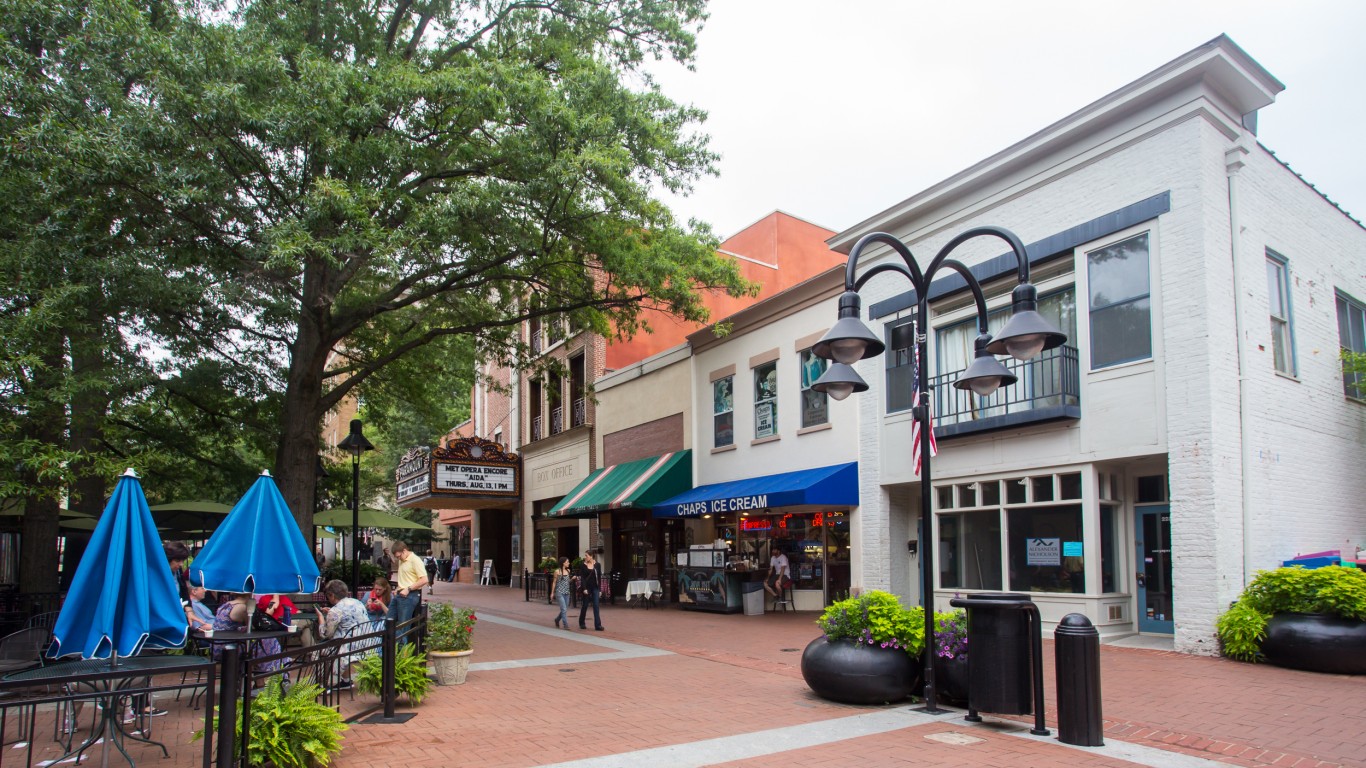
30. Charlottesville, VA
> Confirmed COVID-19 cases as of Feb. 17: 10,424
> Confirmed COVID-19 cases as of Feb. 17 per 100,000 residents: 4,873.3
> Cumulative COVID-19 deaths as of Feb. 17: 104
> Cumulative COVID-19 deaths as of Feb. 17 per 100,000 residents: 48.6
> Population: 213,901

29. San Francisco-Oakland-Berkeley, CA
> Confirmed COVID-19 cases as of Feb. 17: 223,684
> Confirmed COVID-19 cases as of Feb. 17 per 100,000 residents: 4,786.5
> Cumulative COVID-19 deaths as of Feb. 17: 2,785
> Cumulative COVID-19 deaths as of Feb. 17 per 100,000 residents: 59.6
> Population: 4,673,221

28. Chico, CA
> Confirmed COVID-19 cases as of Feb. 17: 10,748
> Confirmed COVID-19 cases as of Feb. 17 per 100,000 residents: 4,733.2
> Cumulative COVID-19 deaths as of Feb. 17: 153
> Cumulative COVID-19 deaths as of Feb. 17 per 100,000 residents: 67.4
> Population: 227,075
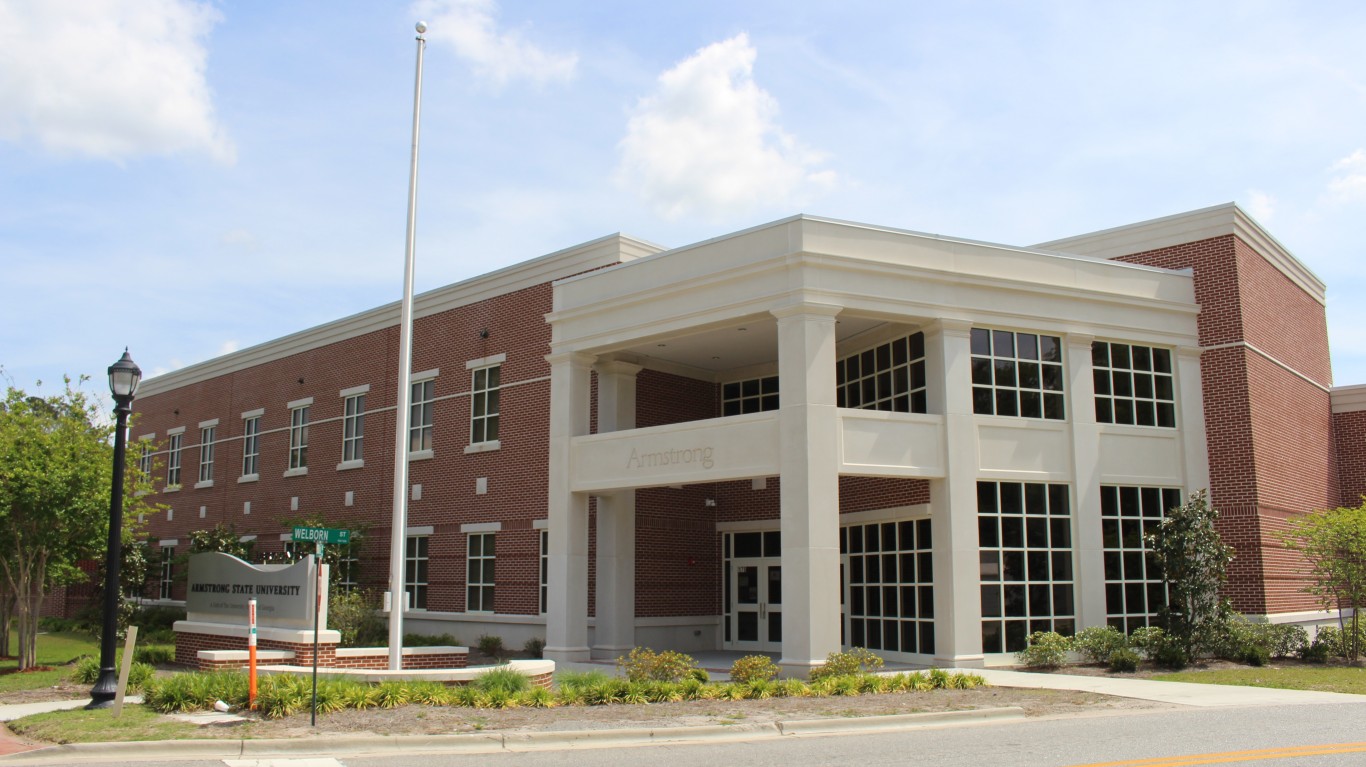
27. Hinesville, GA
> Confirmed COVID-19 cases as of Feb. 17: 3,753
> Confirmed COVID-19 cases as of Feb. 17 per 100,000 residents: 4,675.8
> Cumulative COVID-19 deaths as of Feb. 17: 59
> Cumulative COVID-19 deaths as of Feb. 17 per 100,000 residents: 73.5
> Population: 80,264

26. Barnstable Town, MA
> Confirmed COVID-19 cases as of Feb. 17: 9,665
> Confirmed COVID-19 cases as of Feb. 17 per 100,000 residents: 4,522.9
> Cumulative COVID-19 deaths as of Feb. 17: 384
> Cumulative COVID-19 deaths as of Feb. 17 per 100,000 residents: 179.7
> Population: 213,690

25. California-Lexington Park, MD
> Confirmed COVID-19 cases as of Feb. 17: 4,936
> Confirmed COVID-19 cases as of Feb. 17 per 100,000 residents: 4,425.7
> Cumulative COVID-19 deaths as of Feb. 17: 111
> Cumulative COVID-19 deaths as of Feb. 17 per 100,000 residents: 99.5
> Population: 111,531

24. Lewiston-Auburn, ME
> Confirmed COVID-19 cases as of Feb. 17: 4,643
> Confirmed COVID-19 cases as of Feb. 17 per 100,000 residents: 4,321.3
> Cumulative COVID-19 deaths as of Feb. 17: 54
> Cumulative COVID-19 deaths as of Feb. 17 per 100,000 residents: 50.3
> Population: 107,444
These are all the counties in Maine where COVID-19 is slowing (and where it’s still getting worse).
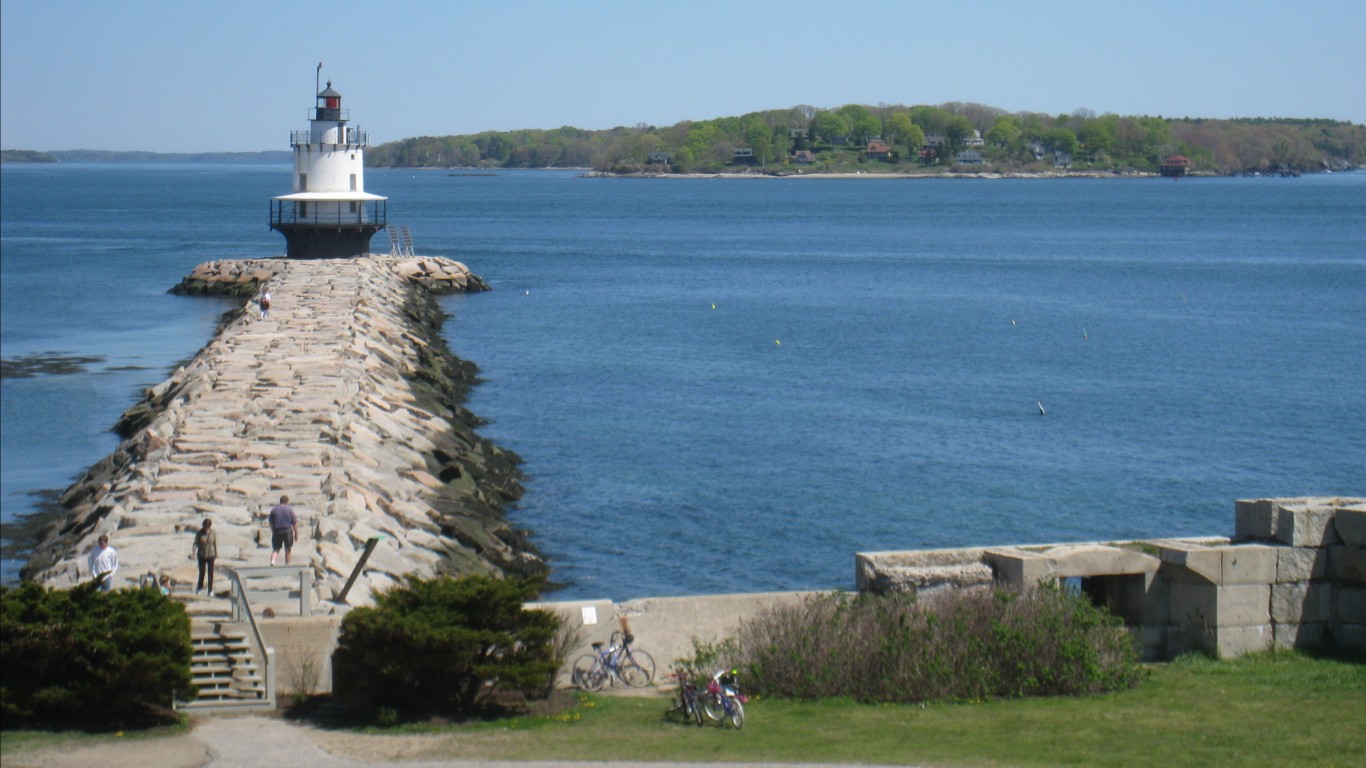
23. Portland-South Portland, ME
> Confirmed COVID-19 cases as of Feb. 17: 22,025
> Confirmed COVID-19 cases as of Feb. 17 per 100,000 residents: 4,161.0
> Cumulative COVID-19 deaths as of Feb. 17: 286
> Cumulative COVID-19 deaths as of Feb. 17 per 100,000 residents: 54
> Population: 529,323
These are all the counties in Maine where COVID-19 is slowing (and where it’s still getting worse).

22. Watertown-Fort Drum, NY
> Confirmed COVID-19 cases as of Feb. 17: 4,517
> Confirmed COVID-19 cases as of Feb. 17 per 100,000 residents: 3,946.8
> Cumulative COVID-19 deaths as of Feb. 17: 61
> Cumulative COVID-19 deaths as of Feb. 17 per 100,000 residents: 53.3
> Population: 114,448

21. Longview, WA
> Confirmed COVID-19 cases as of Feb. 17: 4,129
> Confirmed COVID-19 cases as of Feb. 17 per 100,000 residents: 3,928.2
> Cumulative COVID-19 deaths as of Feb. 17: 53
> Cumulative COVID-19 deaths as of Feb. 17 per 100,000 residents: 50.4
> Population: 105,112

20. Glens Falls, NY
> Confirmed COVID-19 cases as of Feb. 17: 4,925
> Confirmed COVID-19 cases as of Feb. 17 per 100,000 residents: 3,899.2
> Cumulative COVID-19 deaths as of Feb. 17: 102
> Cumulative COVID-19 deaths as of Feb. 17 per 100,000 residents: 80.8
> Population: 126,308

19. Seattle-Tacoma-Bellevue, WA
> Confirmed COVID-19 cases as of Feb. 17: 148,457
> Confirmed COVID-19 cases as of Feb. 17 per 100,000 residents: 3,896.8
> Cumulative COVID-19 deaths as of Feb. 17: 2,369
> Cumulative COVID-19 deaths as of Feb. 17 per 100,000 residents: 62.2
> Population: 3,809,717

18. Pittsfield, MA
> Confirmed COVID-19 cases as of Feb. 17: 4,762
> Confirmed COVID-19 cases as of Feb. 17 per 100,000 residents: 3,739.9
> Cumulative COVID-19 deaths as of Feb. 17: 244
> Cumulative COVID-19 deaths as of Feb. 17 per 100,000 residents: 191.6
> Population: 127,328

17. Medford, OR
> Confirmed COVID-19 cases as of Feb. 17: 8,004
> Confirmed COVID-19 cases as of Feb. 17 per 100,000 residents: 3,735.5
> Cumulative COVID-19 deaths as of Feb. 17: 107
> Cumulative COVID-19 deaths as of Feb. 17 per 100,000 residents: 49.9
> Population: 214,267
These are all the counties in Oregon where COVID-19 is slowing (and where it’s still getting worse).

16. Portland-Vancouver-Hillsboro, OR-WA
> Confirmed COVID-19 cases as of Feb. 17: 88,763
> Confirmed COVID-19 cases as of Feb. 17 per 100,000 residents: 3,671.0
> Cumulative COVID-19 deaths as of Feb. 17: 1,195
> Cumulative COVID-19 deaths as of Feb. 17 per 100,000 residents: 49.4
> Population: 2,417,931
These are all the counties in Oregon where COVID-19 is slowing (and where it’s still getting worse).

15. Fairbanks, AK
> Confirmed COVID-19 cases as of Feb. 17: 3,473
> Confirmed COVID-19 cases as of Feb. 17 per 100,000 residents: 3,485.1
> Cumulative COVID-19 deaths as of Feb. 17: 26
> Cumulative COVID-19 deaths as of Feb. 17 per 100,000 residents: 26.1
> Population: 99,653
These are all the counties in Alaska where COVID-19 is slowing (and where it’s still getting worse).

14. Mount Vernon-Anacortes, WA
> Confirmed COVID-19 cases as of Feb. 17: 4,297
> Confirmed COVID-19 cases as of Feb. 17 per 100,000 residents: 3,467.9
> Cumulative COVID-19 deaths as of Feb. 17: 58
> Cumulative COVID-19 deaths as of Feb. 17 per 100,000 residents: 46.8
> Population: 123,907
13. Ithaca, NY
> Confirmed COVID-19 cases as of Feb. 17: 3,345
> Confirmed COVID-19 cases as of Feb. 17 per 100,000 residents: 3,248.8
> Cumulative COVID-19 deaths as of Feb. 17: 41
> Cumulative COVID-19 deaths as of Feb. 17 per 100,000 residents: 39.8
> Population: 102,962

12. Bend, OR
> Confirmed COVID-19 cases as of Feb. 17: 5,795
> Confirmed COVID-19 cases as of Feb. 17 per 100,000 residents: 3,208.0
> Cumulative COVID-19 deaths as of Feb. 17: 56
> Cumulative COVID-19 deaths as of Feb. 17 per 100,000 residents: 31
> Population: 180,640
These are all the counties in Oregon where COVID-19 is slowing (and where it’s still getting worse).

11. Bellingham, WA
> Confirmed COVID-19 cases as of Feb. 17: 6,300
> Confirmed COVID-19 cases as of Feb. 17 per 100,000 residents: 2,905.7
> Cumulative COVID-19 deaths as of Feb. 17: 81
> Cumulative COVID-19 deaths as of Feb. 17 per 100,000 residents: 37.4
> Population: 216,812
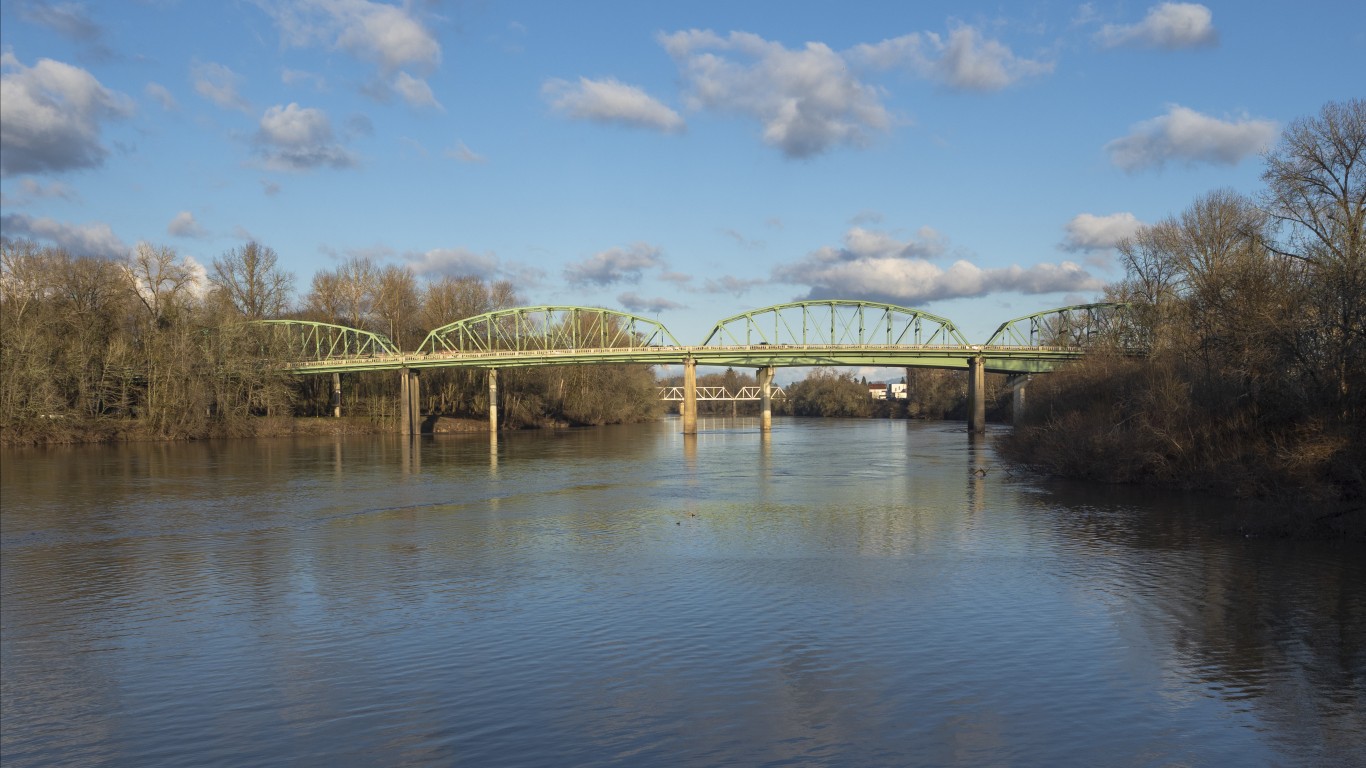
10. Albany-Lebanon, OR
> Confirmed COVID-19 cases as of Feb. 17: 3,513
> Confirmed COVID-19 cases as of Feb. 17 per 100,000 residents: 2,859.1
> Cumulative COVID-19 deaths as of Feb. 17: 54
> Cumulative COVID-19 deaths as of Feb. 17 per 100,000 residents: 43.9
> Population: 122,870
These are all the counties in Oregon where COVID-19 is slowing (and where it’s still getting worse).

9. Eugene-Springfield, OR
> Confirmed COVID-19 cases as of Feb. 17: 9,919
> Confirmed COVID-19 cases as of Feb. 17 per 100,000 residents: 2,688.9
> Cumulative COVID-19 deaths as of Feb. 17: 121
> Cumulative COVID-19 deaths as of Feb. 17 per 100,000 residents: 32.8
> Population: 368,882
These are all the counties in Oregon where COVID-19 is slowing (and where it’s still getting worse).
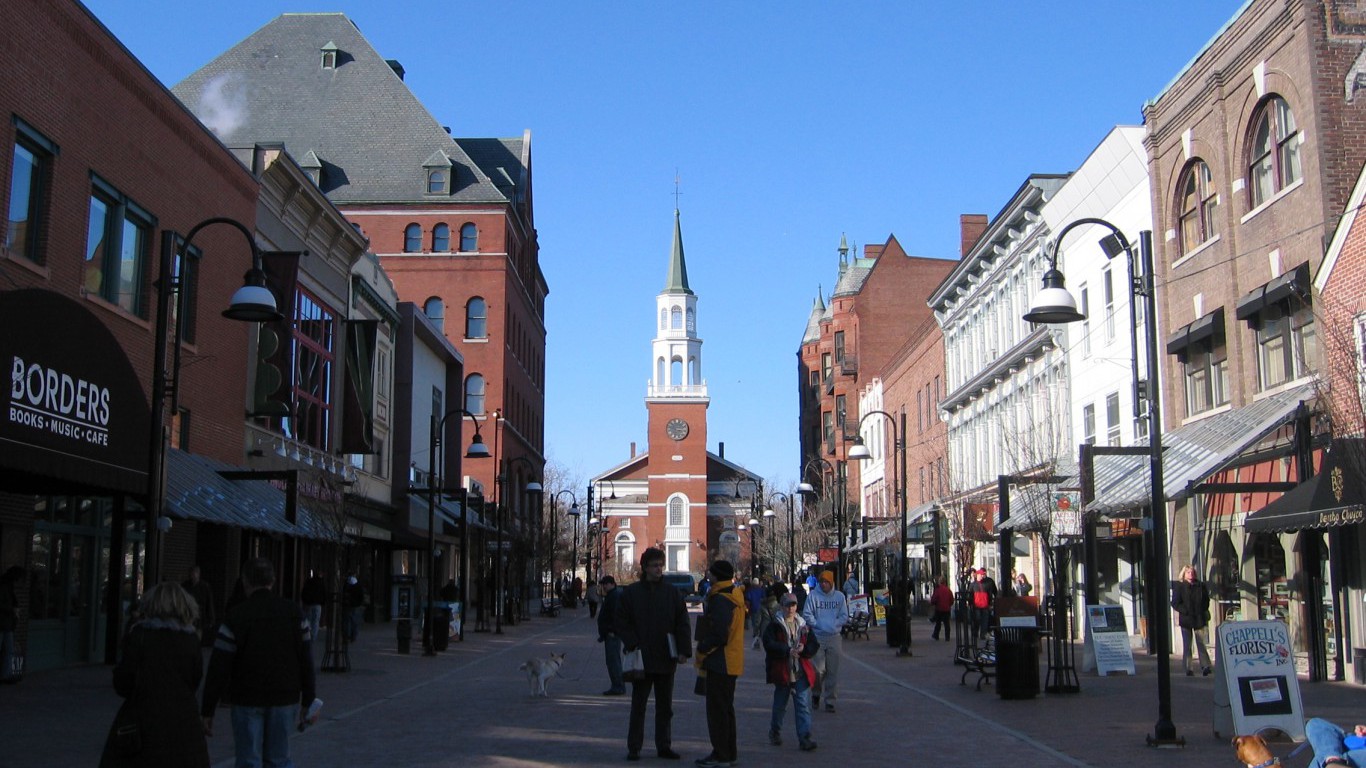
8. Burlington-South Burlington, VT
> Confirmed COVID-19 cases as of Feb. 17: 5,674
> Confirmed COVID-19 cases as of Feb. 17 per 100,000 residents: 2,602.3
> Cumulative COVID-19 deaths as of Feb. 17: 117
> Cumulative COVID-19 deaths as of Feb. 17 per 100,000 residents: 53.7
> Population: 218,042
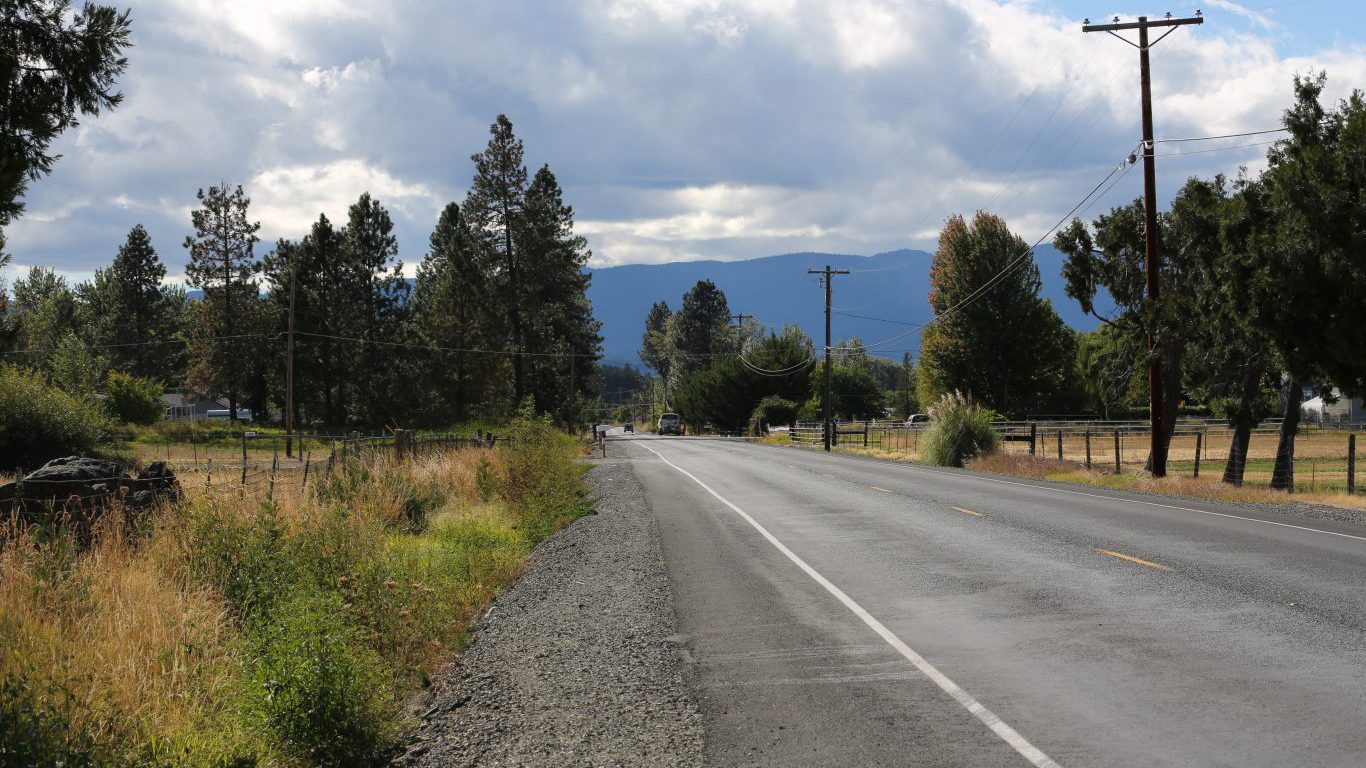
7. Grants Pass, OR
> Confirmed COVID-19 cases as of Feb. 17: 2,213
> Confirmed COVID-19 cases as of Feb. 17 per 100,000 residents: 2,588.9
> Cumulative COVID-19 deaths as of Feb. 17: 47
> Cumulative COVID-19 deaths as of Feb. 17 per 100,000 residents: 55
> Population: 85,481
These are all the counties in Oregon where COVID-19 is slowing (and where it’s still getting worse).

6. Olympia-Lacey-Tumwater, WA
> Confirmed COVID-19 cases as of Feb. 17: 6,918
> Confirmed COVID-19 cases as of Feb. 17 per 100,000 residents: 2,518.5
> Cumulative COVID-19 deaths as of Feb. 17: 74
> Cumulative COVID-19 deaths as of Feb. 17 per 100,000 residents: 26.9
> Population: 274,684

5. Corvallis, OR
> Confirmed COVID-19 cases as of Feb. 17: 2,198
> Confirmed COVID-19 cases as of Feb. 17 per 100,000 residents: 2,448.2
> Cumulative COVID-19 deaths as of Feb. 17: 16
> Cumulative COVID-19 deaths as of Feb. 17 per 100,000 residents: 17.8
> Population: 89,780
These are all the counties in Oregon where COVID-19 is slowing (and where it’s still getting worse).

4. Bangor, ME
> Confirmed COVID-19 cases as of Feb. 17: 3,704
> Confirmed COVID-19 cases as of Feb. 17 per 100,000 residents: 2,440.9
> Cumulative COVID-19 deaths as of Feb. 17: 76
> Cumulative COVID-19 deaths as of Feb. 17 per 100,000 residents: 50.1
> Population: 151,748
These are all the counties in Maine where COVID-19 is slowing (and where it’s still getting worse).

3. Urban Honolulu, HI
> Confirmed COVID-19 cases as of Feb. 17: 21,650
> Confirmed COVID-19 cases as of Feb. 17 per 100,000 residents: 2,192.1
> Cumulative COVID-19 deaths as of Feb. 17: 341
> Cumulative COVID-19 deaths as of Feb. 17 per 100,000 residents: 34.5
> Population: 987,638
These are all the counties in Hawaii where COVID-19 is slowing (and where it’s still getting worse).

2. Bremerton-Silverdale-Port Orchard, WA
> Confirmed COVID-19 cases as of Feb. 17: 5,596
> Confirmed COVID-19 cases as of Feb. 17 per 100,000 residents: 2,132.0
> Cumulative COVID-19 deaths as of Feb. 17: 84
> Cumulative COVID-19 deaths as of Feb. 17 per 100,000 residents: 32
> Population: 262,475

1. Kahului-Wailuku-Lahaina, HI
> Confirmed COVID-19 cases as of Feb. 17: 2,094
> Confirmed COVID-19 cases as of Feb. 17 per 100,000 residents: 1,266.9
> Cumulative COVID-19 deaths as of Feb. 17: 29
> Cumulative COVID-19 deaths as of Feb. 17 per 100,000 residents: 17.5
> Population: 165,281
These are all the counties in Hawaii where COVID-19 is slowing (and where it’s still getting worse).