
There were nearly 147 million Americans in the workforce in 2019. Among all workers, including those working part-time, the annual median wage was $39,810. While workers’ incomes depend on their education level, career field, and personal aptitudes, another major factor determining income is the area where they live and work.
Because of factors like the cost of living and the financial resources of companies in the area, jobs that might pay relatively low wages in some areas could pay much higher salaries in other parts of the country.
To identify the cities with the highest paying jobs, 24/7 Wall St. reviewed the annual median wage in 389 metropolitan statistical areas using data from the May 2019 Occupational Employment Statistics program of the Bureau of Labor Statistics.
The vast majority of cities on this list are in coastal areas. California’s Silicon Valley is home to many of the world’s largest tech companies, while New York is home to Wall Street, and many finance giants are headquartered in the Big Apple. These industries tend to pay workers relatively high wages and have become synonymous with the areas in which they are located. This is the most iconic job in every state.
One common thread linking the cities on this list is educational attainment. Of the 25 metro areas with the highest wages in the country, just one has a bachelor’s degree attainment share lower than the U.S. share of 33.1%. College-educated workers tend to earn higher wages than those with no degree, and they are less likely to live in poverty. There is a wide variety of income levels for college graduates, depending on what major they selected as students. These are the college majors that pay off the most.
Click here to see the 25 cities with the highest paying jobs.
Click here to see our methodology.

25. San Diego-Carlsbad, CA
> 2019 annual median wage: $45,050
> Most highly concentrated occupation: Biochemists and biophysicists (6.7 times more common than national distribution)
> Annual wage of area biochemists and biophysicists: $75,040 (national median wage: $94,490)
> 2019 poverty rate: 10.3% (300th highest out of 383 metro areas)
San Diego is one of 25 U.S. metro areas in which the majority of workers earn over $45,000 per year. The annual median wage for all U.S. workers, including those who work part time, is considerably lower, at $39,810.
The area, near California’s southwestern tip, has an outsized share of workers in scientific fields. Its three most highly concentrated jobs relative to their concentration nationwide are biochemists and biophysicists, aerospace engineering and operations technologists and technicians, and biological scientists — all highly specialized fields that pay much higher wages than the majority of U.S. jobs.
[in-text-ad]
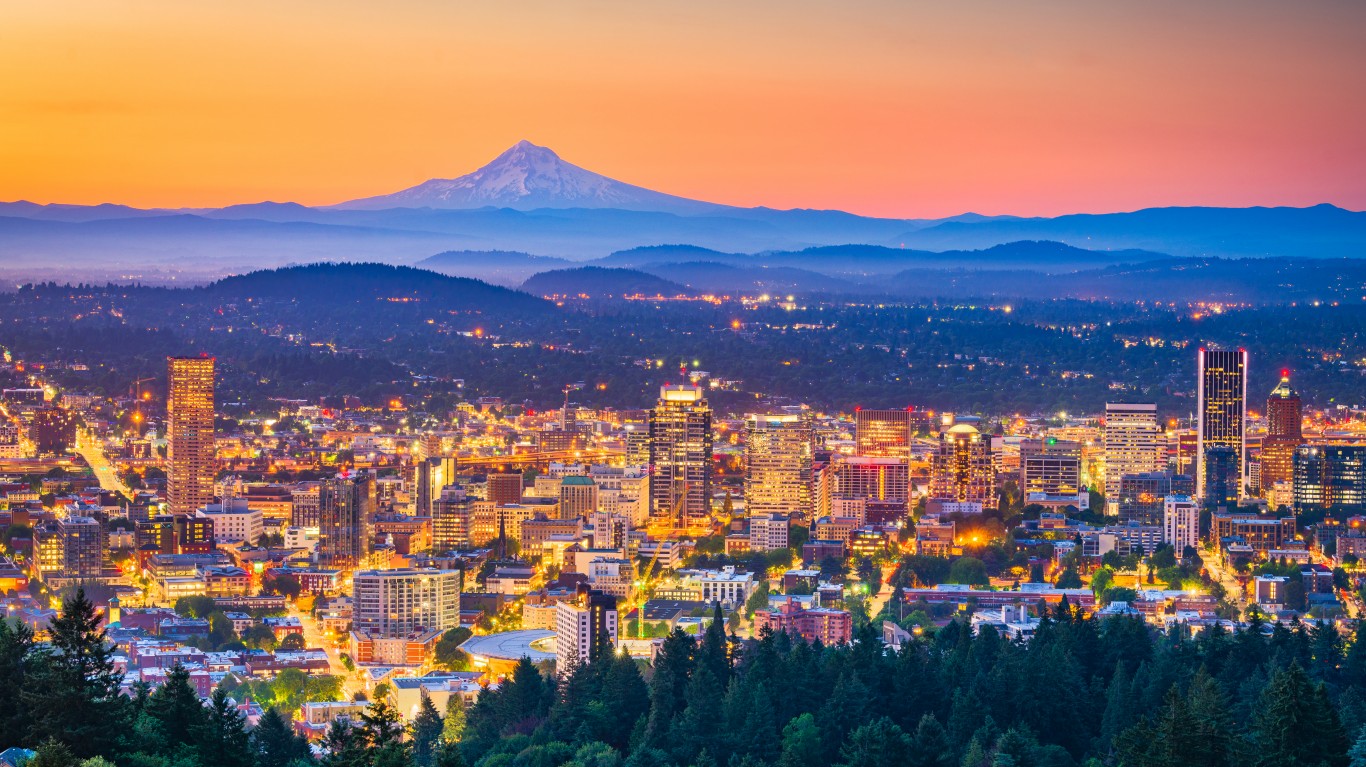
24. Portland-Vancouver-Hillsboro, OR-WA
> 2019 annual median wage: $45,350
> Most highly concentrated occupation: Semiconductor processing technicians (17.2 times more common than national distribution)
> Annual wage of area Semiconductor processing technicians: $37,710 (national median wage: $38,060)
> 2019 poverty rate: 9.6% (326th highest out of 383 metro areas)
Portland is one of a dozen metro areas in the Western U.S. to have among the 25 highest annual median wages in the country out of 389 metro areas for which there is data. The annual median wage in the Portland area is $45,350.
High wages are correlated with higher educational attainment levels, and the Portland metro area is one of the best educated parts of the country. In the area, 40.3% of residents age 25 and older hold a bachelor’s degree, compared to the 33.1% bachelor’s degree attainment rate nationwide.
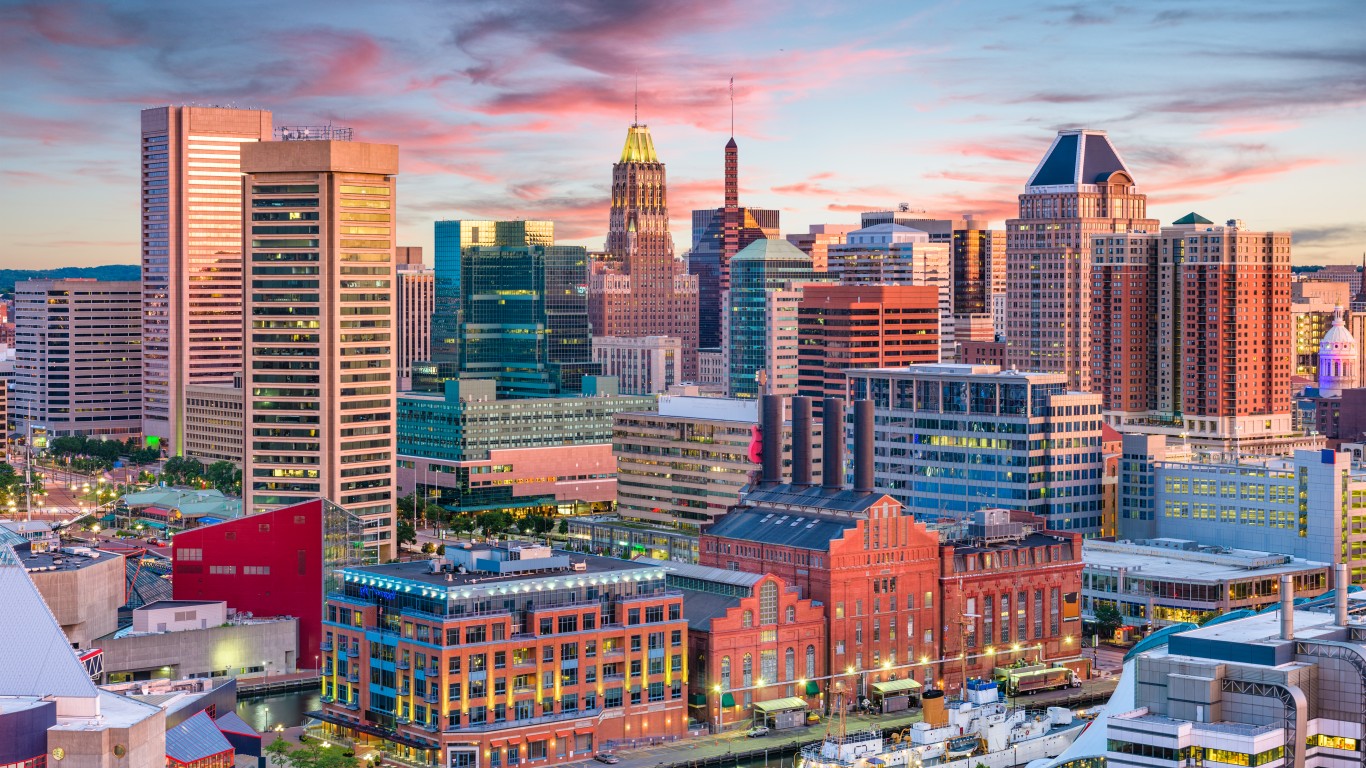
23. Baltimore-Columbia-Towson, MD
> 2019 annual median wage: $45,810
> Most highly concentrated occupation: Correspondence clerks (4.4 times more common than national distribution)
> Annual wage of area correspondence clerks: $35,830 (national median wage: $38,140)
> 2019 poverty rate: 9.4% (328th highest out of 383 metro areas)
The jobs in the Baltimore area tend to pay better than the jobs nationwide, as the typical area worker earns $45,810 in a year, while the typical worker in the U.S. earns less than $40,000 annually. Several of the largest employers in the area around Baltimore include health care providers like Greater Baltimore Medical Center and MedStar Franklin Square Hospital. Workers in the health care field tend to earn relatively high wages.
Though the city of Baltimore itself has a relatively high poverty rate, the people living in the surrounding metro area as a whole are relatively unlikely to face financial hardship. The Baltimore metro area reported a poverty rate of 9.4% in 2019 — well below the national annual poverty rate of 12.3%.

22. Urban Honolulu, HI
> 2019 annual median wage: $45,900
> Most highly concentrated occupation: Dancers (8.6 times more common than national distribution)
> Annual wage of area dancers: N/A (national median wage: N/A)
> 2019 poverty rate: 8.1% (356th highest out of 383 metro areas)
The Urban Honolulu, Hawaii, metro area had one of the highest annual median wages in 2019, with the typical worker earning $45,900, more than $6,000 over the U.S. annual median wage for that year. In part because of these high wages, a relatively high share of urban Honolulu area residents have generally been able to avoid serious financial hardship. The area’s 2019 poverty rate was just 8.1%, one of the lowest among all U.S. metro areas and well below the national poverty rate of 12.3%.
[in-text-ad-2]

21. New Haven, CT
> 2019 annual median wage: $45,970
> Most highly concentrated occupation: Museum technicians and conservators (5.7 times more common than national distribution)
> Annual wage of area museum technicians and conservators: $63,360 (national median wage: $44,430)
> 2019 poverty rate: 12.2% (219th highest out of 383 metro areas)
The New Haven area of southern Connecticut reported one of the highest annual median wages in 2019, at nearly $46,000. Among the top employers in the New Haven area are Ivy League school Yale University and its associated hospital and health system. Prestigious schools like Yale have multi-billion dollar endowments and are able to pay top dollar to attract highly sought after professors and doctors to be on their staff.
Though workers in the New Haven metro area tend to earn high wages, the area’s 2019 poverty rate of 12.2% was roughly in line with the U.S. poverty rate for that year. This figure may skew higher as college students may technically be below the poverty line based on their income, but may have financial support from their parents or guardians.

20. Ithaca, NY
> 2019 annual median wage: $46,370
> Most highly concentrated occupation: Animal scientists (139.9 times more common than national distribution)
> Annual wage of area animal scientists: $61,450 (national median wage: $60,300)
> 2019 poverty rate: 17.9% (47th highest out of 383 metro areas)
Income and educational attainment are closely correlated, which helps explain why incomes in the Ithaca, New York, area are so high. In the metro area, 56.9% of adults 25 and older hold at least a bachelor’s degree, the third highest share in the nation and well above the nationwide bachelor’s degree attainment rate of 33.1%. Ithaca is well known as the home of the Ivy League school Cornell University.
The most concentrated job in Ithaca is animal scientist, likely in large part because of the animal science school at Cornell University. These workers are nearly 140 times more common in the area than they are nationwide. Most of these workers earn over $60,000 per year, well above the U.S. annual median wage for all jobs of $39,810.
[in-text-ad]

19. Portsmouth, NH-ME
> 2019 annual median wage: $46,690
> Most highly concentrated occupation: Nuclear engineers (35.2 times more common than national distribution)
> Annual wage of area nuclear engineers: $91,850 (national median wage: $113,460)
> 2019 poverty rate: N/A
The Portsmouth area along the New Hampshire-Maine border is one of five major metropolitan areas in New England to have had among the 25 highest annual median wages in 2019, at $46,690 — well above the U.S. annual median wage for that year of less than $40,000.
Portsmouth is just north of a nuclear power plant called the NextEra Energy Seabrook Station that supplies power to over a million families. Because of the plant’s proximity, hundreds of nuclear engineers live in the metro area, most of whom earned over $91,000 in 2019
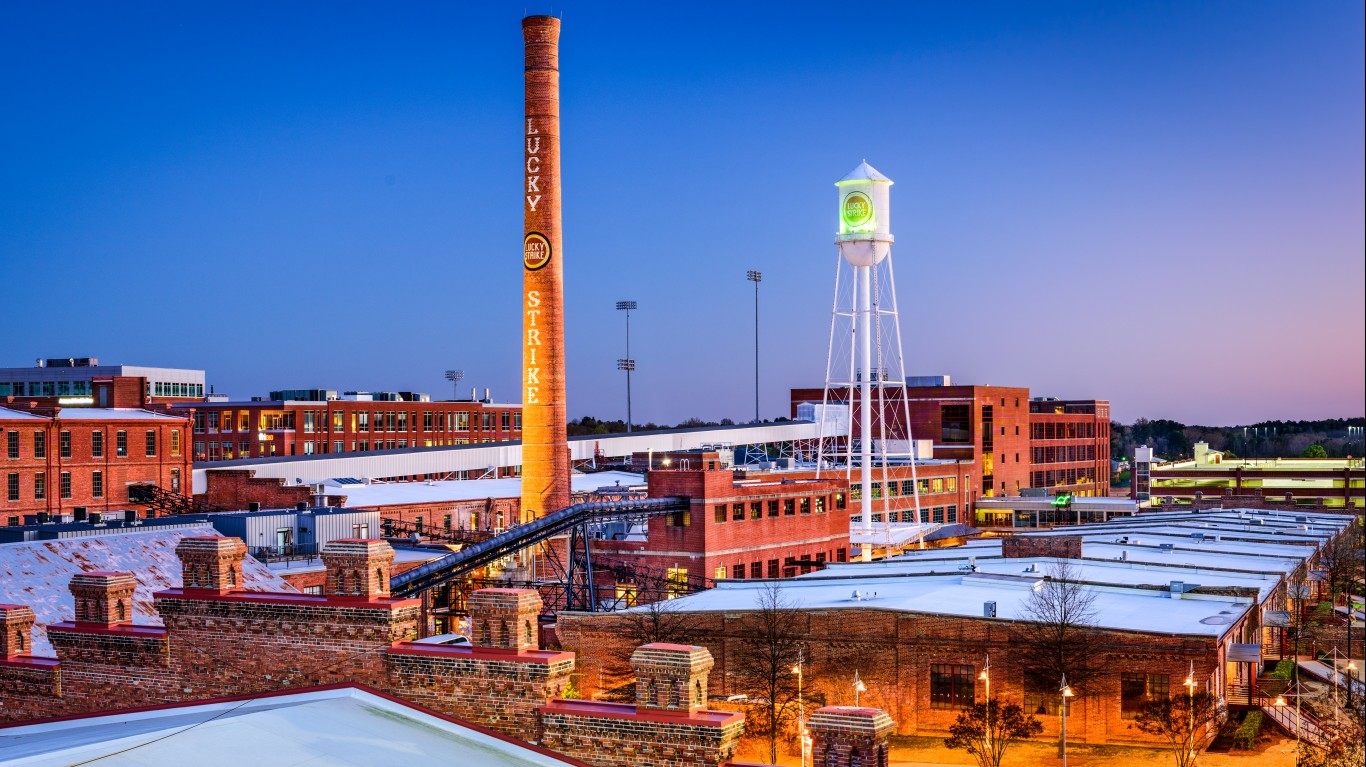
18. Durham-Chapel Hill, NC
> 2019 annual median wage: $46,760
> Most highly concentrated occupation: Semiconductor processing technicians (23.0 times more common than national distribution)
> Annual wage of area semiconductor processing technicians: $34,530 (national median wage: $38,060)
> 2019 poverty rate: 14.0% (140th highest out of 383 metro areas)
The Durham-Chapel Hill, North Carolina, metro area is one of just four in the South to rank among the 25 cities with the highest paying jobs, with an annual median wage of $46,760. The area is part of the Research Triangle, so-called because there are three research universities in close proximity.
These schools provide the area with qualified workers in a number of science and technology fields, attracting large companies to the area. Some of the largest employers in the area include health information technologies companies like IQVIA, pharmaceutical manufacturer Grifols, and more.

17. Olympia-Tumwater, WA
> 2019 annual median wage: $46,810
> Most highly concentrated occupation: Zoologists and wildlife biologists (19.9 times more common than national distribution)
> Annual wage of area zoologists and wildlife biologists: $69,720 (national median wage: $63,270)
> 2019 poverty rate: 9.2% (334th highest out of 383 metro areas)
The Olympia-Tumwater metro area of Washington is in the western part of the state, about an hour drive south of Seattle. Area jobs rank among the highest paying in the country, with the annual median wage reported at $46,810 in 2019.
Providence St. Peter Hospital and Capital Medical Center are two of the largest employers in Olympia, and health care workers tend to earn relatively high wages. The area also has a relatively high concentration of workers who are in the science and nature sector. The two most concentrated jobs relative to their concentration nationwide are zoologists and wildlife biologists and conservation scientists — both of which reported annual median wages of over $60,000.
[in-text-ad-2]

16. Minneapolis-St. Paul-Bloomington, MN-WI
> 2019 annual median wage: $47,010
> Most highly concentrated occupation: Choreographers (5.8 times more common than national distribution)
> Annual wage of area choreographers: $40,190 (national median wage: $46,330)
> 2019 poverty rate: 8.2% (354th highest out of 383 metro areas)
The Minneapolis-St. Paul-Bloomington metro area along the Minnesota-Wisconsin border is the only place in the Midwest that ranked among the 25 metro areas with the highest paying jobs in 2019. Most area workers earned over $47,000 per year in annual wages, well above the U.S. median of $39,810.
There are over a dozen Fortune 500 companies located in the Minneapolis metro area, including 3M, UnitedHealth Group, Target, and more. These multi-billion dollar corporations provide the area with thousands of high-paying corporate leadership jobs.

15. Denver-Aurora-Lakewood, CO
> 2019 annual median wage: $47,440
> Most highly concentrated occupation: Cartographers and photogrammetrists (7.0 times more common than national distribution)
> Annual wage of area cartographers and photogrammetrists: $71,290 (national median wage: $65,470)
> 2019 poverty rate: 7.9% (360th highest out of 383 metro areas)
The Denver metro area has one of the 15 highest median annual wages out of nearly 400 major metropolitan areas in the U.S., at $47,440. There is a strong correlation between income and education, and Denver area residents are some of the best educated in the U.S., with 45.8% of adults age 25 and older holding at least a bachelor’s degree, well above the national rate of 33.1%.
Like a number of other places on this list, many of the largest private employers in the Denver area are health care service providers. These include Centura Health, HealthONE Corporation, and SCL Health System.
[in-text-ad]

14. Bremerton-Silverdale, WA
> 2019 annual median wage: $47,930
> Most highly concentrated occupation: Layout workers, metal and plastic (103.9 times more common than national distribution)
> Annual wage of area layout workers, metal and plastic: $56,460 (national median wage: $49,940)
> 2019 poverty rate: 6.9% (373th highest out of 383 metro areas)
The Bremerton-Silverdale, Washington, area is one of three Washington major metropolitan areas to have had among the highest paying jobs in 2019. The area, which is west of Seattle across the Puget Sound, has access to the many high-paying jobs offered in the Seattle area by companies like Amazon, Microsoft, and Boeing.
With fewer than 90,000 workers in its labor force, the Bremerton area ranks as one of the smaller metro areas on this list. Just 6.9% of area residents lived below the poverty line in 2019, well below the national poverty rate of 12.3% that year. Just nine other metro areas had lower poverty rates in 2019.
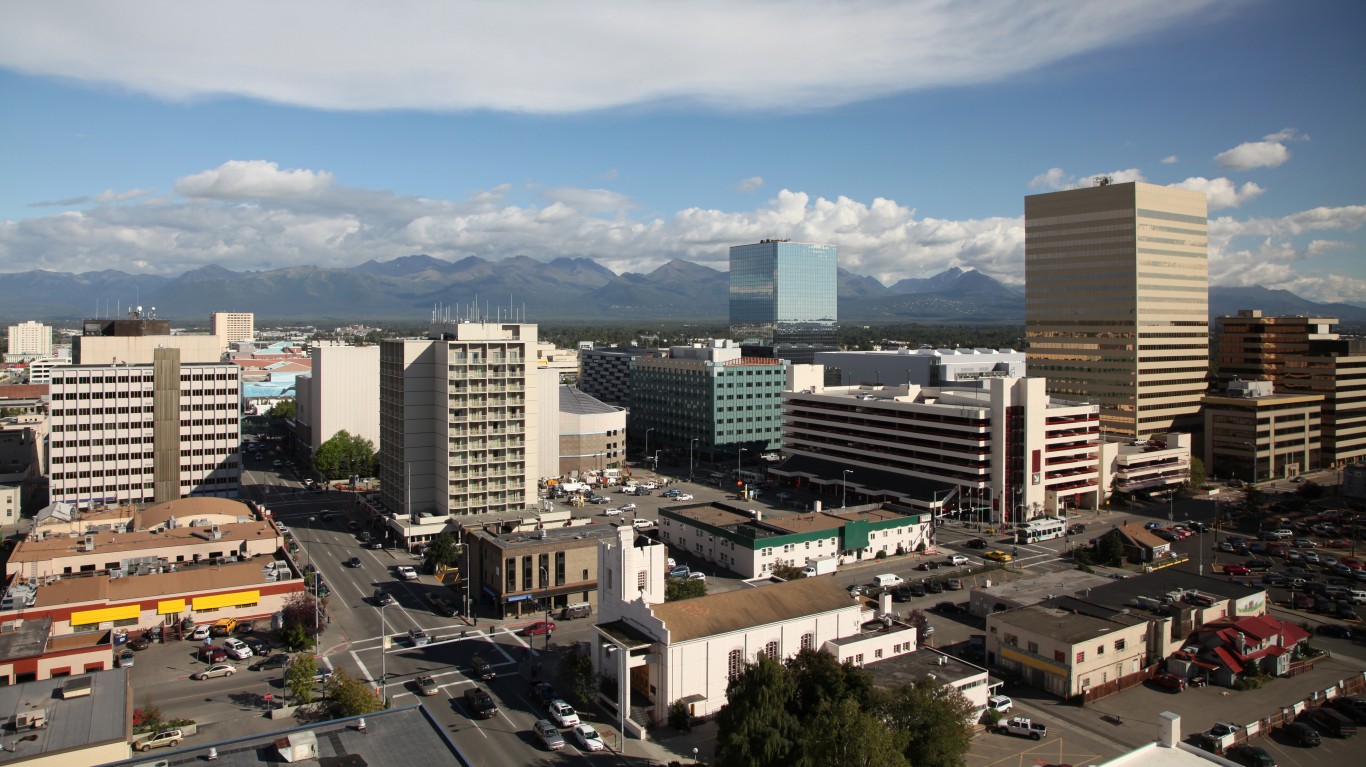
13. Anchorage, AK
> 2019 annual median wage: $48,140
> Most highly concentrated occupation: Commercial pilots (16.3 times more common than national distribution)
> Annual wage of area commercial pilots: $90,320 (national median wage: $86,080)
> 2019 poverty rate: 10.0% (312nd highest out of 383 metro areas)
The Anchorage, Alaska, metro area in southern Alaska is one of two metro areas in the state to rank among the 25 cities with the highest paying jobs. In 2019, most workers in the area earned over $48,000, well above the U.S. annual median wage among all jobs of $39,810.
Many areas of Alaska are very remote and inaccessible by road, so people living in these areas often rely on airplanes to deliver goods and travel from place to place. Commercial pilots are much more common in the Anchorage area than they are nationwide. This job tends to pay well, as most commercial pilots in the Anchorage area earn over $90,000 per year. The area also has a large oil and natural gas sector, and most petroleum engineers earn over $135,000 per year.
12. Fairbanks, AK
> 2019 annual median wage: $48,580
> Most highly concentrated occupation: Zoologists and wildlife biologists (37.7 times more common than national distribution)
> Annual wage of area zoologists and wildlife biologists: $73,140 (national median wage: $63,270)
> 2019 poverty rate: 5.9% (380th highest out of 383 metro areas)
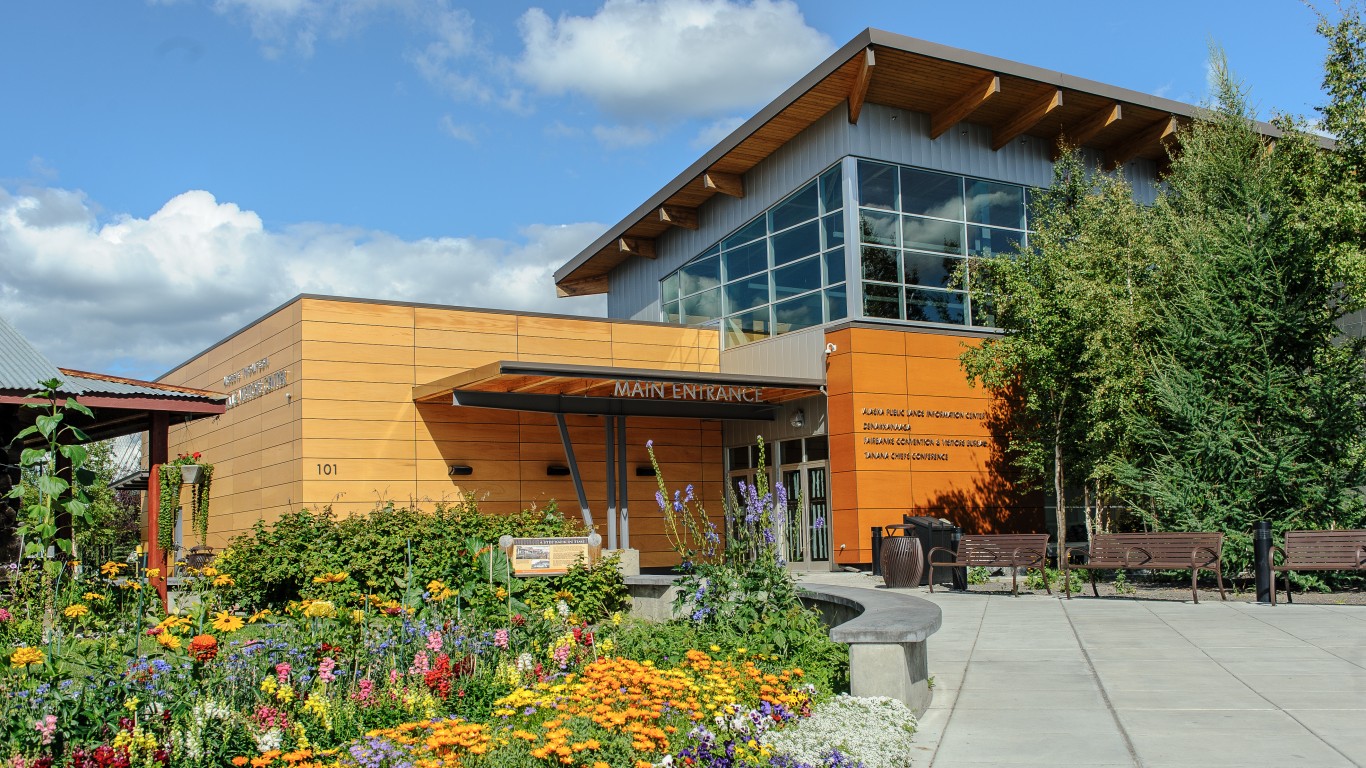
The Fairbanks, Alaska, metro area, located near the center of the state of Alaska, reported one of the highest annual median wages in 2019, at $48,580. Among all the metro areas on this list, Fairbanks had by far the smallest labor force, with a total employment of just 33,480.
The Fairbanks metro area had the fourth lowest poverty rate in the nation in 2019, at just 5.9% — less than half of the national poverty rate that year of 12.3%. Alaska is resource rich and has many inaccessible, remote areas. So like Anchorage, the Fairbanks metro area has a significant number of workers in airfields operation and geosciences.
[in-text-ad-2]

11. New York-Newark-Jersey City, NY-NJ-PA
> 2019 annual median wage: $48,840
> Most highly concentrated occupation: Fashion designers (5.9 times more common than national distribution)
> Annual wage of area fashion designers: $77,390 (national median wage: $73,790)
> 2019 poverty rate: 11.6% (248th highest out of 383 metro areas)
The New York City metro area has the largest workforce in America, with 9.7 million people employed in and around the city. In 2019, there were only 10 metro areas that reported a higher annual median wage than the New York area’s median wage of $48,840. For context, the U.S. median wage was $39,810.
New York City has by far the largest public transit system in America, with 790 miles of train tracks. The city’s Metropolitan Transit Authority employs roughly 67,000 people, and two of the New York City metro area’s most concentrated jobs compared to their concentration nationwide are subway and streetcar operators and transit and railroad police. Most New York area workers in these jobs earned over $72,000 per year, as of 2019.

10. Hartford-West Hartford-East Hartford, CT
> 2019 annual median wage: $50,630
> Most highly concentrated occupation: Actuaries (12.5 times more common than national distribution)
> Annual wage of area actuaries: N/A (national median wage: $108,350)
> 2019 poverty rate: 10.1% (306th highest out of 383 metro areas)
The Hartford metro area in central Connecticut is one of just 10 major population centers in the U.S. in which most workers earned over $50,000 in 2019. Actuaries are much more common in Hartford than they are nationwide, as major insurance companies like Aetna, Cigna, and Hartford Financial Services are all headquartered in the metro area. Nationwide, most actuaries earn over $108,000 per year.
[in-text-ad]
9. Boulder, CO
> 2019 annual median wage: $51,520
> Most highly concentrated occupation: Physicists (35.6 times more common than national distribution)
> Annual wage of area physicists: $141,980 (national median wage: $122,850)
> 2019 poverty rate: 10.9% (279th highest out of 383 metro areas)
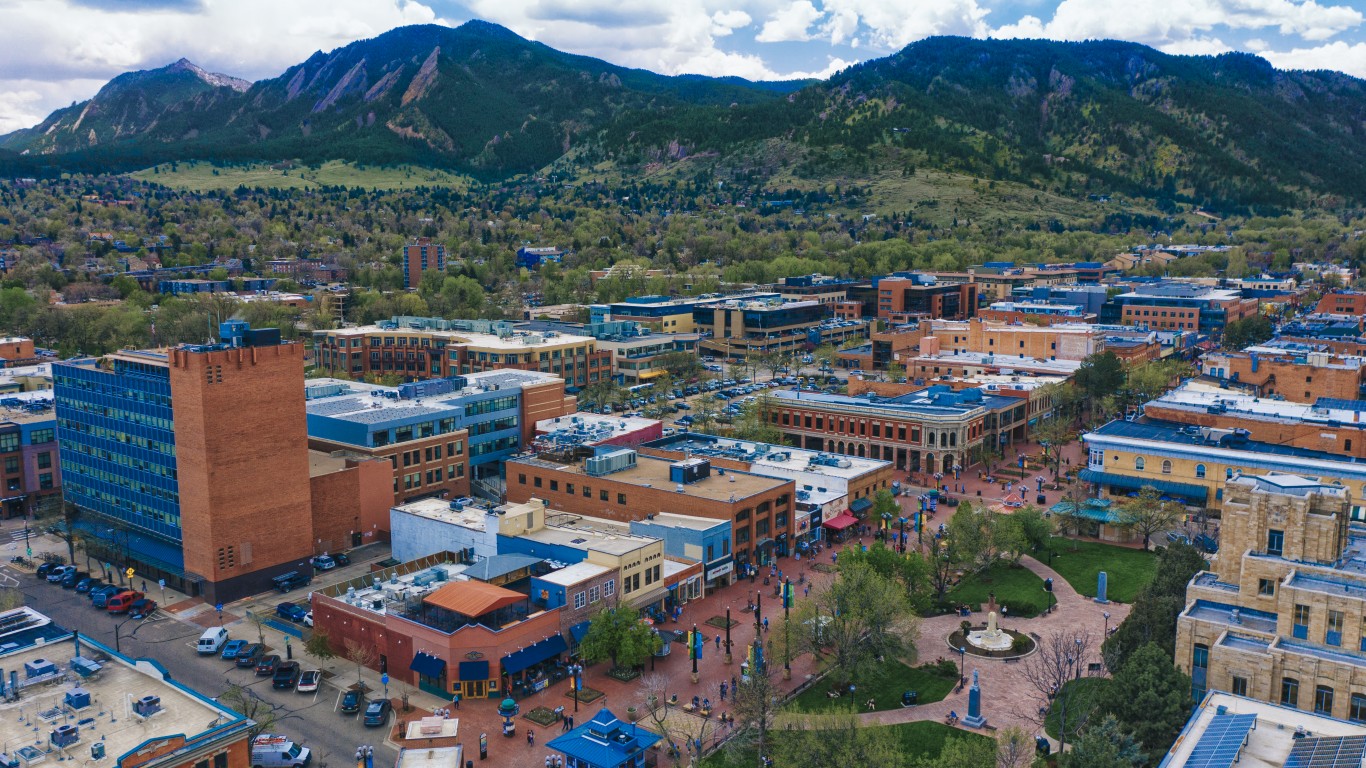
Boulder ranks among the metro areas with the highest paying jobs in large part because of its highly educated population. The area, home to the University of Colorado, has a higher educational attainment rate than any other part of the country, with 64.8% of adults 25 and older holding at least a bachelor’s degree. This is nearly double the U.S. bachelor’s degree attainment rate.
The most concentrated jobs in the area — physicists, biochemists and biophysicists, and computer hardware engineers — all have annual median wages two or even three times higher than the annual median wage for all jobs of under $40,000 per year. These jobs are all highly specialized and generally require workers to have a college degree.
8. Trenton, NJ
> 2019 annual median wage: $52,970
> Most highly concentrated occupation: Survey researchers (15.2 times more common than national distribution)
> Annual wage of area survey researchers: $78,670 (national median wage: $59,170)
> 2019 poverty rate: 12.8% (194th highest out of 383 metro areas)
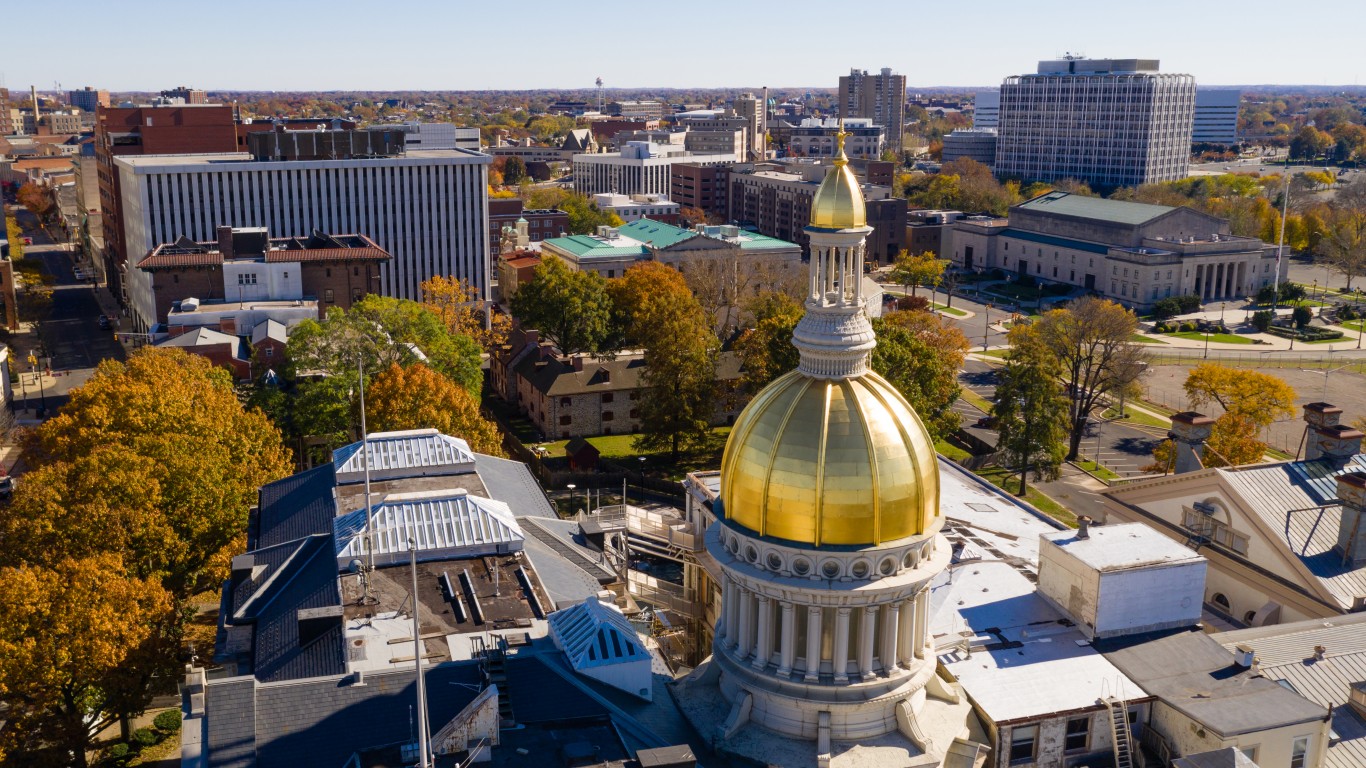
The Trenton, New Jersey, metro area had some of the highest paying jobs in the nation in 2019, with the median worker making nearly $53,000. In Mercer County, in Central New Jersey just across the Pennsylvania border where Trenton is located, one of the top employers is Princeton University, an Ivy League school. These kinds of institutions can afford to pay top dollar for professors, and they produce thousands of highly desirable members of the workforce each year.
The 2019 annual median wage in Trenton was one of the highest in the country, yet many in the area still faced economic hardship. The area’s poverty rate was 12.8%, a half a percentage point higher than the U.S. rate. Also, 8.2% of Trenton households lived on less than $10,000 in 2019, well above the U.S. share of 5.8% that year.

7. Bridgeport-Stamford-Norwalk, CT
> 2019 annual median wage: $53,040
> Most highly concentrated occupation: Survey researchers (6.7 times more common than national distribution)
> Annual wage of area survey researchers: $51,170 (national median wage: $59,170)
> 2019 poverty rate: 9.1% (338th highest out of 383 metro areas)
Most workers in the Bridgeport-Stamford-Norwalk area of southwestern Connecticut earned over $53,000 in 2019, the seventh-highest median of U.S. metro areas. About a 90 minute train ride from New York City, Bridgeport area residents have access to the high-paying jobs available in New York, as well as those in the metro area itself. Some of the area’s largest employers include People’s United Bank, St. Vincent’s Medical Center, and commodity trading company Glencore — financial services jobs tend to pay well.
In the Bridgeport area, households are among the most likely to report doing very well financially. In 2019, 22.8% of households had incomes in excess of $200,000 — the third highest share nationwide and well more than double the U.S. rate of 8.5%.
[in-text-ad-2]

6. Boston-Cambridge-Nashua, MA-NH
> 2019 annual median wage: $53,300
> Most highly concentrated occupation: Biochemists and biophysicists (6.9 times more common than national distribution)
> Annual wage of area biochemists and biophysicists: $100,470 (national median wage: $94,490)
> 2019 poverty rate: 8.6% (348th highest out of 383 metro areas)
With nearly 2.8 million workers as of 2019, the Boston metro area has one of the largest labor forces anywhere in America. These workers reported an annual median wage of $53,300, higher than all but five other metro areas.
The two largest employers in the Boston area, and Massachusetts as a whole, are health care providers — Mass General Brigham and Beth Israel Lahey Health. This is likely a large reason why the area is home to outsized shares, compared to the national share, of biochemists, medical scientists, and biological scientists — all of which are career fields in which most Boston area workers earn over $90,000 annually.
5. Seattle-Tacoma-Bellevue, WA
> 2019 annual median wage: $53,360
> Most highly concentrated occupation: Avionics technicians (10.0 times more common than national distribution)
> Annual wage of area avionics technicians: N/A (national median wage: $65,700)
> 2019 poverty rate: 7.8% (363th highest out of 383 metro areas)
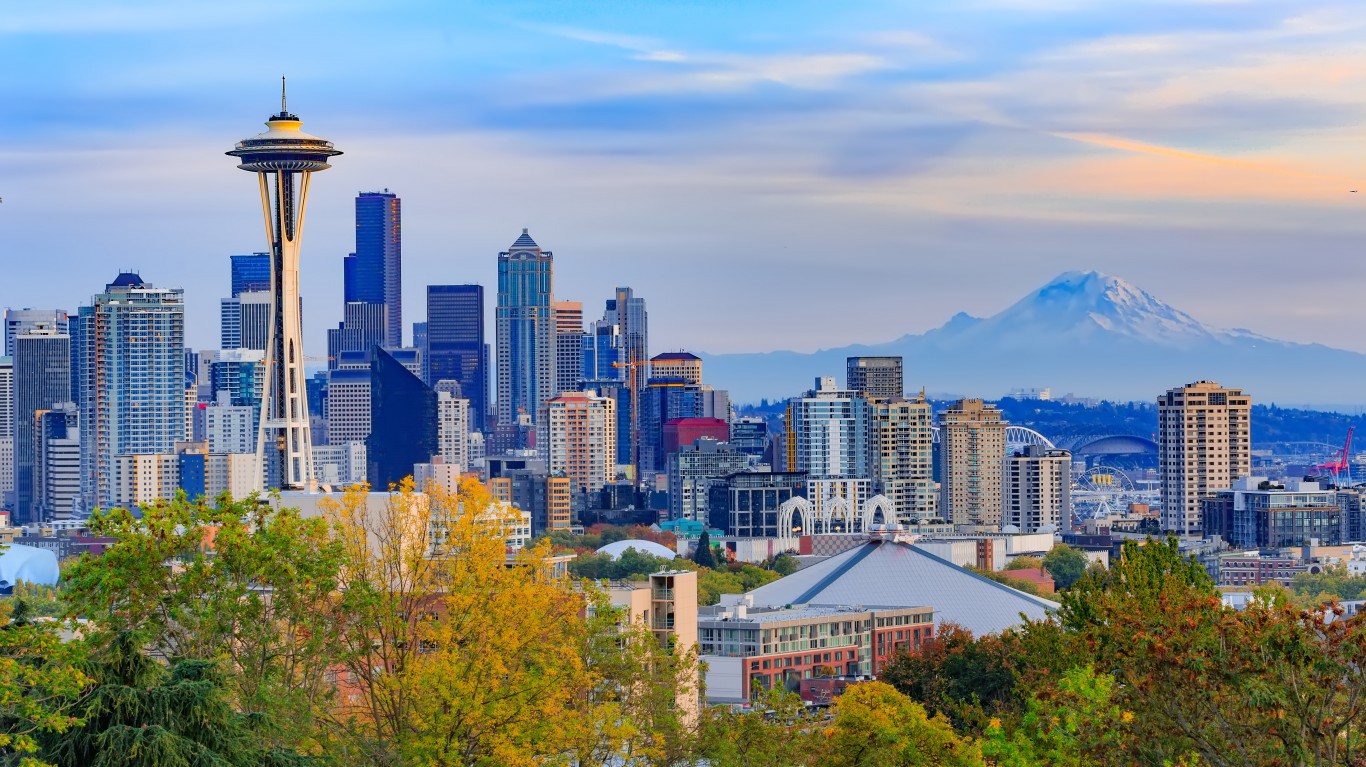
The annual median wage for all workers in the Seattle metro area in 2019 was $53,360 — a higher wage than in all but four other metro areas.
The most highly concentrated workers in the Seattle area compared to the concentration nationwide are avionics technicians, who install, repair, and test equipment like radar, radio, navigation, and missile control systems in aircraft. Major aerospace companies like Boeing, Blue Origin, and SpaceX all have major presences in Seattle, requiring avionics technicians. Most of these workers earned over $65,000 in 2019.
[in-text-ad]

4. Washington-Arlington-Alexandria, DC-VA-MD-WV
> 2019 annual median wage: $56,320
> Most highly concentrated occupation: Political scientists (32.8 times more common than national distribution)
> Annual wage of area political scientists: $126,070 (national median wage: $122,220)
> 2019 poverty rate: 7.5% (366th highest out of 383 metro areas)
The Washington, D.C. metro area reported one of the highest annual median wages in 2019 — most workers earned over $56,000 per year. Not surprisingly, the metro area encompassing the nation’s capital has a relatively high concentration of political scientists compared to the national concentration. The second most concentrated job in this area is economists, and in both of these professions, most workers earned over $120,000 in 2019.
Washington, D.C. area residents are likely to be very wealthy with 20.3% of area households earning over $200,000 per year, the fourth highest share of metro areas in the country.

3. San Francisco-Oakland-Hayward, CA
> 2019 annual median wage: $57,040
> Most highly concentrated occupation: Cooks, private household (7.0 times more common than national distribution)
> Annual wage of area cooks, private household: $46,310 (national median wage: $37,870)
> 2019 poverty rate: 8.2% (354th highest out of 383 metro areas)
The San Francisco-Oakland-Hayward area, known as the Bay Area of California, is one of just three major U.S. metro areas in which most workers earn over $57,000 per year in wages.
Income and educational attainment level are closely correlated, and the San Francisco Bay Area is one of the best educated places in the country. It is one of just seven major metropolitan areas in which more than half of residents 25 and older hold at least a bachelor’s degree, compared to less than a third of adults that age nationwide.

2. San Jose-Sunnyvale-Santa Clara, CA
> 2019 annual median wage: $61,980
> Most highly concentrated occupation: Computer hardware engineers (16.4 times more common than national distribution)
> Annual wage of area computer hardware engineers: $155,680 (national median wage: $117,220)
> 2019 poverty rate: 6.3% (378th highest out of 383 metro areas)
The San Jose-Sunnyvale-Santa Clara metro area of California reported the second highest annual median wage of any metro area in 2019, with the typical worker earning nearly $62,000 per year.
The San Jose area is the heart of Silicon Valley, a place where many of the world’s largest tech companies are headquartered — companies like Apple, Google, and more. Computer hardware engineers can expect high wages virtually everywhere in the U.S., with a median income over $117,000, but the annual median wage for these workers in the San Jose area is much higher, at nearly $156,000 per year.
[in-text-ad-2]

1. California-Lexington Park, MD
> 2019 annual median wage: $63,040
> Most highly concentrated occupation: Aerospace engineers (45.8 times more common than national distribution)
> Annual wage of area aerospace engineers: $117,660 (national median wage: $116,500)
> 2019 poverty rate: 7.3% (367th highest out of 383 metro areas)
The California-Lexington Park metro area is near the southern tip of Maryland and within commuting distance of Washington, D.C. The area’s annual median wage in 2019 was $63,040 — the most of any major metro area in the U.S. and well above the U.S. median wage for all jobs that year of $39,810.
Many of the largest employers in the area are government defense contractors, like Booz Allen Hamilton, Northrop Grumman, Lockheed Martin and more. These companies, which the government contracts to develop new technology, tend to pay employees relatively high wages.
Methodology:
To identify the cities with the highest and lowest paying jobs, 24/7 Wall St. reviewed the annual median wage in 389 metropolitan statistical areas using data from the May 2019 Occupational Employment Statistics program of the Bureau of Labor Statistics. Cities were ranked based on the annual median wage for all occupations, including part-time work.
The measure of concentration of various occupations is based on location quotient of employment, which also comes from the BLS OES. Location quotients are ratios measuring the relative concentration of jobs in an area compared to their concentration in the national workforce. Supplemental data on unemployment rates came from the BLS Local Area Unemployment Statistics program and is seasonally adjusted for December 2020. Data on poverty rates came from the U.S. Census Bureau’s 2019 American Community Survey and figures are one-year estimates. Job categories defined as miscellaneous or that include the description “all other” were not considered for the most highly concentrated job.
Cash Back Credit Cards Have Never Been This Good
Credit card companies are at war, handing out free rewards and benefits to win the best customers. A good cash back card can be worth thousands of dollars a year in free money, not to mention other perks like travel, insurance, and access to fancy lounges. See our top picks for the best credit cards today. You won’t want to miss some of these offers.
Flywheel Publishing has partnered with CardRatings for our coverage of credit card products. Flywheel Publishing and CardRatings may receive a commission from card issuers.
Thank you for reading! Have some feedback for us?
Contact the 24/7 Wall St. editorial team.
 24/7 Wall St.
 24/7 Wall St.

