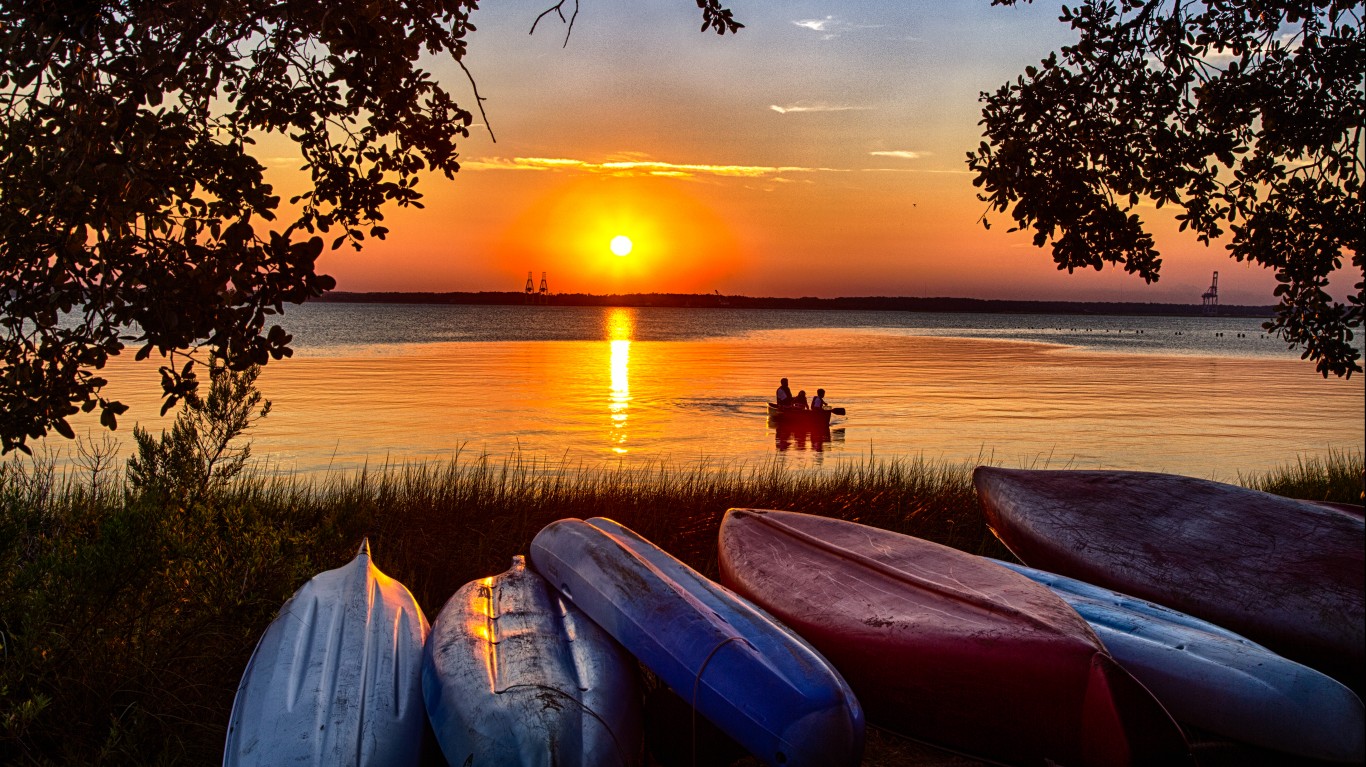
Perhaps one silver lining of the COVID-19 pandemic, especially for people who love the outdoors, is that people were forced to spend more time outside. According to a OnePoll survey from September 2020, about 60% of the 2,000 participants said they did not appreciate nature as much as they should have before the pandemic. About 40% said they had actually become more physically active, engaging in outdoor activities.
For most of 2020, people were asked to avoid getting together or meeting indoors. Instead, many turned to parks. As health officials discouraged nonessential travel, international tourism nearly screeched to a halt, and some parks closing for a portion of the year, visitations to national parks fell by about a third in 2020 compared to 2019. Still, millions of Americans ventured out into the wilderness.
To identify the national parks that have grown in popularity, 24/7 Tempo reviewed data on the change in recreational visits between 1980 and 2020 published in the National Park Service’s annual visitation report.
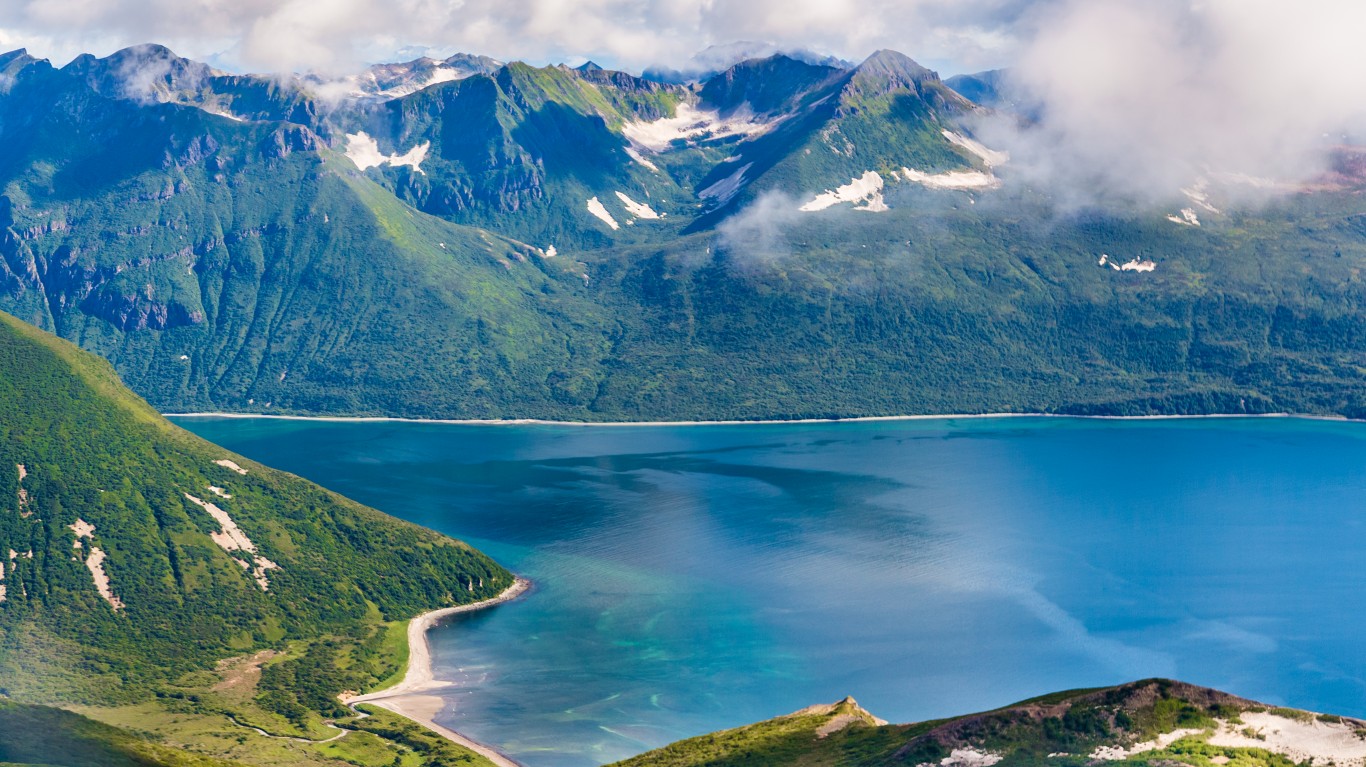
The vast majority of parks on this list gained popularity up through 2019, but visits dropped in 2020 as access was restricted due to COVID-19 and attendance dropped. For example, recreational visits to the Glacier Bay National Park and Preserve in Alaska increased from merely 95,000 in 1980 to over 672,000 in 2019 but dropped to nearly 6,000 in 2020.
Another national park in Alaska had a similar fate. More than 216,000 people visited Denali National Park and Preserve. The number of visitors grew to more than 601,000 in 2019, only to collapse to about 55,000 in 2020.
Over the last four decades, the list of the most popular national parks every year has remained largely unchanged with Great Smoky Mountains along the North Carolina and Tennessee border topping the charts every year. These all-time favorite parks have seen 20% to 50% growth in the number of visits over the years. Other parks that are somewhat less popular, however, have seen a growth of more than 700%.
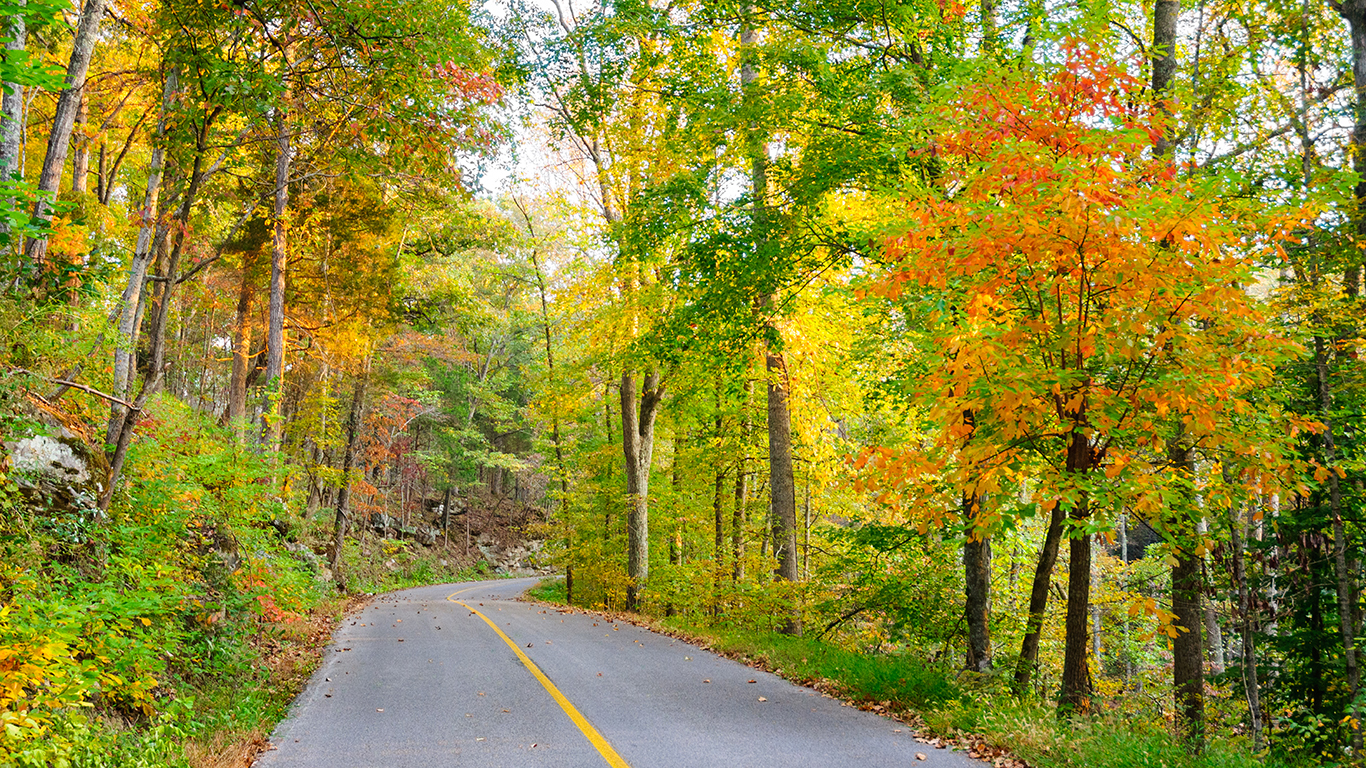
Exploring the wilderness, hiking through mountains, and sleeping under the stars are just some of the nature experiences these parks have to offer, often free of charge. And these are the national parks that had the most visitors in 2020.
Click here for the national parks that have grown most in popularity since 1980
Methodology
To identify the national parks that have grown in popularity, 24/7 Tempo reviewed data on the change in recreational visits between 1980 and 2020 published in the National Park Service’s annual visitation report. The NPS aggregates visitation data for various government land designations and visitation purposes. Only National Parks (NP) and National Parks and Preserves (NP & PRES) were considered in our analysis.
To avoid double counting land area, designations such as national monuments and historic sites, which are frequently contained within national parks and are often limited to single structures, were excluded.
Visitation data for each park for 2019 was also obtained from the NPS.
Gates of the Arctic NP & PRES, Kenai Fjords NP, Kobuk Valley NP, Lake Clark NP & PRES were excluded because they were officially established as national parks on Dec. 2, 1980 and were not in the NPS data for 1980 visits.
Congaree NP and National Park of American Samoa were excluded because they were not officially established as national parks until 2003 and 1988, respectively, and were not in the NPS data for 1980.
NPS did not have recreation visits data for New River Gorge NP & PRES and Wrangell-St. Elias NP & PRES, which were established as national parks in 1978.
Click here to see
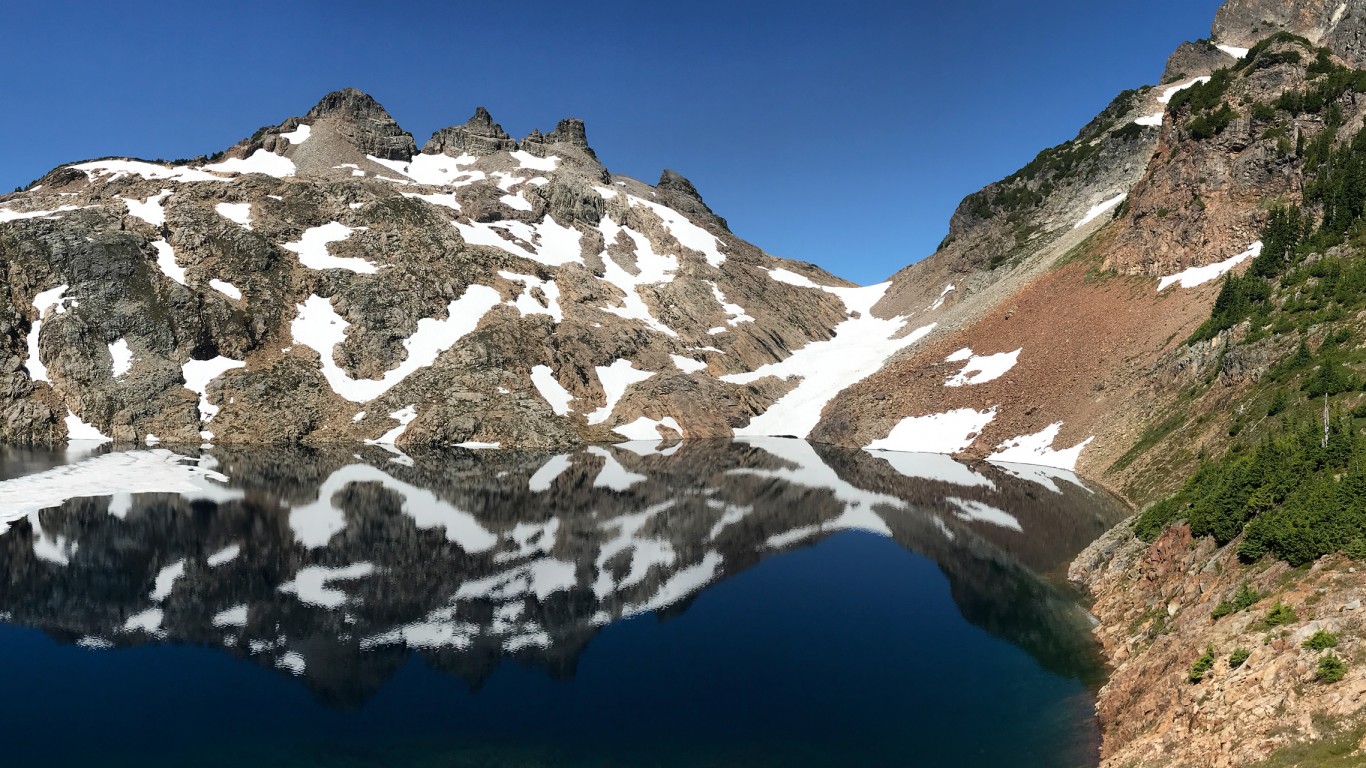
55. North Cascades NP
> Change in visits, 1980-2020: -96.1%
> Recreation visits in 1980: 796,079 — 1.48% of all NP recreation visits in 1980
> Recreation visits in 2020: 30,885 — 0.05% of all NP recreation visits in 2020
> Recreation visits in 2019: 38,208 — 0.04% of all NP recreation visits in 2019
> Change in visits, 1980-2019 -95.2% — the largest decrease
[in-text-ad]

54. Glacier Bay NP & PRES
> Change in visits, 1980-2020: -93.9%
> Recreation visits in 1980: 95,005 — 0.18% of all NP recreation visits in 1980
> Recreation visits in 2020: 5,748 — 0.01% of all NP recreation visits in 2020
> Recreation visits in 2019: 672,087 — 0.74% of all NP recreation visits in 2019
> Change in visits, 1980-2019 607.4% — the 4th largest increase
[recirclink id=823294]
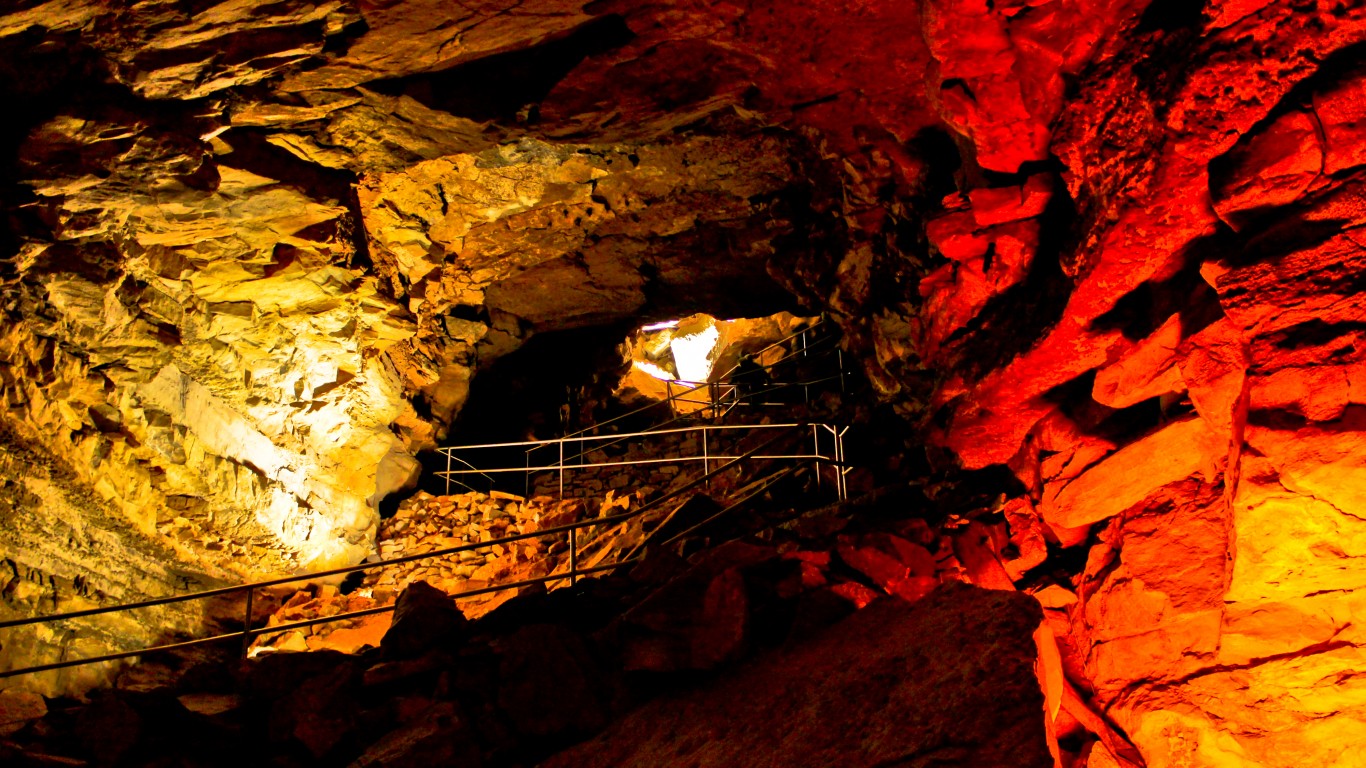
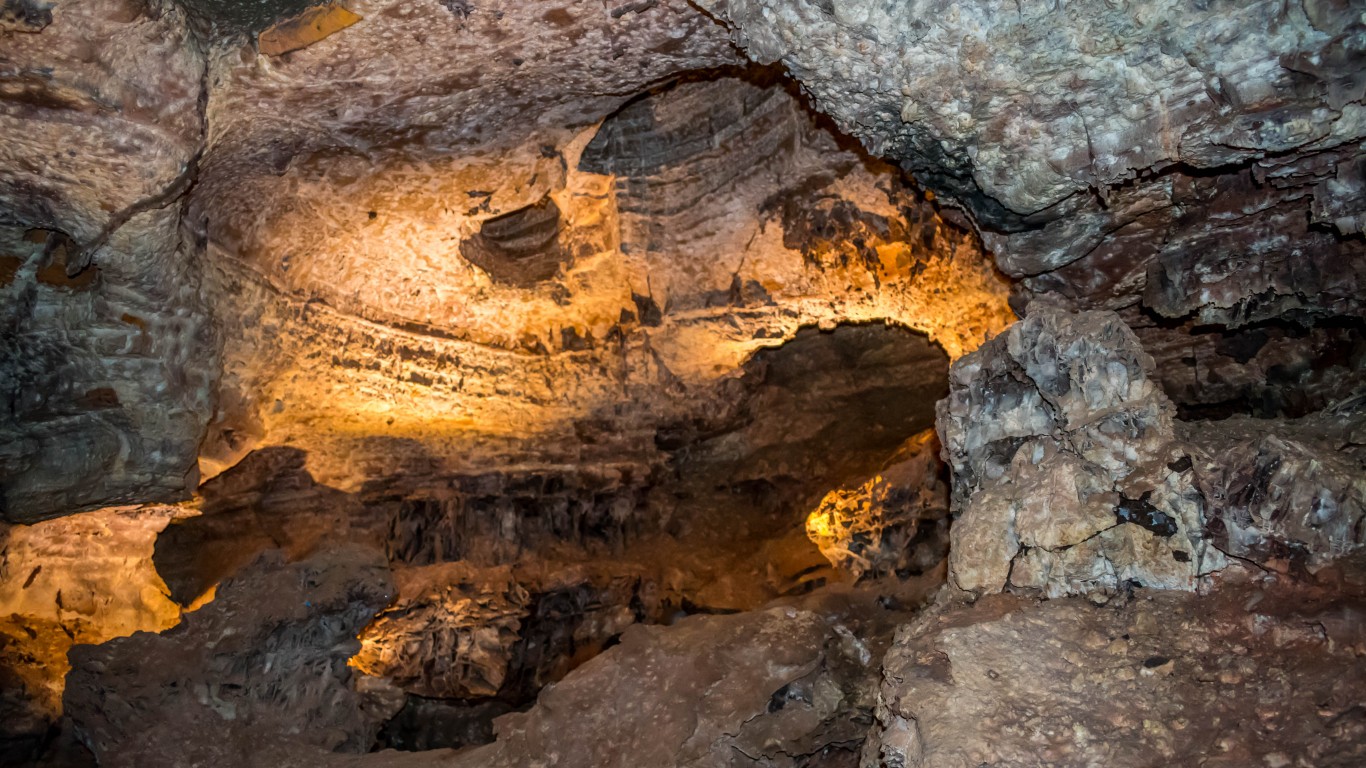
53. Mammoth Cave NP
> Change in visits, 1980-2020: -80.6%
> Recreation visits in 1980: 1,495,787 — 2.77% of all NP recreation visits in 1980
> Recreation visits in 2020: 290,392 — 0.43% of all NP recreation visits in 2020
> Recreation visits in 2019: 551,590 — 0.61% of all NP recreation visits in 2019
> Change in visits, 1980-2019 -63.1% — the 3rd largest decrease
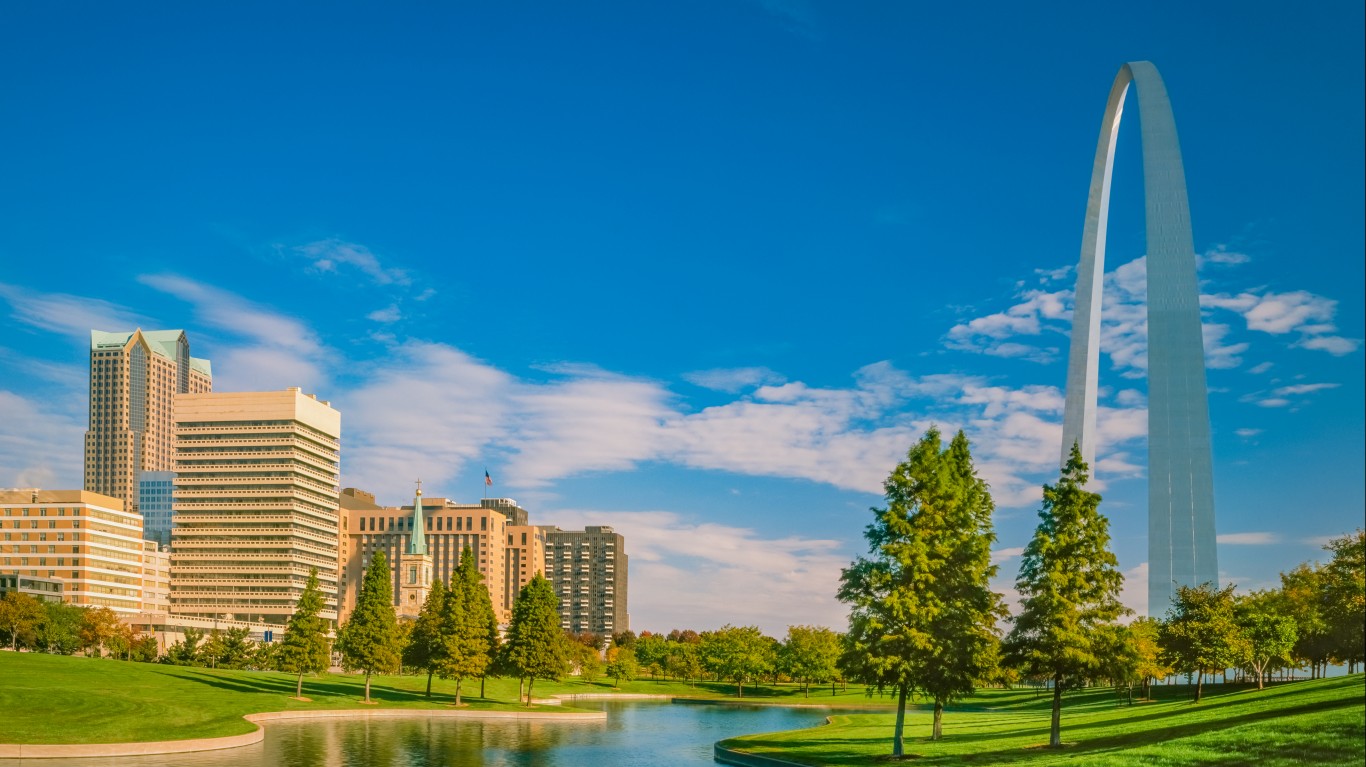
52. Gateway Arch NP
> Change in visits, 1980-2020: -74.8%
> Recreation visits in 1980: 1,928,825 — 3.58% of all NP recreation visits in 1980
> Recreation visits in 2020: 486,021 — 0.72% of all NP recreation visits in 2020
> Recreation visits in 2019: 2,055,309 — 2.26% of all NP recreation visits in 2019
> Change in visits, 1980-2019 6.6% — the 3rd smallest increase
[in-text-ad-2]
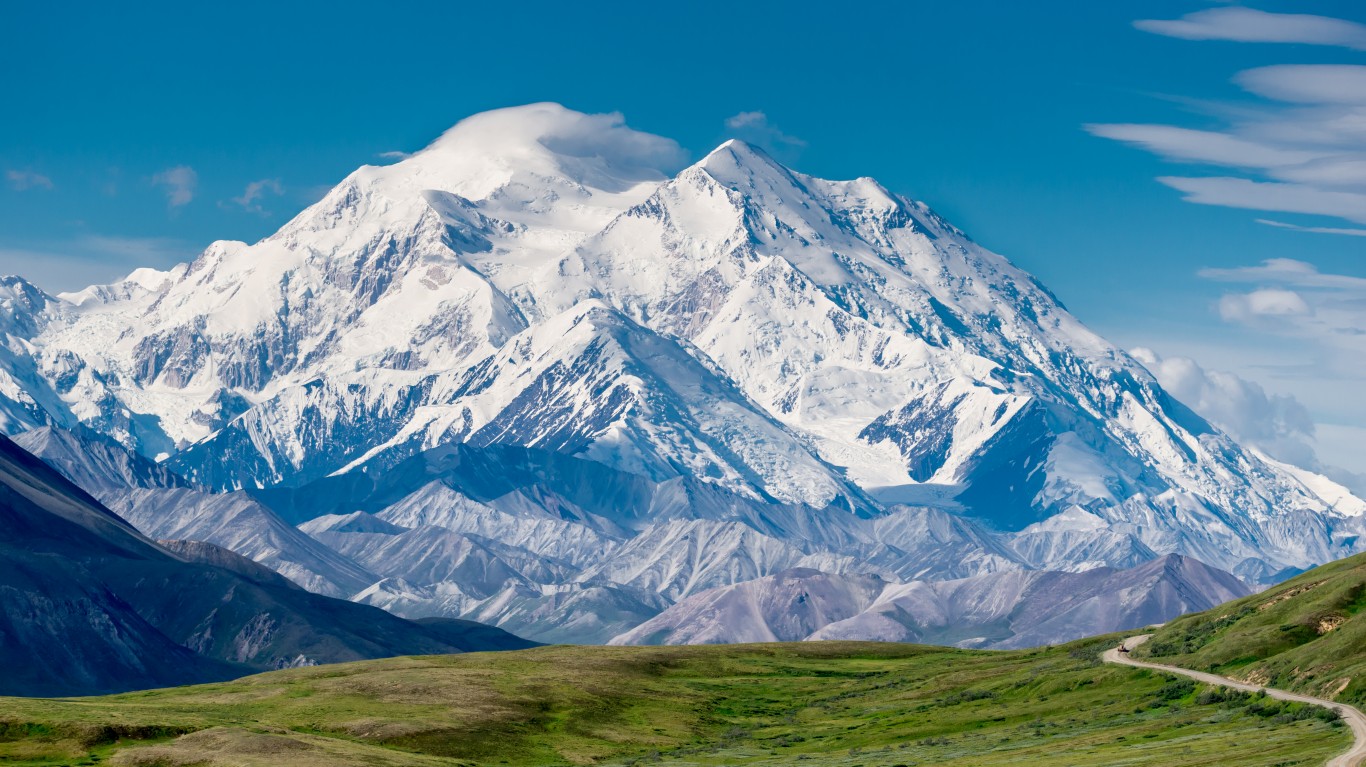
51. Denali NP & PRES
> Change in visits, 1980-2020: -74.6%
> Recreation visits in 1980: 216,361 — 0.40% of all NP recreation visits in 1980
> Recreation visits in 2020: 54,850 — 0.08% of all NP recreation visits in 2020
> Recreation visits in 2019: 601,152 — 0.66% of all NP recreation visits in 2019
> Change in visits, 1980-2019 177.8% — the 16th largest increase
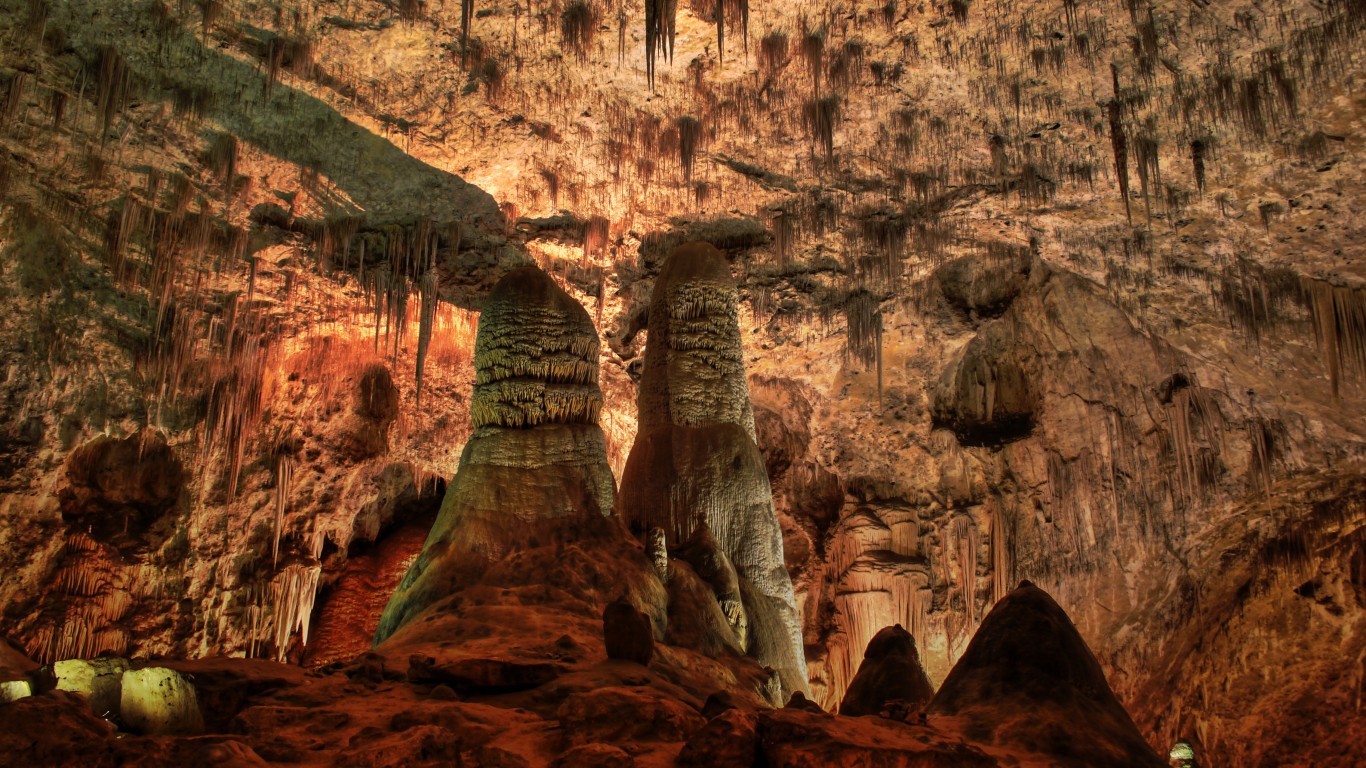
50. Carlsbad Caverns NP
> Change in visits, 1980-2020: -72.7%
> Recreation visits in 1980: 672,963 — 1.25% of all NP recreation visits in 1980
> Recreation visits in 2020: 183,835 — 0.27% of all NP recreation visits in 2020
> Recreation visits in 2019: 440,691 — 0.48% of all NP recreation visits in 2019
> Change in visits, 1980-2019 -34.5% — the 4th largest decrease
[in-text-ad]
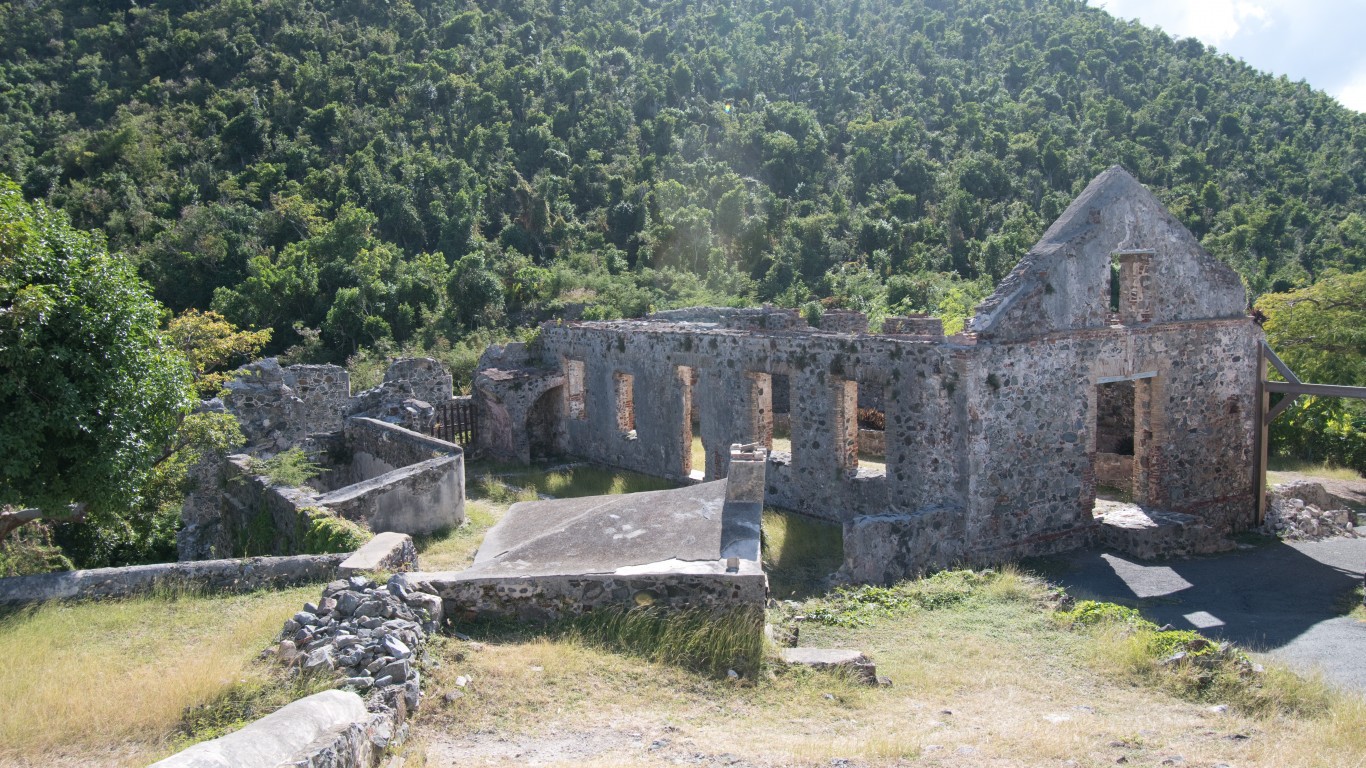
49. Virgin Islands NP
> Change in visits, 1980-2020: -69.4%
> Recreation visits in 1980: 547,918 — 1.02% of all NP recreation visits in 1980
> Recreation visits in 2020: 167,540 — 0.25% of all NP recreation visits in 2020
> Recreation visits in 2019: 133,398 — 0.15% of all NP recreation visits in 2019
> Change in visits, 1980-2019 -75.7% — the 2nd largest decrease
[recirclink id=542888]

48. Hawaii Volcanoes NP
> Change in visits, 1980-2020: -65.2%
> Recreation visits in 1980: 1,692,338 — 3.14% of all NP recreation visits in 1980
> Recreation visits in 2020: 589,775 — 0.87% of all NP recreation visits in 2020
> Recreation visits in 2019: 1,368,376 — 1.50% of all NP recreation visits in 2019
> Change in visits, 1980-2019 -19.1% — the 4th smallest decrease

47. Isle Royale NP
> Change in visits, 1980-2020: -56.6%
> Recreation visits in 1980: 14,977 — 0.03% of all NP recreation visits in 1980
> Recreation visits in 2020: 6,493 — 0.01% of all NP recreation visits in 2020
> Recreation visits in 2019: 26,410 — 0.03% of all NP recreation visits in 2019
> Change in visits, 1980-2019 76.3% — the 24th largest increase
[in-text-ad-2]

46. Kings Canyon NP
> Change in visits, 1980-2020: -49.3%
> Recreation visits in 1980: 819,065 — 1.52% of all NP recreation visits in 1980
> Recreation visits in 2020: 415,077 — 0.61% of all NP recreation visits in 2020
> Recreation visits in 2019: 632,110 — 0.69% of all NP recreation visits in 2019
> Change in visits, 1980-2019 -22.8% — the 5th largest decrease

45. Mesa Verde NP
> Change in visits, 1980-2020: -46.7%
> Recreation visits in 1980: 539,257 — 1.00% of all NP recreation visits in 1980
> Recreation visits in 2020: 287,477 — 0.42% of all NP recreation visits in 2020
> Recreation visits in 2019: 556,203 — 0.61% of all NP recreation visits in 2019
> Change in visits, 1980-2019 3.1% — the 2nd smallest increase
[in-text-ad]
44. Redwood NP
> Change in visits, 1980-2020: -43.8%
> Recreation visits in 1980: 471,710 — 0.87% of all NP recreation visits in 1980
> Recreation visits in 2020: 265,177 — 0.39% of all NP recreation visits in 2020
> Recreation visits in 2019: 504,722 — 0.55% of all NP recreation visits in 2019
> Change in visits, 1980-2019 7.0% — the 4th smallest increase
[recirclink id=412413]

43. Petrified Forest NP
> Change in visits, 1980-2020: -43.7%
> Recreation visits in 1980: 683,121 — 1.27% of all NP recreation visits in 1980
> Recreation visits in 2020: 384,483 — 0.57% of all NP recreation visits in 2020
> Recreation visits in 2019: 643,588 — 0.71% of all NP recreation visits in 2019
> Change in visits, 1980-2019 -5.8% — the smallest decrease

42. Haleakala NP
> Change in visits, 1980-2020: -43.0%
> Recreation visits in 1980: 560,238 — 1.04% of all NP recreation visits in 1980
> Recreation visits in 2020: 319,147 — 0.47% of all NP recreation visits in 2020
> Recreation visits in 2019: 994,394 — 1.09% of all NP recreation visits in 2019
> Change in visits, 1980-2019 77.5% — the 22nd largest increase
[in-text-ad-2]

41. White Sands NP
> Change in visits, 1980-2020: -18.8%
> Recreation visits in 1980: 511,476 — 0.95% of all NP recreation visits in 1980
> Recreation visits in 2020: 415,383 — 0.61% of all NP recreation visits in 2020
> Recreation visits in 2019: 608,785 — 0.67% of all NP recreation visits in 2019
> Change in visits, 1980-2019 19.0% — the 8th smallest increase

40. Yosemite NP
> Change in visits, 1980-2020: -8.9%
> Recreation visits in 1980: 2,490,282 — 4.62% of all NP recreation visits in 1980
> Recreation visits in 2020: 2,268,313 — 3.34% of all NP recreation visits in 2020
> Recreation visits in 2019: 4,422,861 — 4.86% of all NP recreation visits in 2019
> Change in visits, 1980-2019 77.6% — the 21st largest increase
[in-text-ad]
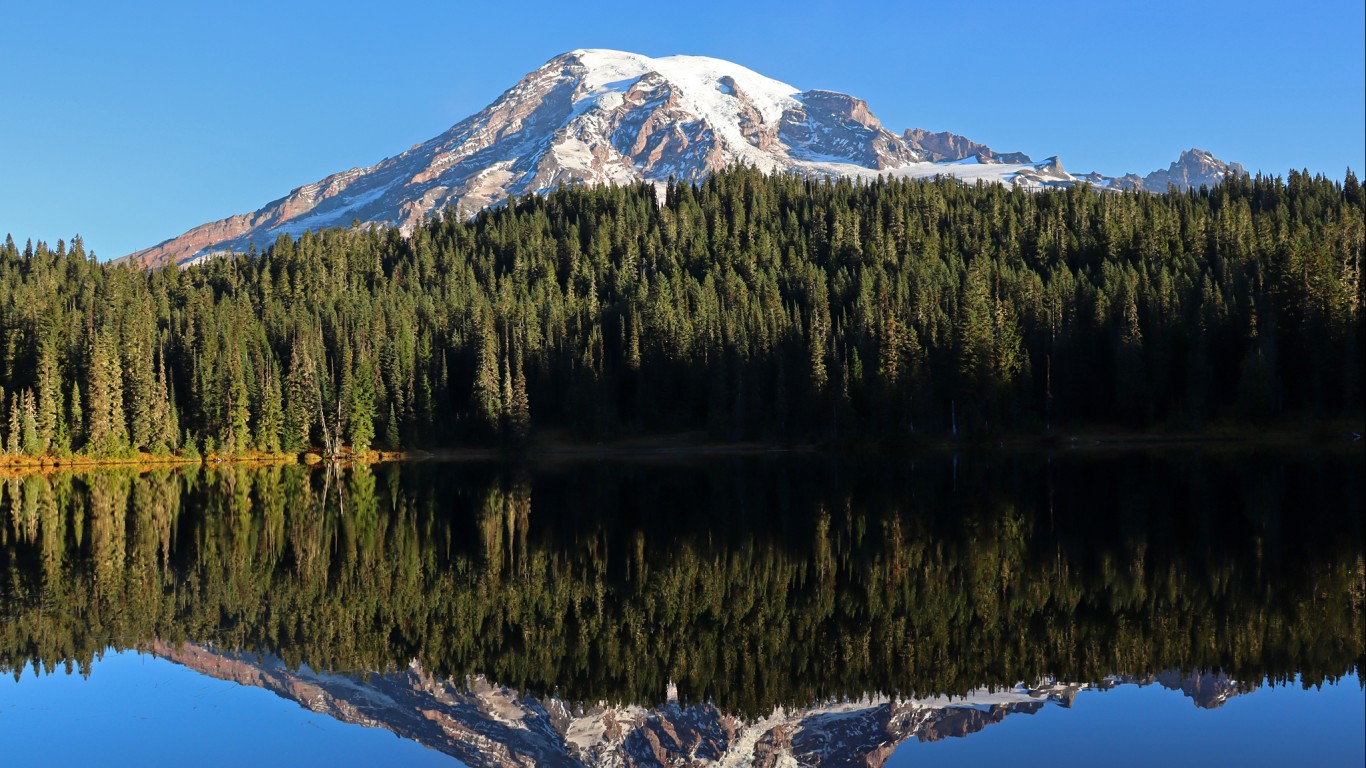
39. Mount Rainier NP
> Change in visits, 1980-2020: -8.5%
> Recreation visits in 1980: 1,268,256 — 2.35% of all NP recreation visits in 1980
> Recreation visits in 2020: 1,160,754 — 1.71% of all NP recreation visits in 2020
> Recreation visits in 2019: 1,501,621 — 1.65% of all NP recreation visits in 2019
> Change in visits, 1980-2019 18.4% — the 7th smallest increase
[recirclink id=561922]

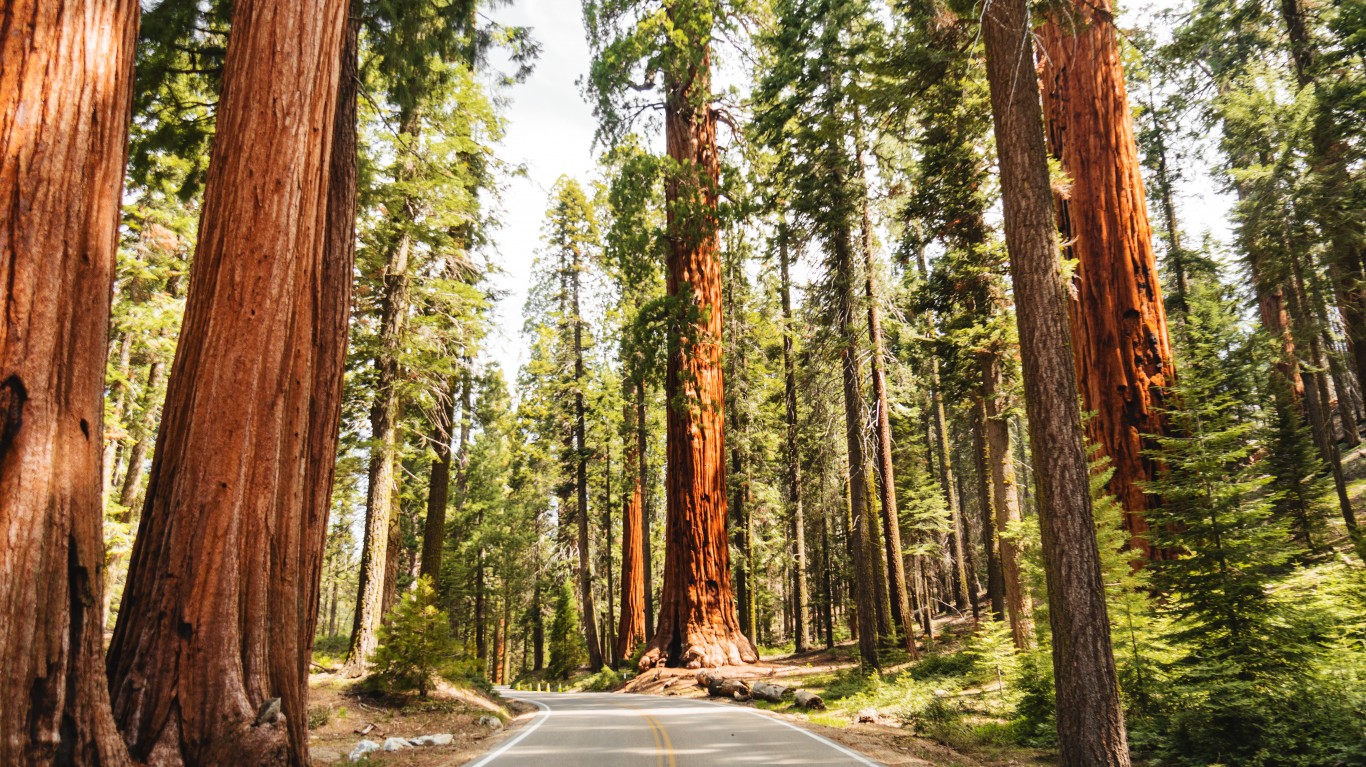
38. Sequoia NP
> Change in visits, 1980-2020: -7.7%
> Recreation visits in 1980: 862,397 — 1.60% of all NP recreation visits in 1980
> Recreation visits in 2020: 796,086 — 1.17% of all NP recreation visits in 2020
> Recreation visits in 2019: 1,246,053 — 1.37% of all NP recreation visits in 2019
> Change in visits, 1980-2019 44.5% — the 16th smallest increase
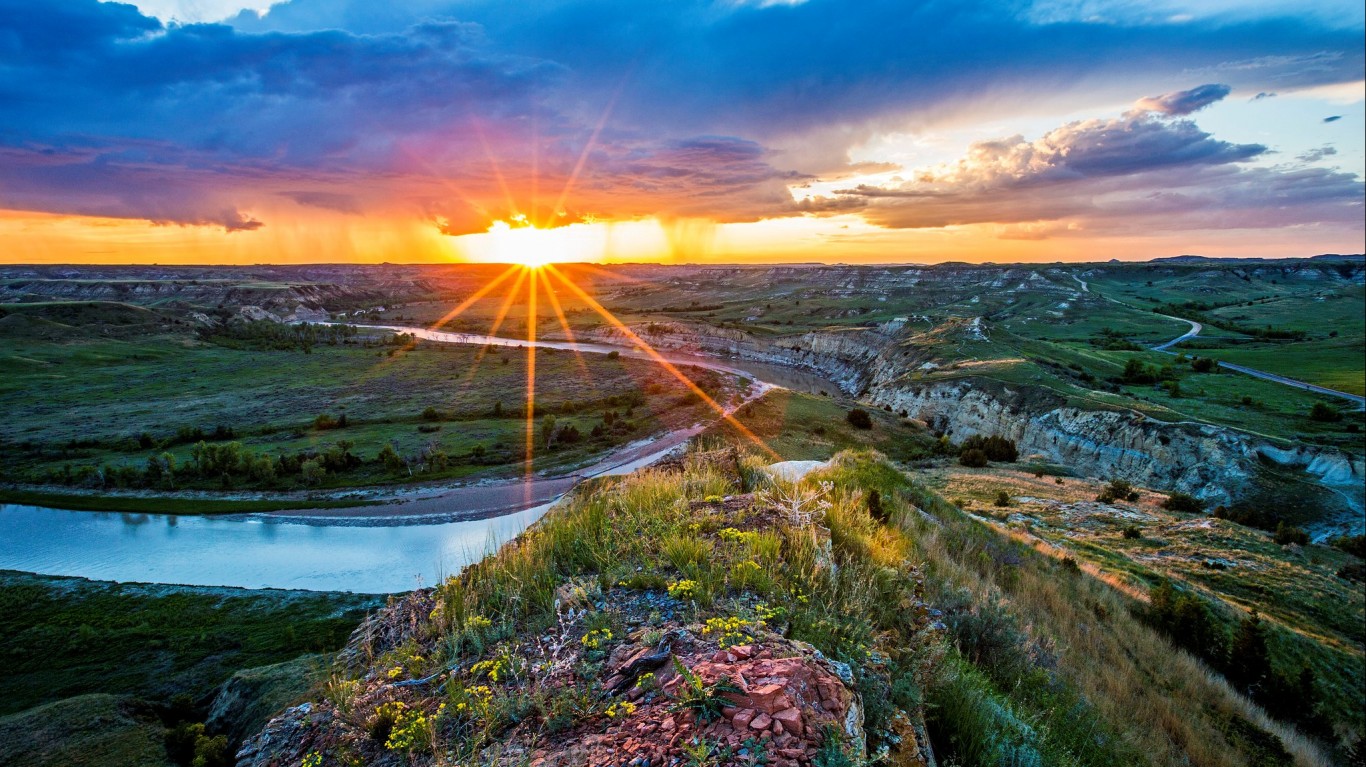
37. Theodore Roosevelt NP
> Change in visits, 1980-2020: -7.5%
> Recreation visits in 1980: 595,734 — 1.10% of all NP recreation visits in 1980
> Recreation visits in 2020: 551,303 — 0.81% of all NP recreation visits in 2020
> Recreation visits in 2019: 691,658 — 0.76% of all NP recreation visits in 2019
> Change in visits, 1980-2019 16.1% — the 6th smallest increase
[in-text-ad-2]

36. Everglades NP
> Change in visits, 1980-2020: -5.6%
> Recreation visits in 1980: 744,244 — 1.38% of all NP recreation visits in 1980
> Recreation visits in 2020: 702,319 — 1.03% of all NP recreation visits in 2020
> Recreation visits in 2019: 1,118,300 — 1.23% of all NP recreation visits in 2019
> Change in visits, 1980-2019 50.3% — the 18th smallest increase
35. Wind Cave NP
> Change in visits, 1980-2020: -5.2%
> Recreation visits in 1980: 473,061 — 0.88% of all NP recreation visits in 1980
> Recreation visits in 2020: 448,405 — 0.66% of all NP recreation visits in 2020
> Recreation visits in 2019: 615,350 — 0.68% of all NP recreation visits in 2019
> Change in visits, 1980-2019 30.1% — the 12th smallest increase
[in-text-ad]
34. Acadia NP
> Change in visits, 1980-2020: -4.0%
> Recreation visits in 1980: 2,779,666 — 5.16% of all NP recreation visits in 1980
> Recreation visits in 2020: 2,669,034 — 3.93% of all NP recreation visits in 2020
> Recreation visits in 2019: 3,437,286 — 3.78% of all NP recreation visits in 2019
> Change in visits, 1980-2019 23.7% — the 9th smallest increase
[recirclink id=723473]
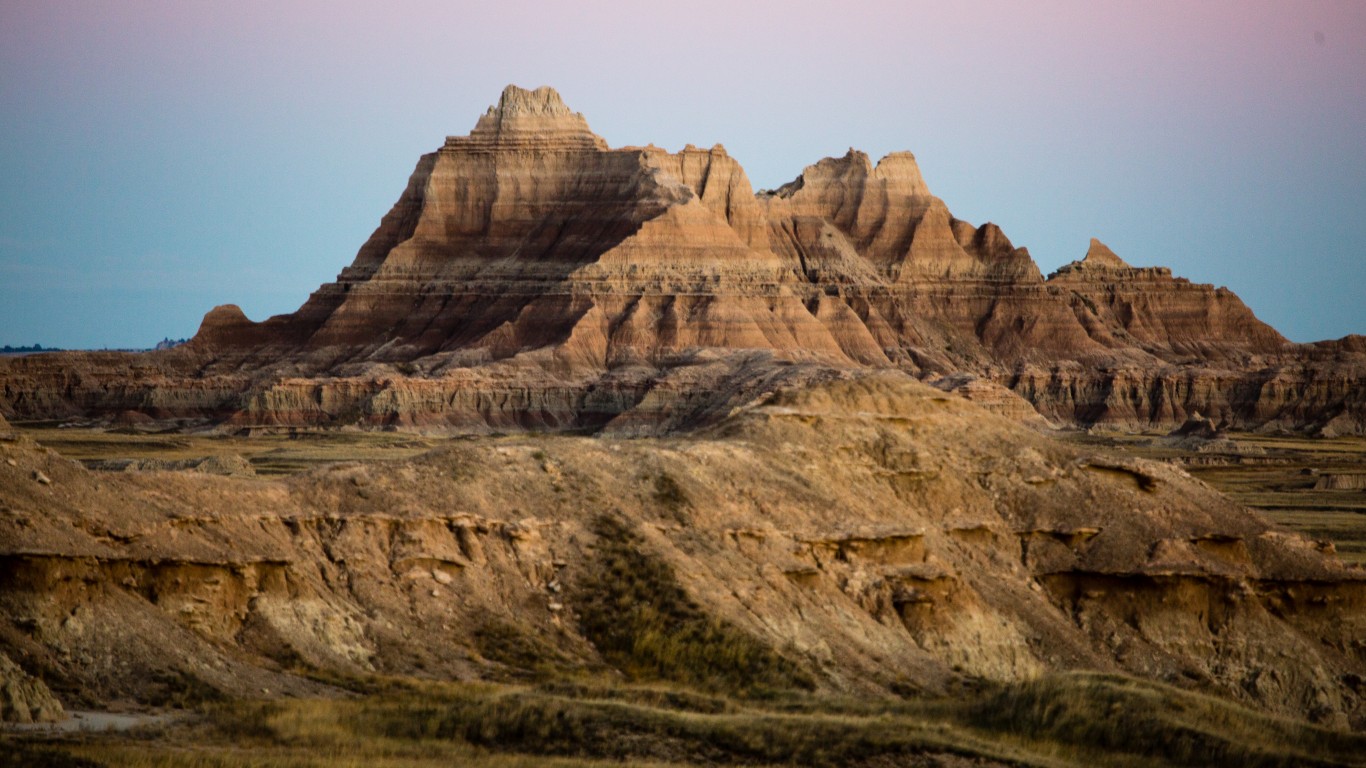
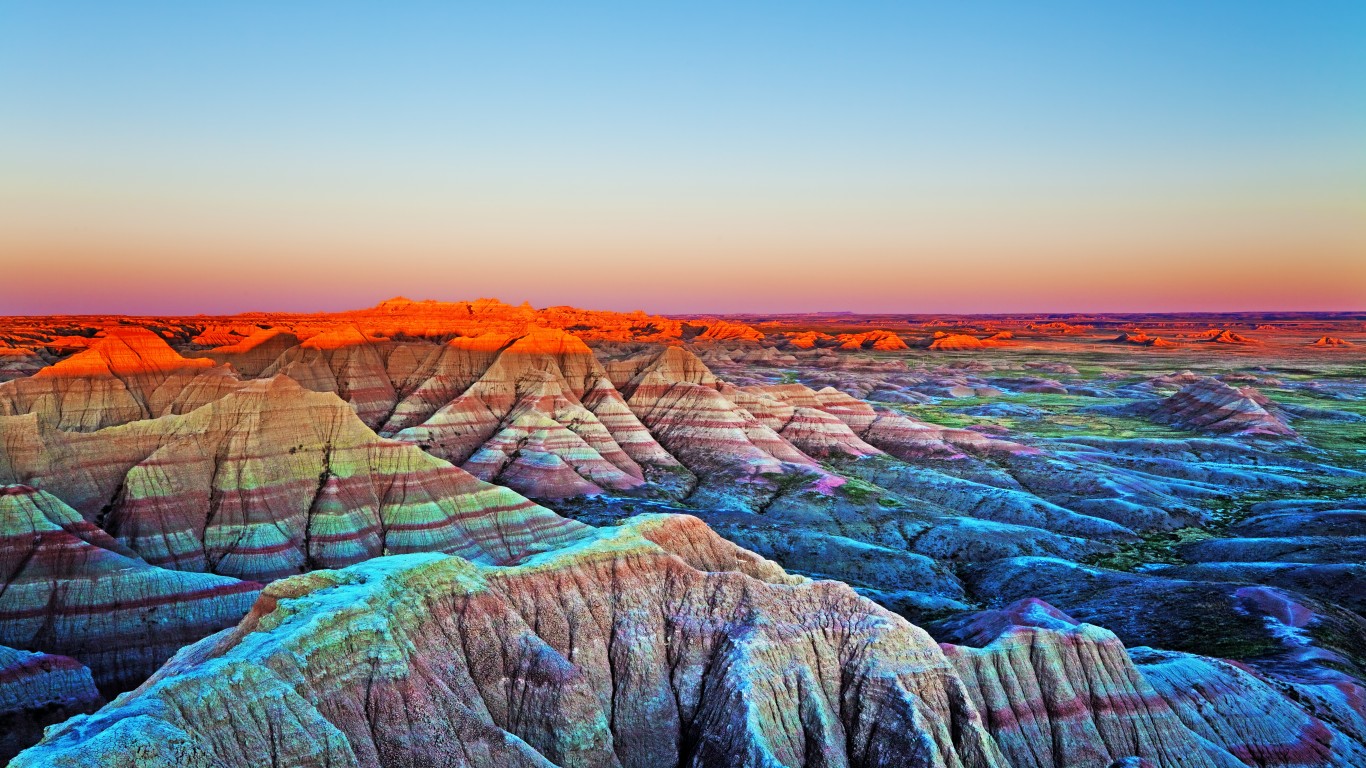
33. Badlands NP
> Change in visits, 1980-2020: -3.7%
> Recreation visits in 1980: 952,652 — 1.77% of all NP recreation visits in 1980
> Recreation visits in 2020: 916,932 — 1.35% of all NP recreation visits in 2020
> Recreation visits in 2019: 970,998 — 1.07% of all NP recreation visits in 2019
> Change in visits, 1980-2019 1.9% — the smallest increase

32. Shenandoah NP
> Change in visits, 1980-2020: -1.9%
> Recreation visits in 1980: 1,699,228 — 3.15% of all NP recreation visits in 1980
> Recreation visits in 2020: 1,666,265 — 2.45% of all NP recreation visits in 2020
> Recreation visits in 2019: 1,425,507 — 1.57% of all NP recreation visits in 2019
> Change in visits, 1980-2019 -16.1% — the 3rd smallest decrease
[in-text-ad-2]

31. Voyageurs NP
> Change in visits, 1980-2020: -1.4%
> Recreation visits in 1980: 266,935 — 0.50% of all NP recreation visits in 1980
> Recreation visits in 2020: 263,091 — 0.39% of all NP recreation visits in 2020
> Recreation visits in 2019: 232,974 — 0.26% of all NP recreation visits in 2019
> Change in visits, 1980-2019 -12.7% — the 2nd smallest decrease

30. Pinnacles NP
> Change in visits, 1980-2020: 1.3%
> Recreation visits in 1980: 163,626 — 0.30% of all NP recreation visits in 1980
> Recreation visits in 2020: 165,740 — 0.24% of all NP recreation visits in 2020
> Recreation visits in 2019: 177,224 — 0.19% of all NP recreation visits in 2019
> Change in visits, 1980-2019 8.3% — the 5th smallest increase
[in-text-ad]
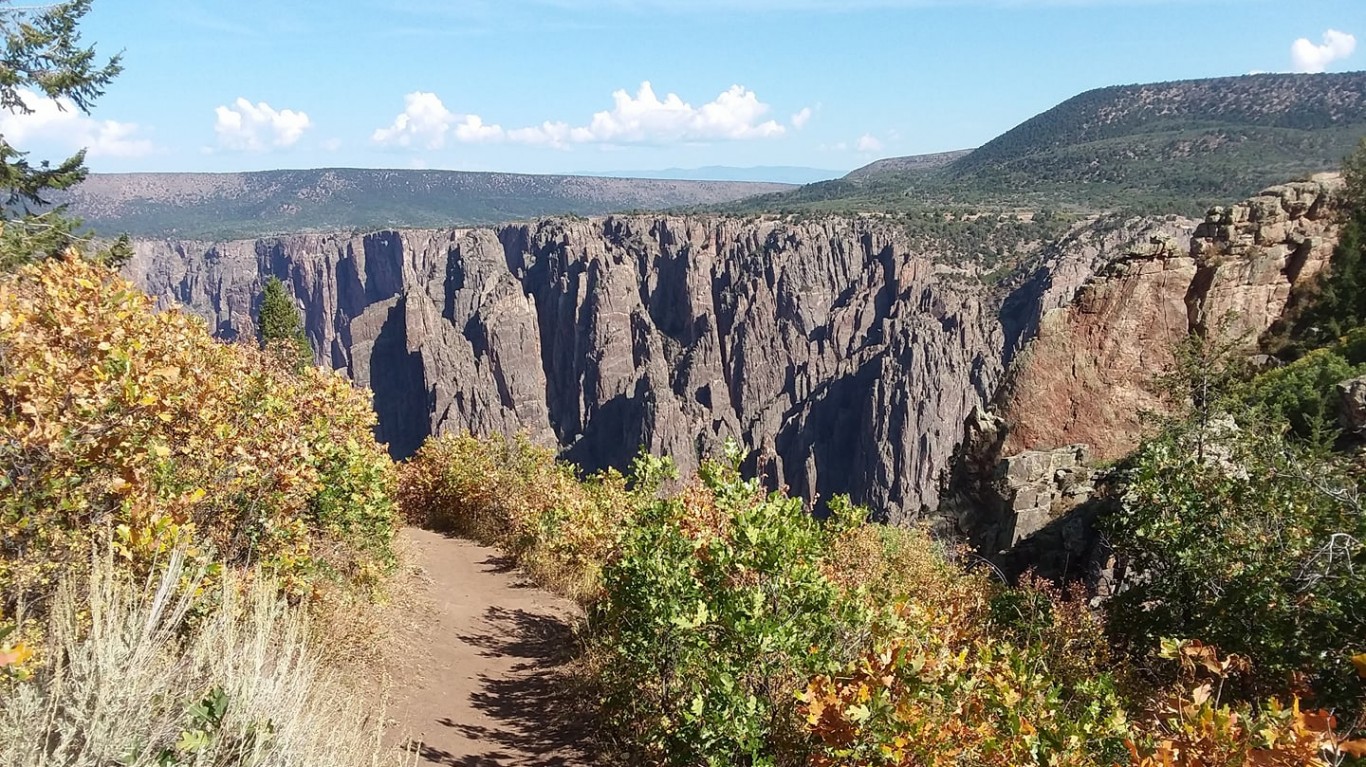
29. Black Canyon of the Gunnison NP
> Change in visits, 1980-2020: 1.6%
> Recreation visits in 1980: 336,119 — 0.62% of all NP recreation visits in 1980
> Recreation visits in 2020: 341,620 — 0.50% of all NP recreation visits in 2020
> Recreation visits in 2019: 432,818 — 0.48% of all NP recreation visits in 2019
> Change in visits, 1980-2019 28.8% — the 11th smallest increase
[recirclink id=495327]
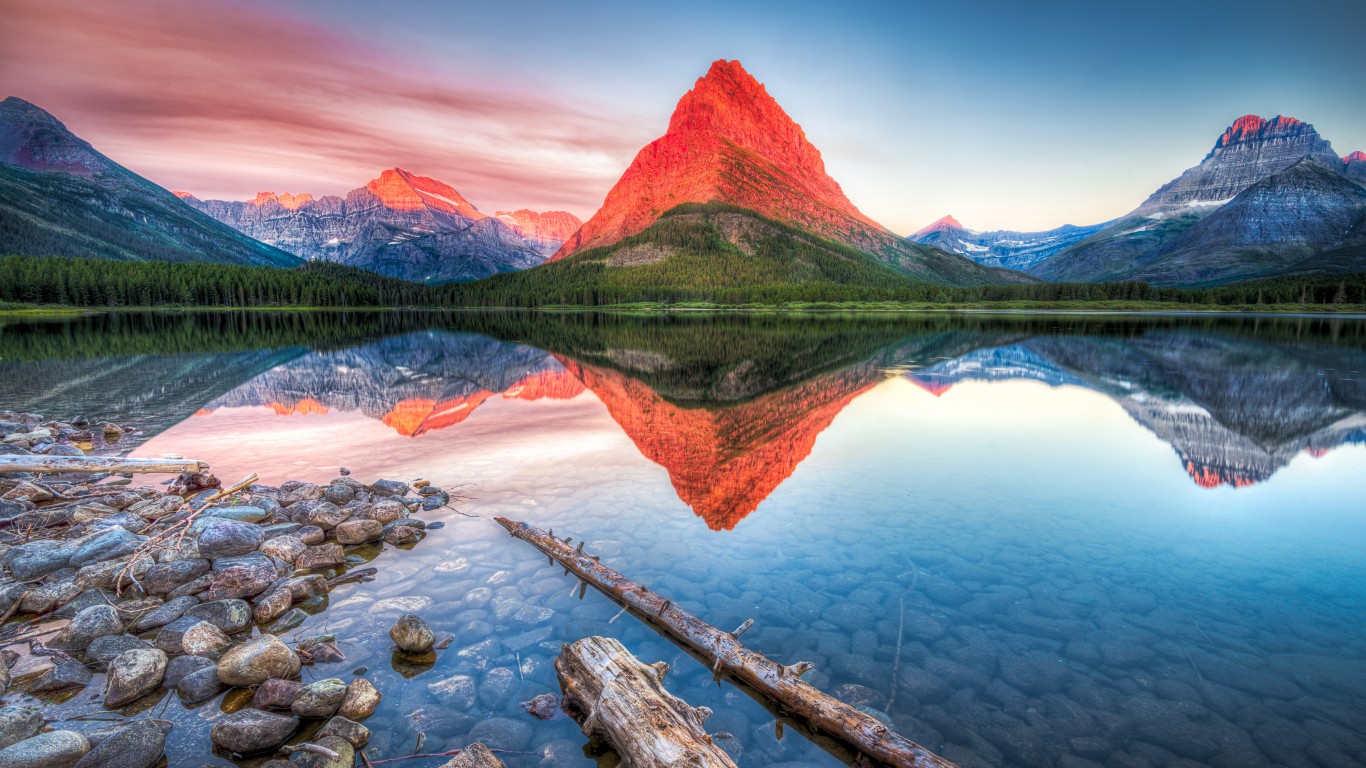
28. Glacier NP
> Change in visits, 1980-2020: 15.2%
> Recreation visits in 1980: 1,474,578 — 2.73% of all NP recreation visits in 1980
> Recreation visits in 2020: 1,698,864 — 2.50% of all NP recreation visits in 2020
> Recreation visits in 2019: 3,049,839 — 3.35% of all NP recreation visits in 2019
> Change in visits, 1980-2019 106.8% — the 19th largest increase
27. Hot Springs NP
> Change in visits, 1980-2020: 16.2%
> Recreation visits in 1980: 1,160,588 — 2.15% of all NP recreation visits in 1980
> Recreation visits in 2020: 1,348,215 — 1.98% of all NP recreation visits in 2020
> Recreation visits in 2019: 1,467,153 — 1.61% of all NP recreation visits in 2019
> Change in visits, 1980-2019 26.4% — the 10th smallest increase
[in-text-ad-2]
)")
26. Olympic NP
> Change in visits, 1980-2020: 23.0%
> Recreation visits in 1980: 2,032,418 — 3.77% of all NP recreation visits in 1980
> Recreation visits in 2020: 2,499,177 — 3.68% of all NP recreation visits in 2020
> Recreation visits in 2019: 3,245,806 — 3.57% of all NP recreation visits in 2019
> Change in visits, 1980-2019 59.7% — the 20th smallest increase

25. Saguaro NP
> Change in visits, 1980-2020: 24.7%
> Recreation visits in 1980: 611,317 — 1.13% of all NP recreation visits in 1980
> Recreation visits in 2020: 762,226 — 1.12% of all NP recreation visits in 2020
> Recreation visits in 2019: 1,020,226 — 1.12% of all NP recreation visits in 2019
> Change in visits, 1980-2019 66.9% — the 22nd smallest increase
[in-text-ad]

24. Rocky Mountain NP
> Change in visits, 1980-2020: 25.1%
> Recreation visits in 1980: 2,641,937 — 4.90% of all NP recreation visits in 1980
> Recreation visits in 2020: 3,305,199 — 4.87% of all NP recreation visits in 2020
> Recreation visits in 2019: 4,670,053 — 5.13% of all NP recreation visits in 2019
> Change in visits, 1980-2019 76.8% — the 23rd largest increase
[recirclink id=826467]

23. Grand Canyon NP
> Change in visits, 1980-2020: 25.7%
> Recreation visits in 1980: 2,304,973 — 4.27% of all NP recreation visits in 1980
> Recreation visits in 2020: 2,897,098 — 4.26% of all NP recreation visits in 2020
> Recreation visits in 2019: 5,974,411 — 6.56% of all NP recreation visits in 2019
> Change in visits, 1980-2019 159.2% — the 18th largest increase
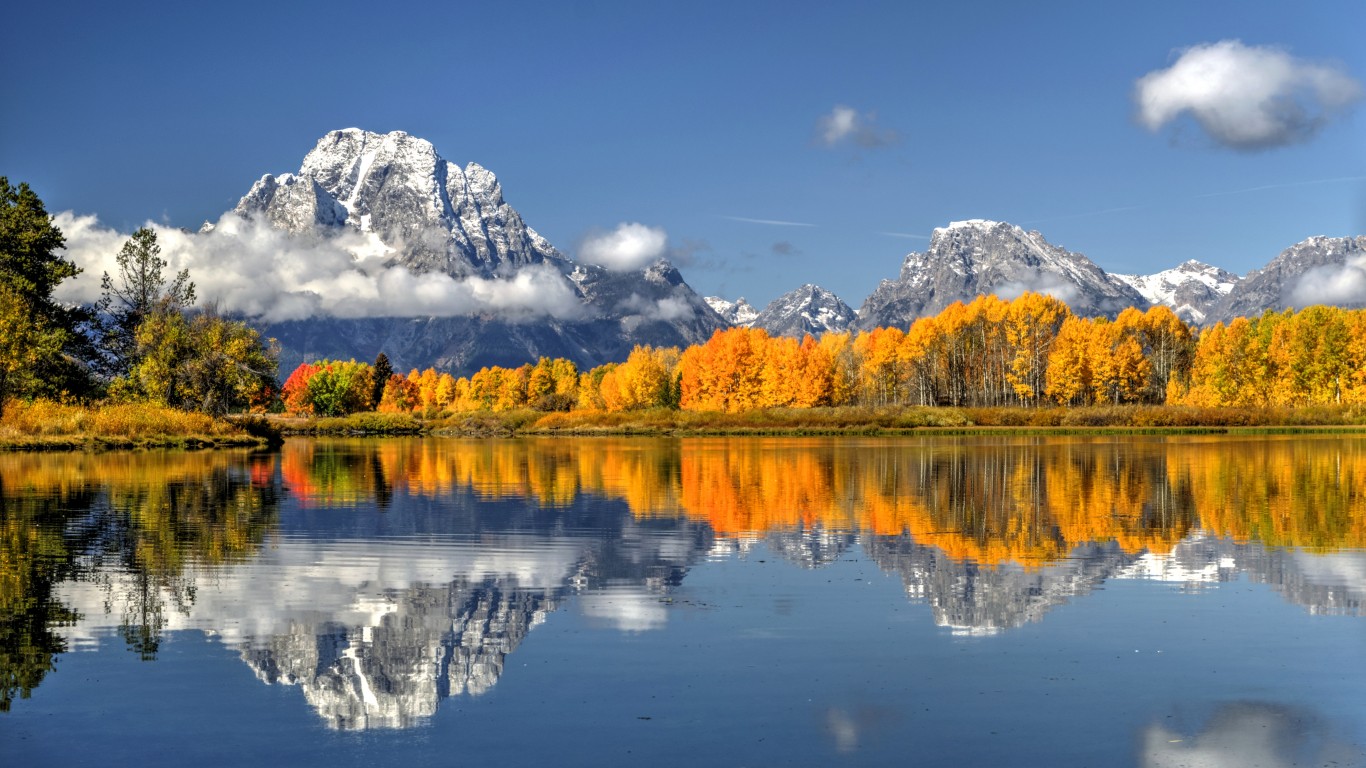
22. Grand Teton NP
> Change in visits, 1980-2020: 28.7%
> Recreation visits in 1980: 2,555,627 — 4.74% of all NP recreation visits in 1980
> Recreation visits in 2020: 3,289,638 — 4.84% of all NP recreation visits in 2020
> Recreation visits in 2019: 3,405,614 — 3.74% of all NP recreation visits in 2019
> Change in visits, 1980-2019 33.3% — the 15th smallest increase
[in-text-ad-2]

21. Death Valley NP
> Change in visits, 1980-2020: 32.7%
> Recreation visits in 1980: 618,140 — 1.15% of all NP recreation visits in 1980
> Recreation visits in 2020: 820,023 — 1.21% of all NP recreation visits in 2020
> Recreation visits in 2019: 1,740,945 — 1.91% of all NP recreation visits in 2019
> Change in visits, 1980-2019 181.6% — the 15th largest increase
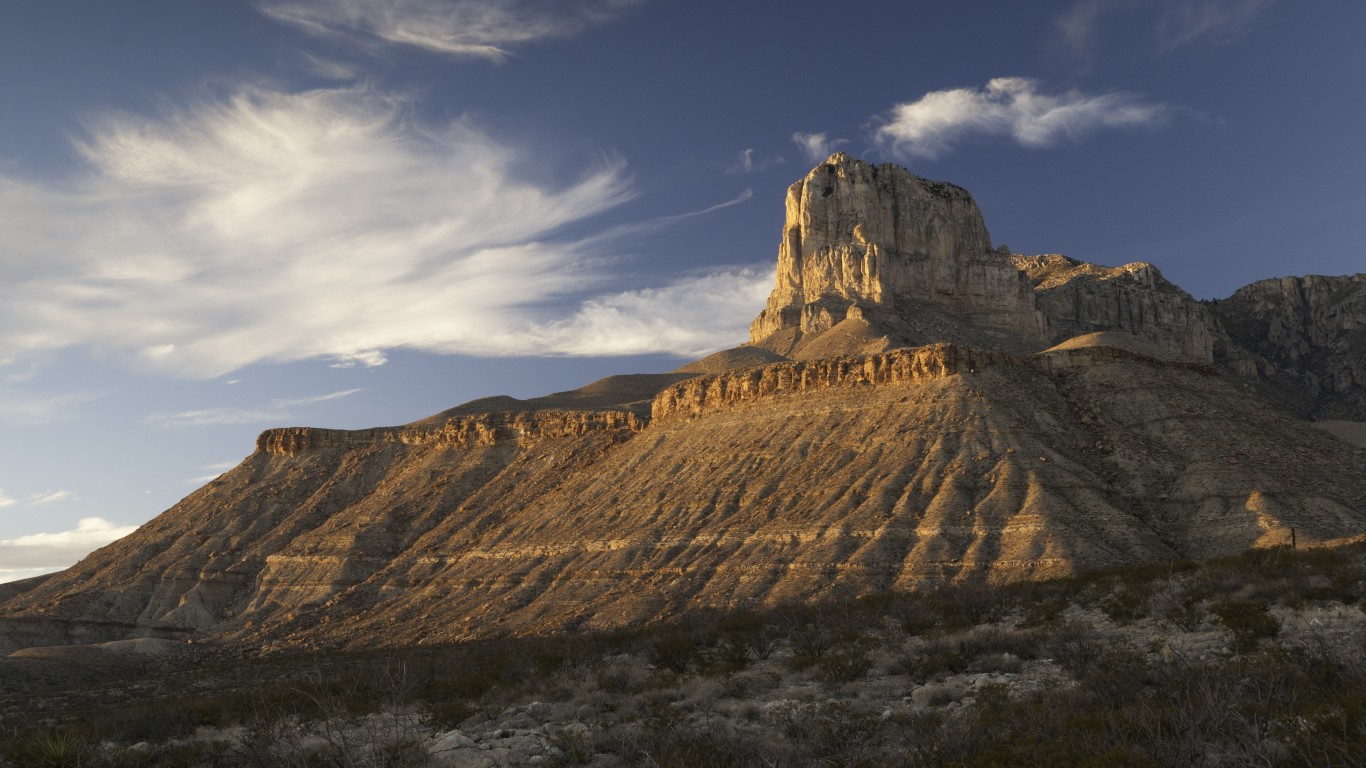
20. Guadalupe Mountains NP
> Change in visits, 1980-2020: 32.9%
> Recreation visits in 1980: 113,825 — 0.21% of all NP recreation visits in 1980
> Recreation visits in 2020: 151,256 — 0.22% of all NP recreation visits in 2020
> Recreation visits in 2019: 188,833 — 0.21% of all NP recreation visits in 2019
> Change in visits, 1980-2019 65.9% — the 21st smallest increase
[in-text-ad]
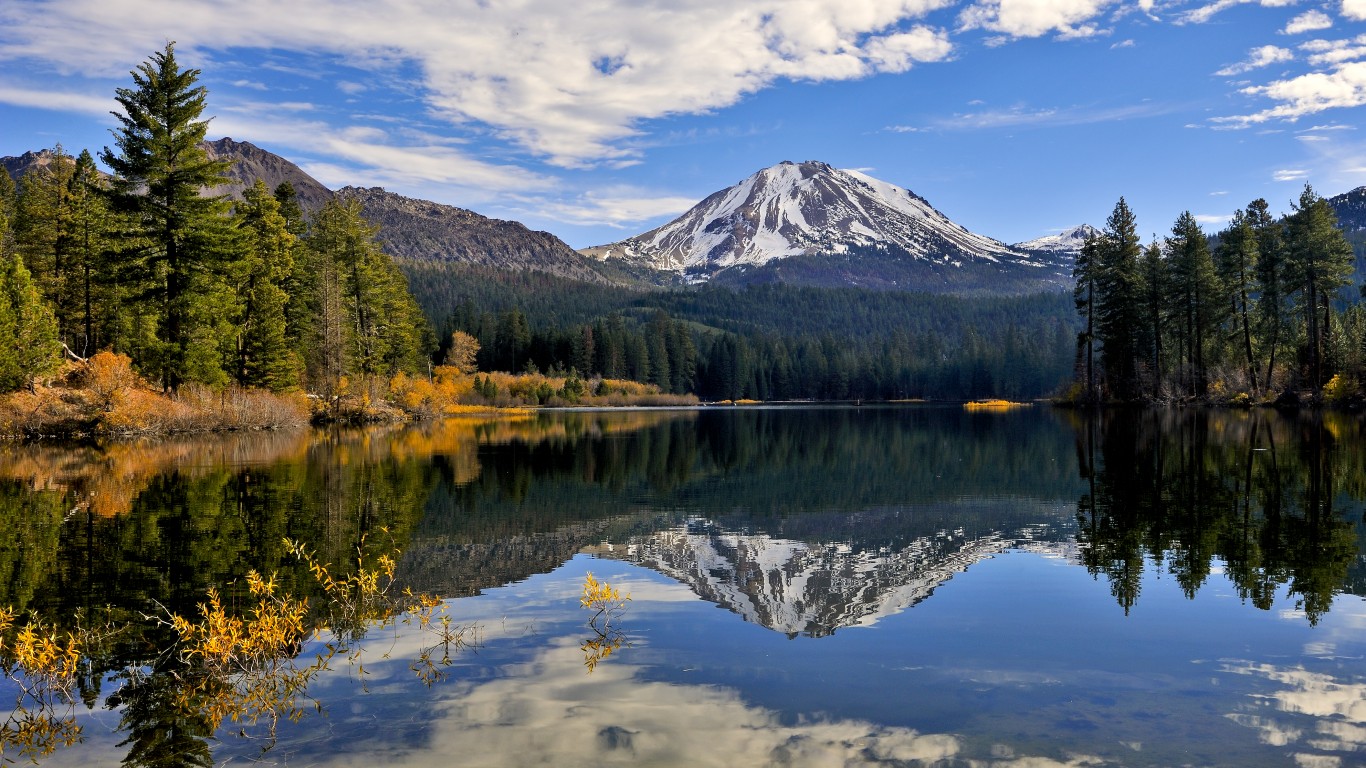
19. Lassen Volcanic NP
> Change in visits, 1980-2020: 37.5%
> Recreation visits in 1980: 394,425 — 0.73% of all NP recreation visits in 1980
> Recreation visits in 2020: 542,274 — 0.80% of all NP recreation visits in 2020
> Recreation visits in 2019: 517,039 — 0.57% of all NP recreation visits in 2019
> Change in visits, 1980-2019 31.1% — the 13th smallest increase
[recirclink id=823294]
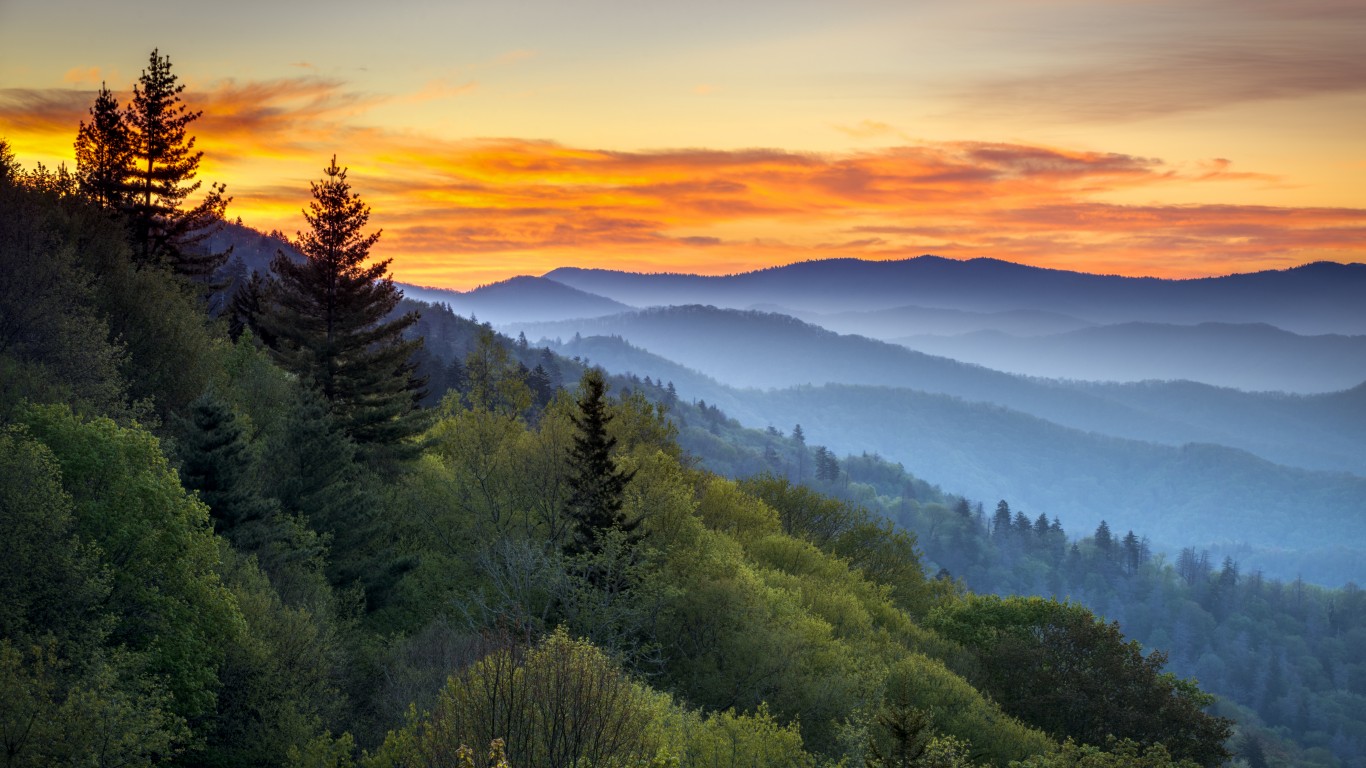
18. Great Smoky Mountains NP
> Change in visits, 1980-2020: 43.3%
> Recreation visits in 1980: 8,440,953 — 15.65% of all NP recreation visits in 1980
> Recreation visits in 2020: 12,095,720 — 17.81% of all NP recreation visits in 2020
> Recreation visits in 2019: 12,547,743 — 13.79% of all NP recreation visits in 2019
> Change in visits, 1980-2019 48.7% — the 17th smallest increase
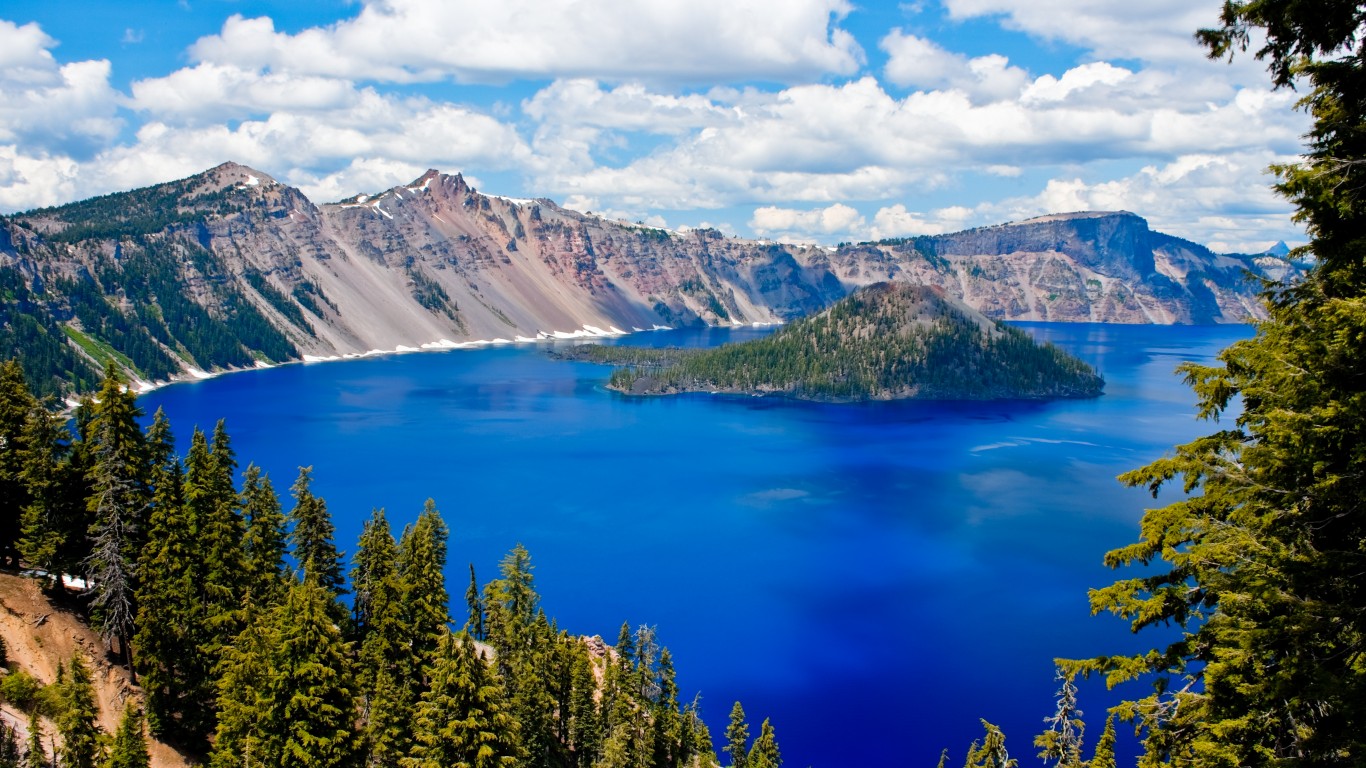
17. Crater Lake NP
> Change in visits, 1980-2020: 47.3%
> Recreation visits in 1980: 455,143 — 0.84% of all NP recreation visits in 1980
> Recreation visits in 2020: 670,500 — 0.99% of all NP recreation visits in 2020
> Recreation visits in 2019: 704,512 — 0.77% of all NP recreation visits in 2019
> Change in visits, 1980-2019 54.8% — the 19th smallest increase
[in-text-ad-2]
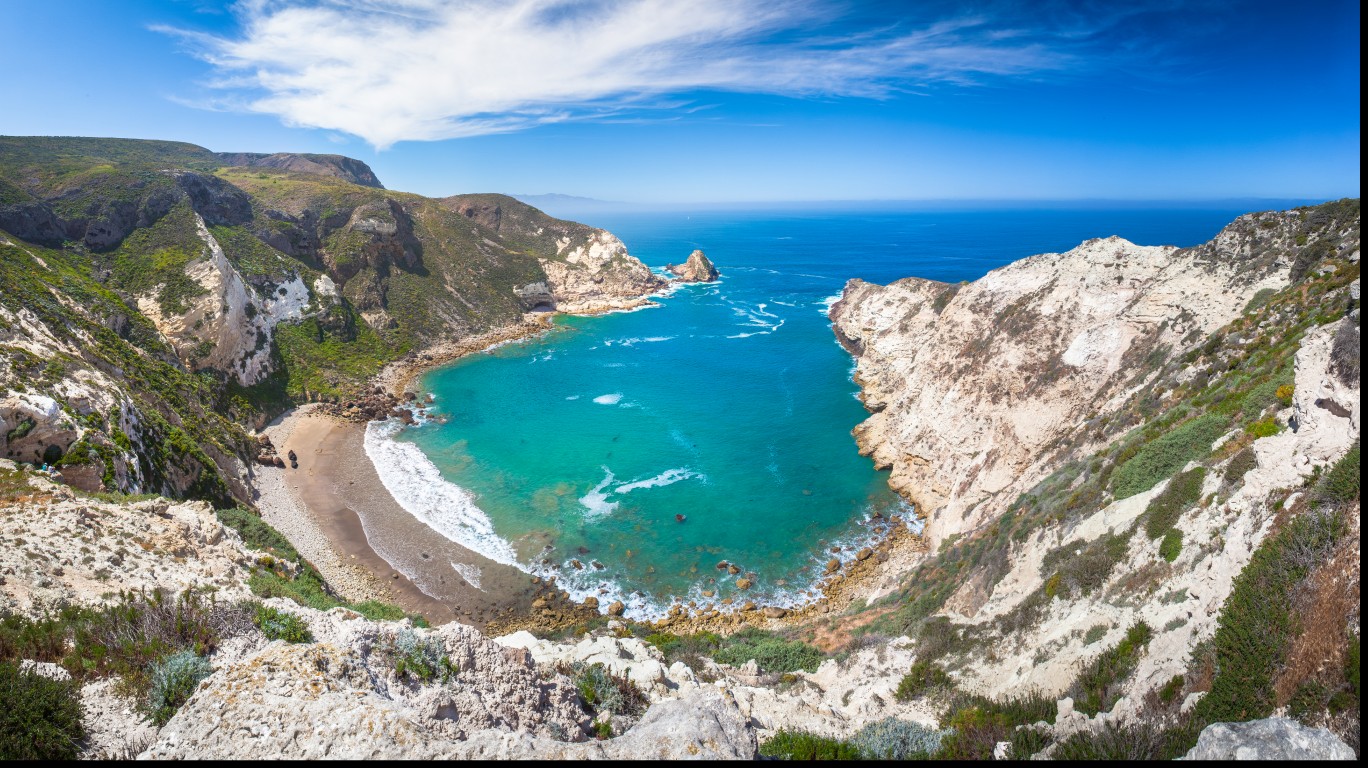
16. Channel Islands NP
> Change in visits, 1980-2020: 60.0%
> Recreation visits in 1980: 104,574 — 0.19% of all NP recreation visits in 1980
> Recreation visits in 2020: 167,290 — 0.25% of all NP recreation visits in 2020
> Recreation visits in 2019: 409,630 — 0.45% of all NP recreation visits in 2019
> Change in visits, 1980-2019 291.7% — the 11th largest increase
15. Biscayne NP
> Change in visits, 1980-2020: 62.4%
> Recreation visits in 1980: 248,071 — 0.46% of all NP recreation visits in 1980
> Recreation visits in 2020: 402,770 — 0.59% of all NP recreation visits in 2020
> Recreation visits in 2019: 708,522 — 0.78% of all NP recreation visits in 2019
> Change in visits, 1980-2019 185.6% — the 14th largest increase
[in-text-ad]
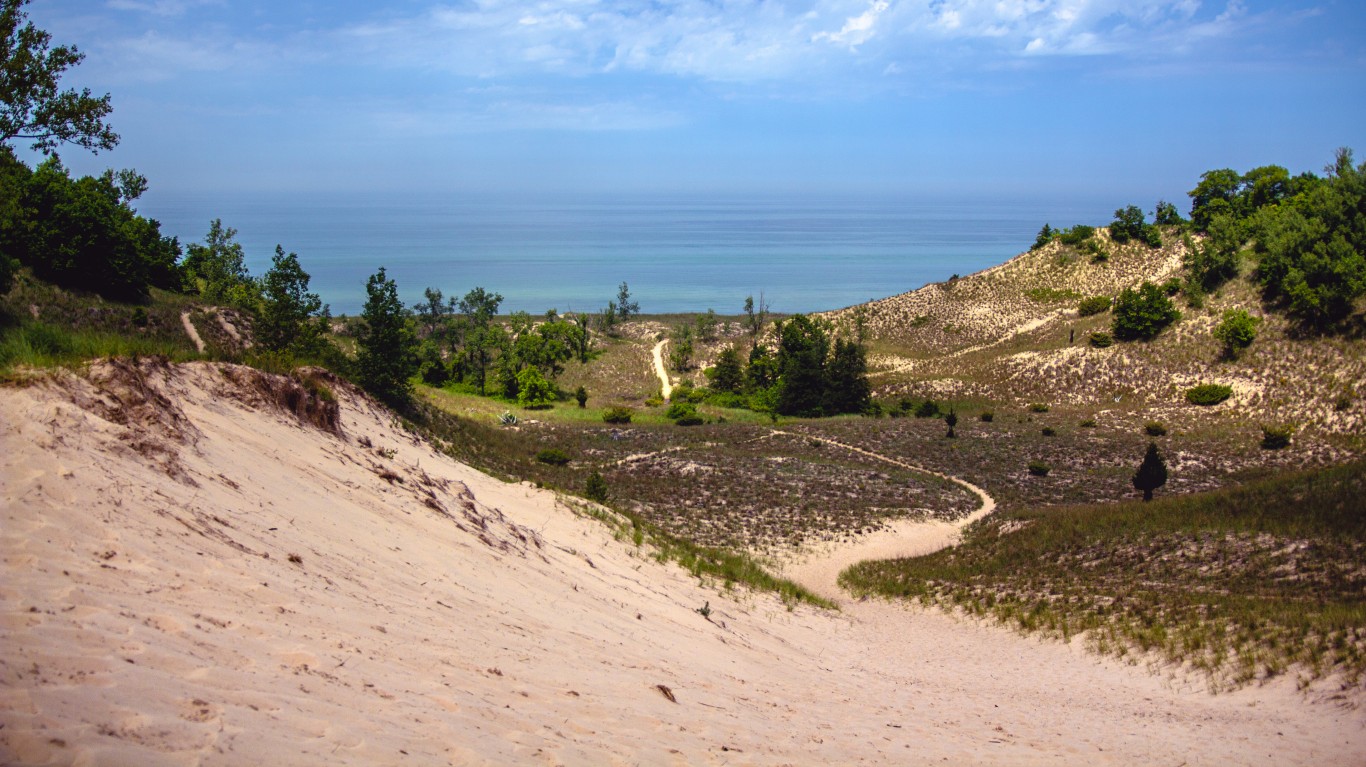
14. Indiana Dunes NP
> Change in visits, 1980-2020: 87.5%
> Recreation visits in 1980: 1,222,874 — 2.27% of all NP recreation visits in 1980
> Recreation visits in 2020: 2,293,106 — 3.38% of all NP recreation visits in 2020
> Recreation visits in 2019: 2,134,285 — 2.35% of all NP recreation visits in 2019
> Change in visits, 1980-2019 74.5% — the 23rd smallest increase
[recirclink id=542888]

13. Yellowstone NP
> Change in visits, 1980-2020: 90.3%
> Recreation visits in 1980: 2,000,269 — 3.71% of all NP recreation visits in 1980
> Recreation visits in 2020: 3,806,306 — 5.60% of all NP recreation visits in 2020
> Recreation visits in 2019: 4,020,288 — 4.42% of all NP recreation visits in 2019
> Change in visits, 1980-2019 101.0% — the 20th largest increase
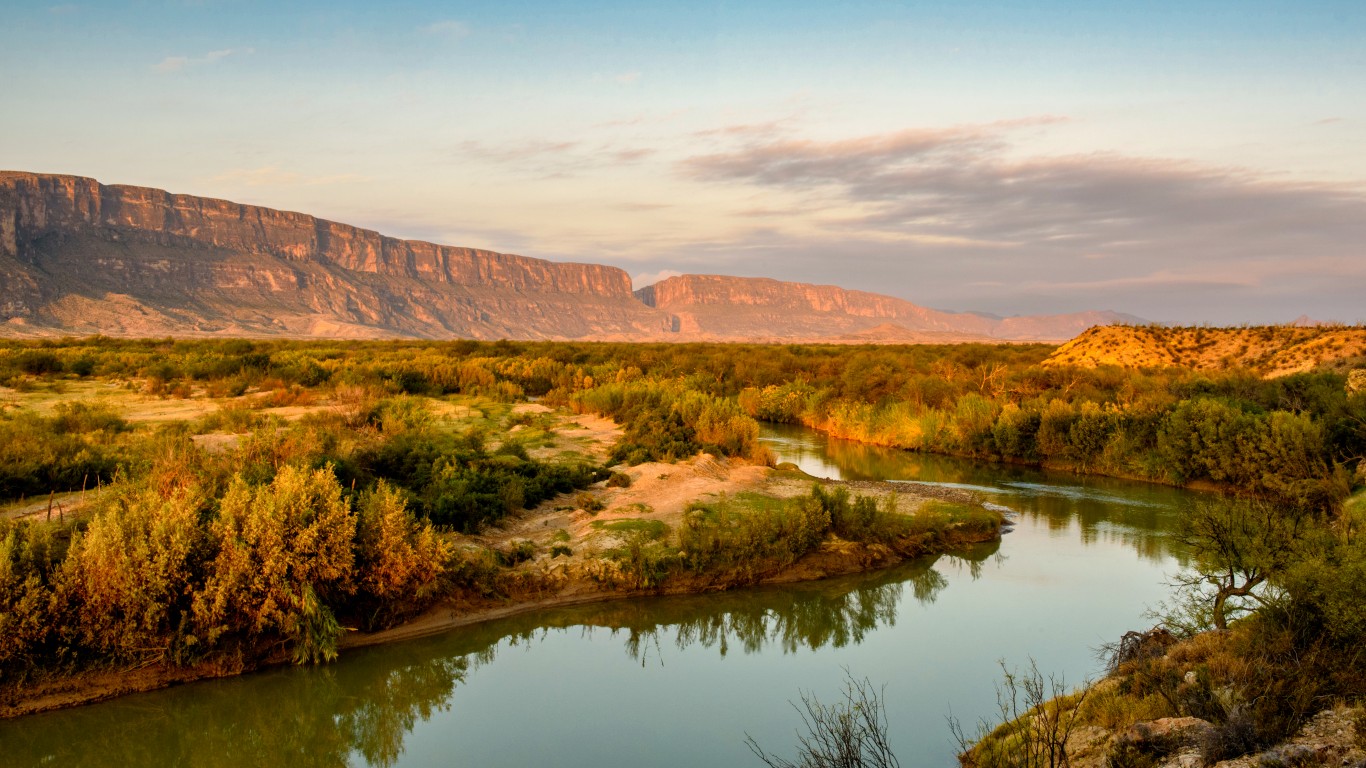
12. Big Bend NP
> Change in visits, 1980-2020: 126.4%
> Recreation visits in 1980: 174,008 — 0.32% of all NP recreation visits in 1980
> Recreation visits in 2020: 393,907 — 0.58% of all NP recreation visits in 2020
> Recreation visits in 2019: 463,832 — 0.51% of all NP recreation visits in 2019
> Change in visits, 1980-2019 166.6% — the 17th largest increase
[in-text-ad-2]
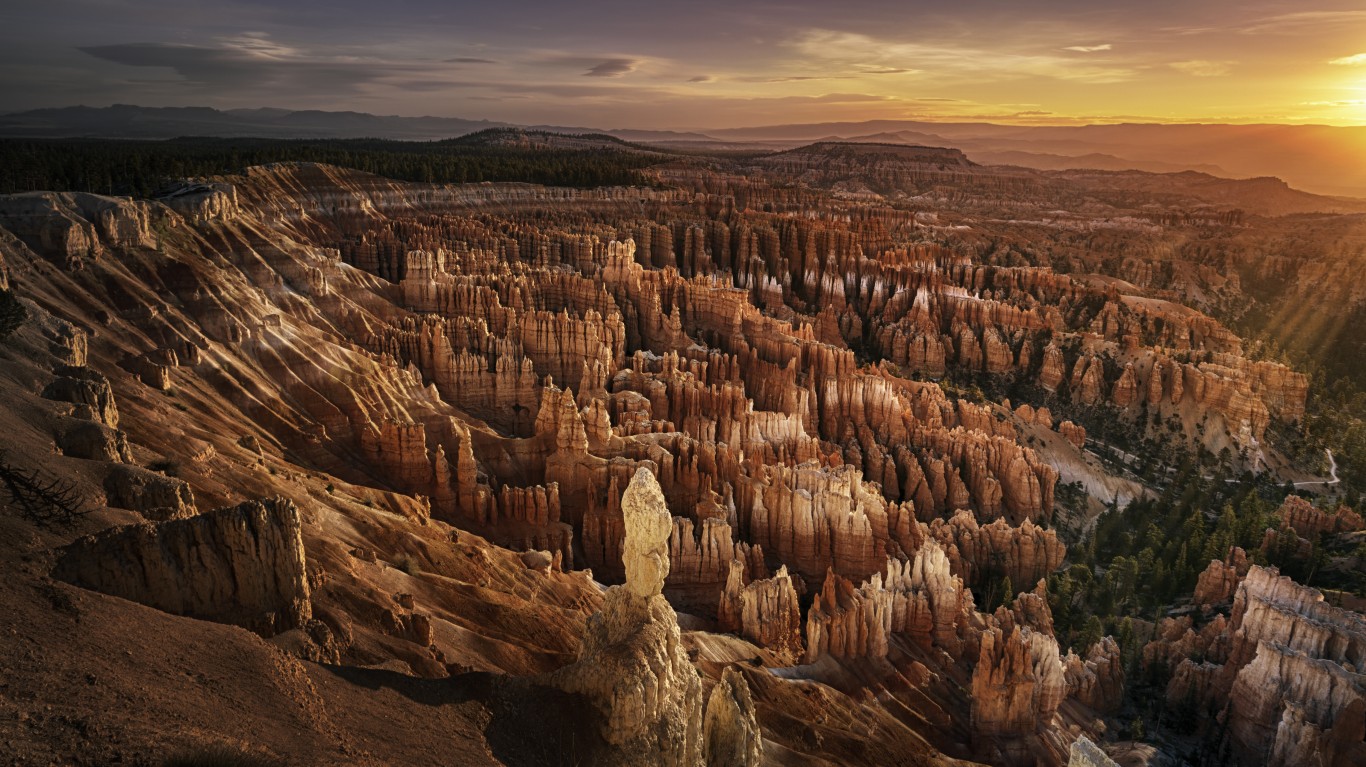
11. Bryce Canyon NP
> Change in visits, 1980-2020: 156.3%
> Recreation visits in 1980: 571,541 — 1.06% of all NP recreation visits in 1980
> Recreation visits in 2020: 1,464,655 — 2.16% of all NP recreation visits in 2020
> Recreation visits in 2019: 2,594,904 — 2.85% of all NP recreation visits in 2019
> Change in visits, 1980-2019 354.0% — the 7th largest increase
10. Capitol Reef NP
> Change in visits, 1980-2020: 186.2%
> Recreation visits in 1980: 342,788 — 0.64% of all NP recreation visits in 1980
> Recreation visits in 2020: 981,038 — 1.44% of all NP recreation visits in 2020
> Recreation visits in 2019: 1,226,519 — 1.35% of all NP recreation visits in 2019
> Change in visits, 1980-2019 257.8% — the 13th largest increase
[in-text-ad]
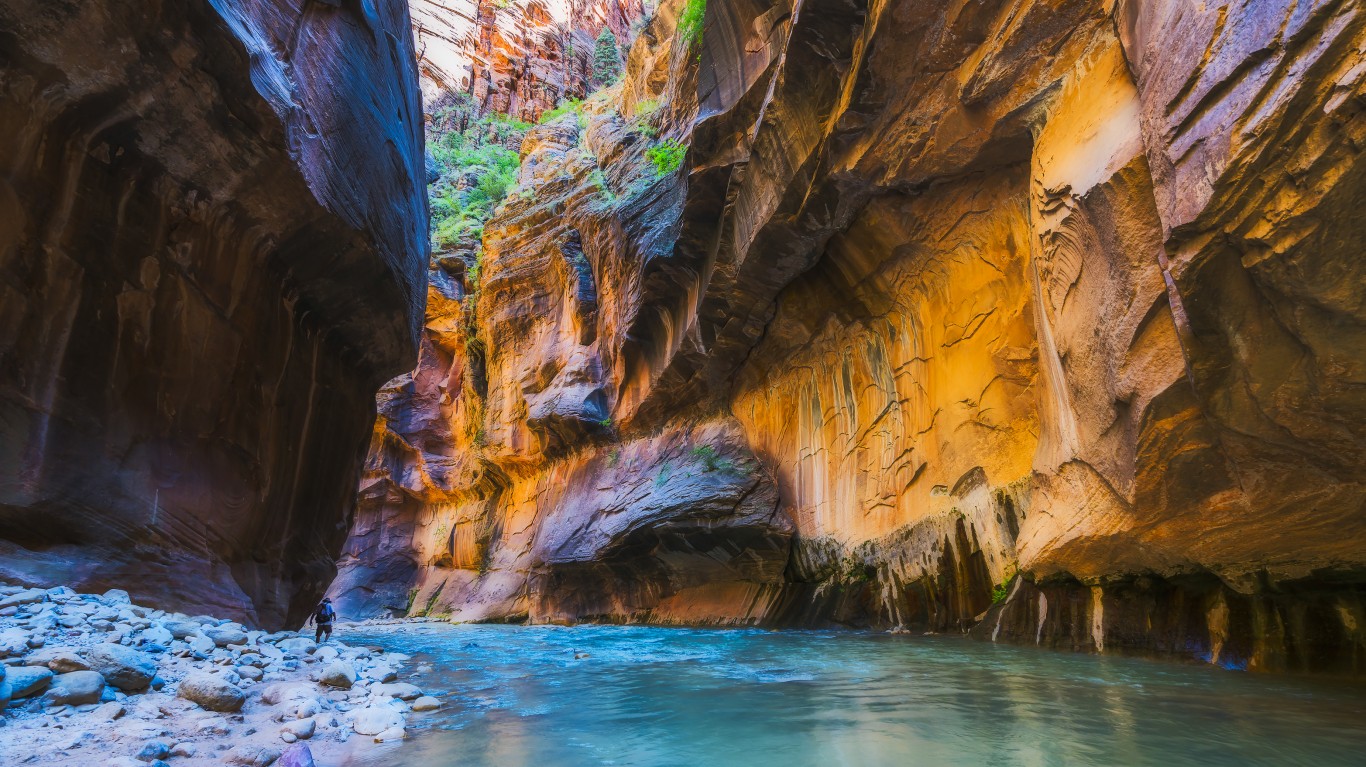
9. Zion NP
> Change in visits, 1980-2020: 219.6%
> Recreation visits in 1980: 1,123,846 — 2.08% of all NP recreation visits in 1980
> Recreation visits in 2020: 3,591,254 — 5.29% of all NP recreation visits in 2020
> Recreation visits in 2019: 4,488,268 — 4.93% of all NP recreation visits in 2019
> Change in visits, 1980-2019 299.4% — the 8th largest increase
[recirclink id=412413]

8. Great Sand Dunes NP & PRES
> Change in visits, 1980-2020: 224.0%
> Recreation visits in 1980: 142,427 — 0.26% of all NP recreation visits in 1980
> Recreation visits in 2020: 461,532 — 0.68% of all NP recreation visits in 2020
> Recreation visits in 2019: 527,546 — 0.58% of all NP recreation visits in 2019
> Change in visits, 1980-2019 270.4% — the 12th largest increase
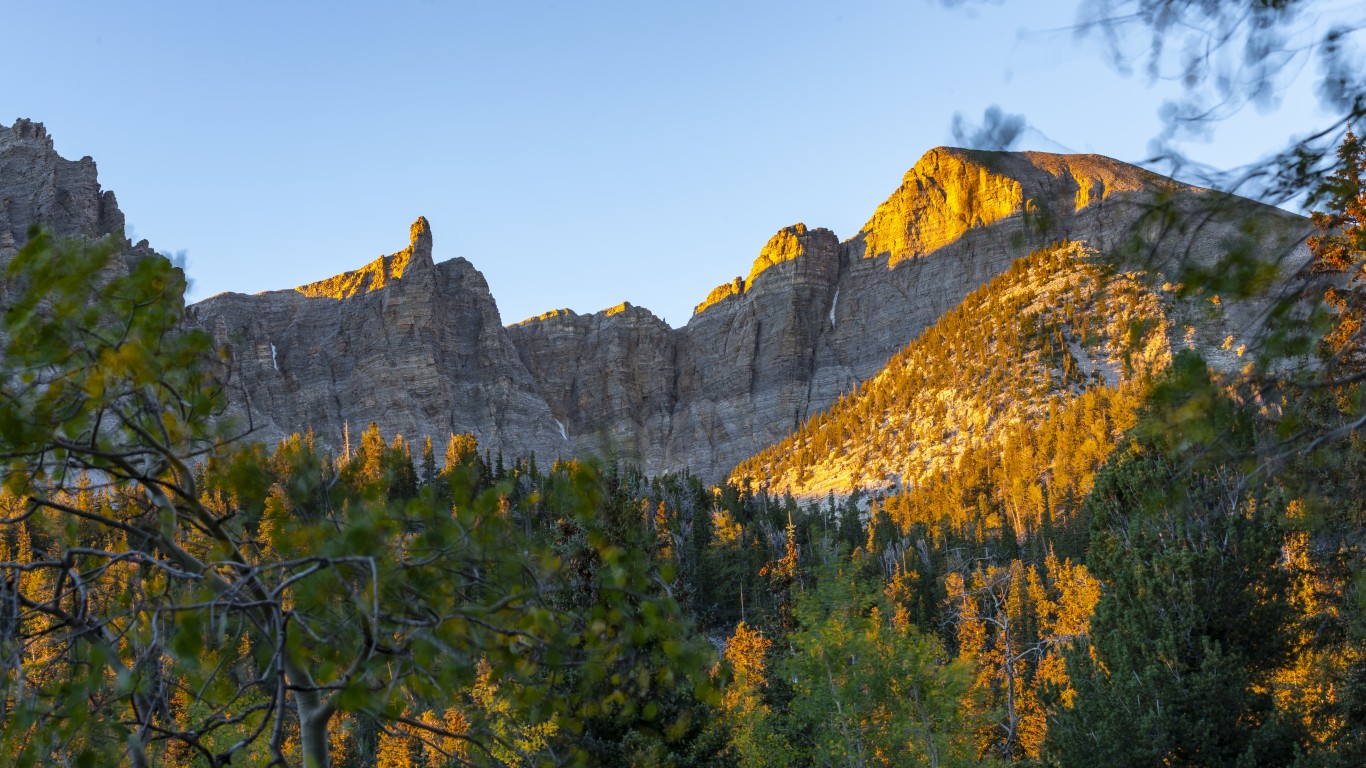
7. Great Basin NP
> Change in visits, 1980-2020: 260.2%
> Recreation visits in 1980: 33,383 — 0.06% of all NP recreation visits in 1980
> Recreation visits in 2020: 120,248 — 0.18% of all NP recreation visits in 2020
> Recreation visits in 2019: 131,802 — 0.14% of all NP recreation visits in 2019
> Change in visits, 1980-2019 294.8% — the 10th largest increase
[in-text-ad-2]
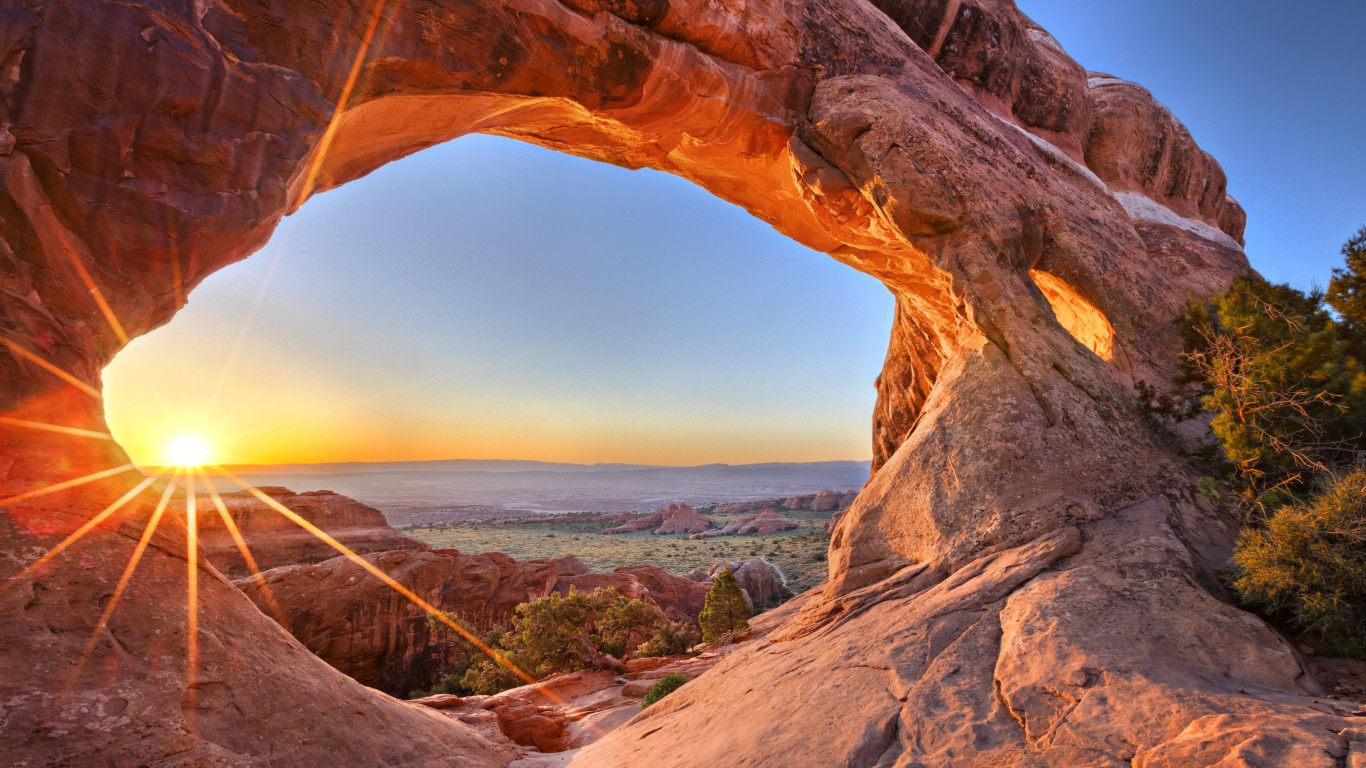
6. Arches NP
> Change in visits, 1980-2020: 326.2%
> Recreation visits in 1980: 290,519 — 0.54% of all NP recreation visits in 1980
> Recreation visits in 2020: 1,238,083 — 1.82% of all NP recreation visits in 2020
> Recreation visits in 2019: 1,659,702 — 1.82% of all NP recreation visits in 2019
> Change in visits, 1980-2019 471.3% — the 5th largest increase
5. Katmai NP & PRES
> Change in visits, 1980-2020: 335.6%
> Recreation visits in 1980: 11,824 — 0.02% of all NP recreation visits in 1980
> Recreation visits in 2020: 51,511 — 0.08% of all NP recreation visits in 2020
> Recreation visits in 2019: 84,167 — 0.09% of all NP recreation visits in 2019
> Change in visits, 1980-2019 611.8% — the 3rd largest increase
[in-text-ad]

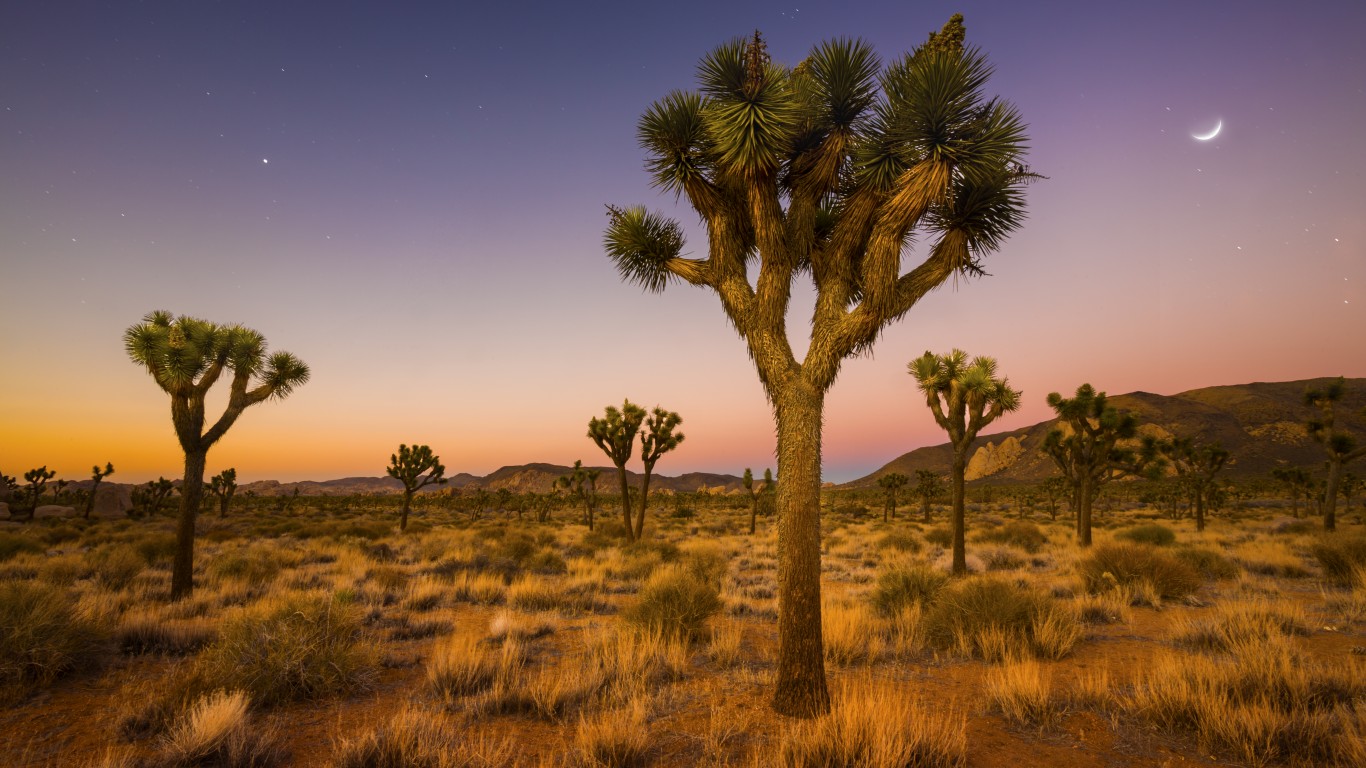
4. Joshua Tree NP
> Change in visits, 1980-2020: 340.0%
> Recreation visits in 1980: 545,357 — 1.01% of all NP recreation visits in 1980
> Recreation visits in 2020: 2,399,542 — 3.53% of all NP recreation visits in 2020
> Recreation visits in 2019: 2,988,547 — 3.28% of all NP recreation visits in 2019
> Change in visits, 1980-2019 448.0% — the 6th largest increase
[recirclink id=561922]

3. Cuyahoga Valley NP
> Change in visits, 1980-2020: 389.2%
> Recreation visits in 1980: 563,300 — 1.04% of all NP recreation visits in 1980
> Recreation visits in 2020: 2,755,628 — 4.06% of all NP recreation visits in 2020
> Recreation visits in 2019: 2,237,997 — 2.46% of all NP recreation visits in 2019
> Change in visits, 1980-2019 297.3% — the 9th largest increase
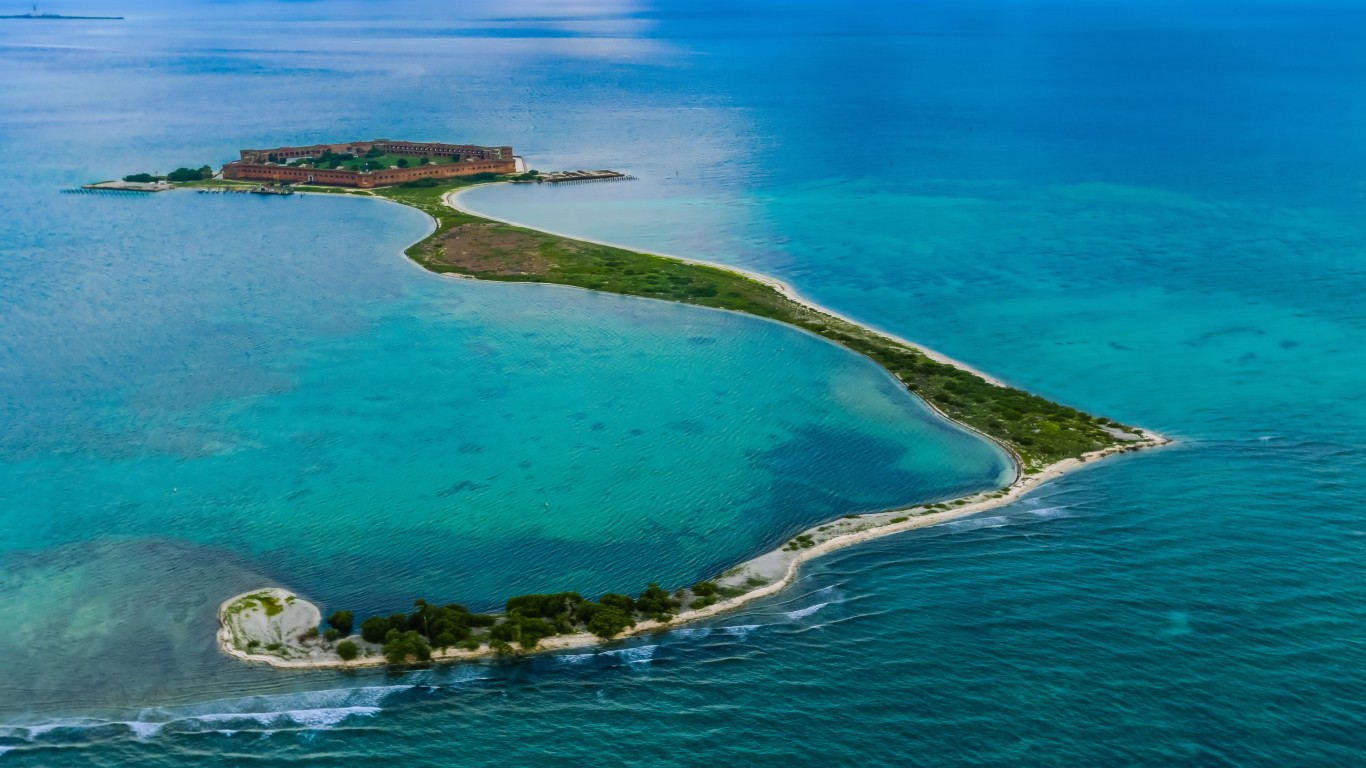
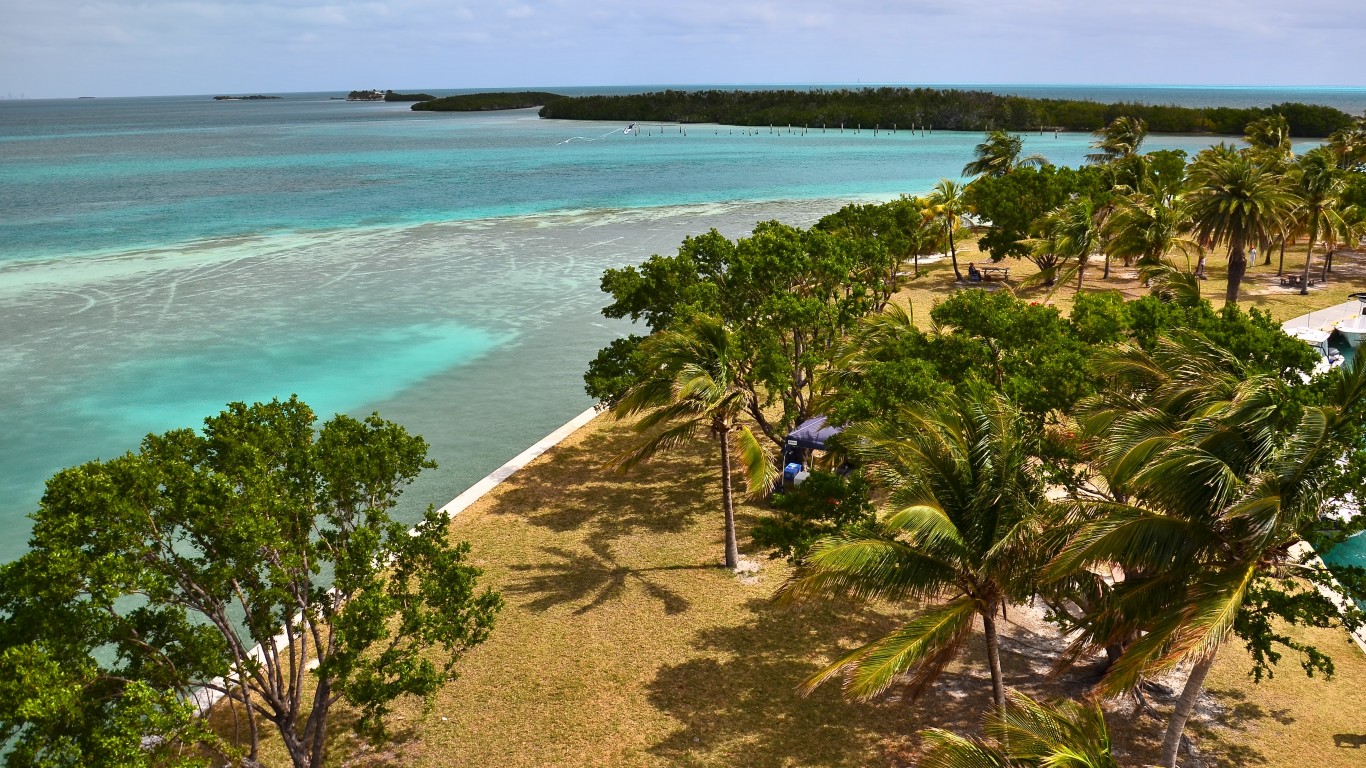
2. Dry Tortugas NP
> Change in visits, 1980-2020: 461.6%
> Recreation visits in 1980: 8,644 — 0.02% of all NP recreation visits in 1980
> Recreation visits in 2020: 48,543 — 0.07% of all NP recreation visits in 2020
> Recreation visits in 2019: 79,200 — 0.09% of all NP recreation visits in 2019
> Change in visits, 1980-2019 816.2% — the 2nd largest increase
[in-text-ad-2]
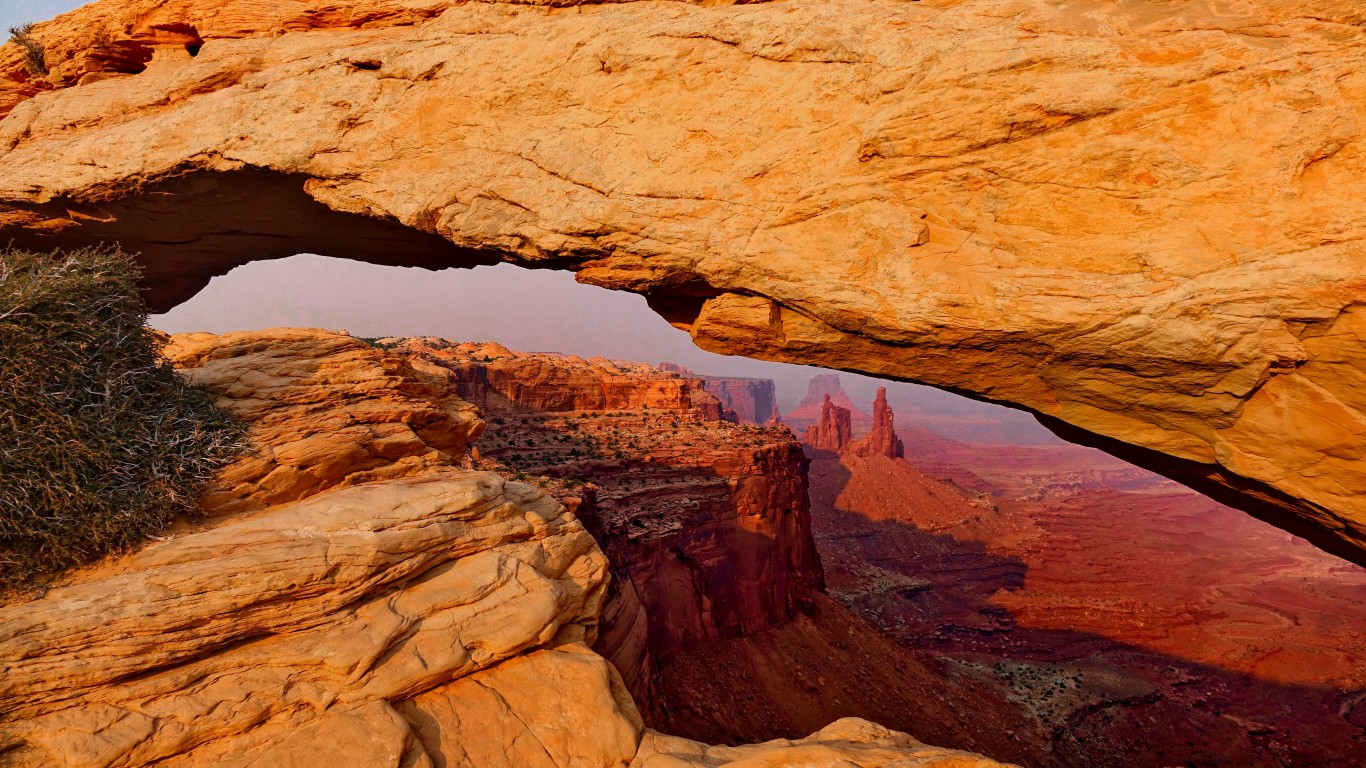
1. Canyonlands NP
> Change in visits, 1980-2020: 774.1%
> Recreation visits in 1980: 56,505 — 0.10% of all NP recreation visits in 1980
> Recreation visits in 2020: 493,914 — 0.73% of all NP recreation visits in 2020
> Recreation visits in 2019: 733,996 — 0.81% of all NP recreation visits in 2019
> Change in visits, 1980-2019 1,199.0% — the largest increase