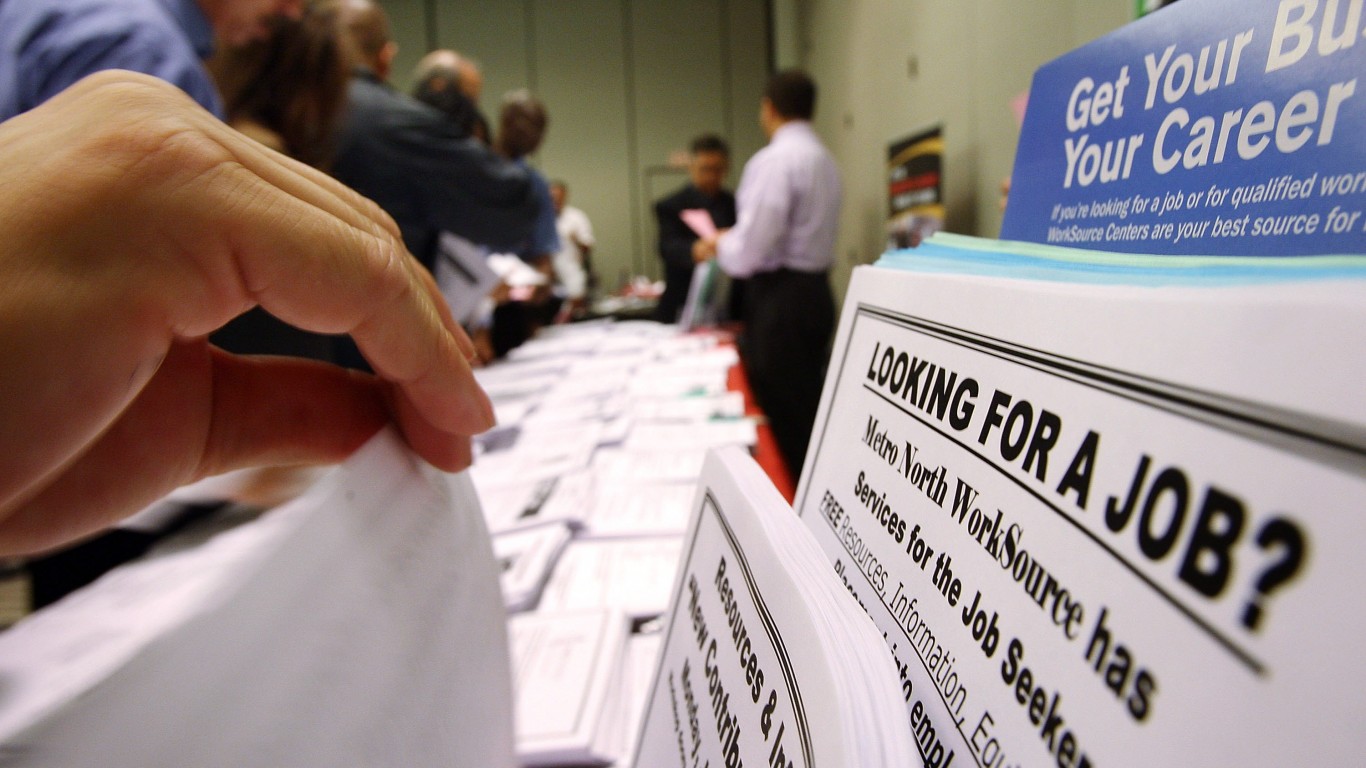
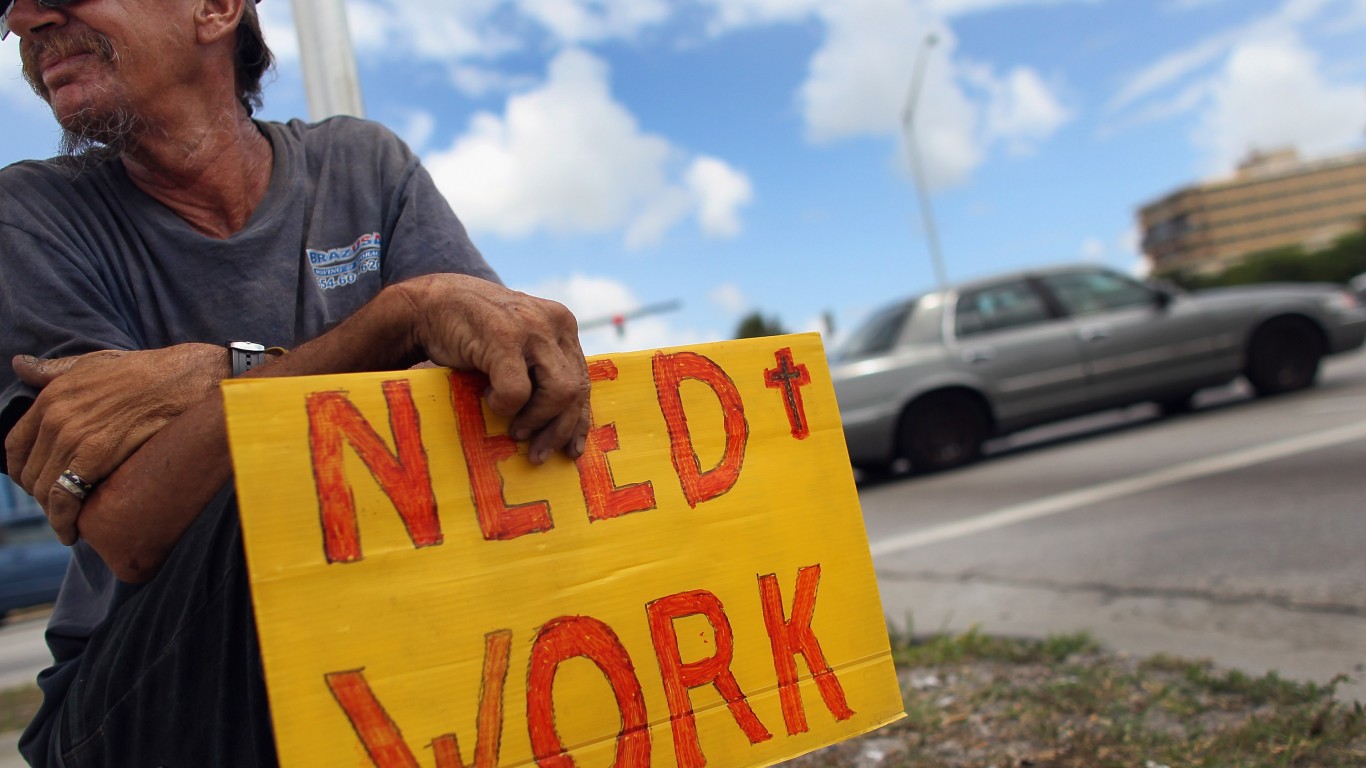
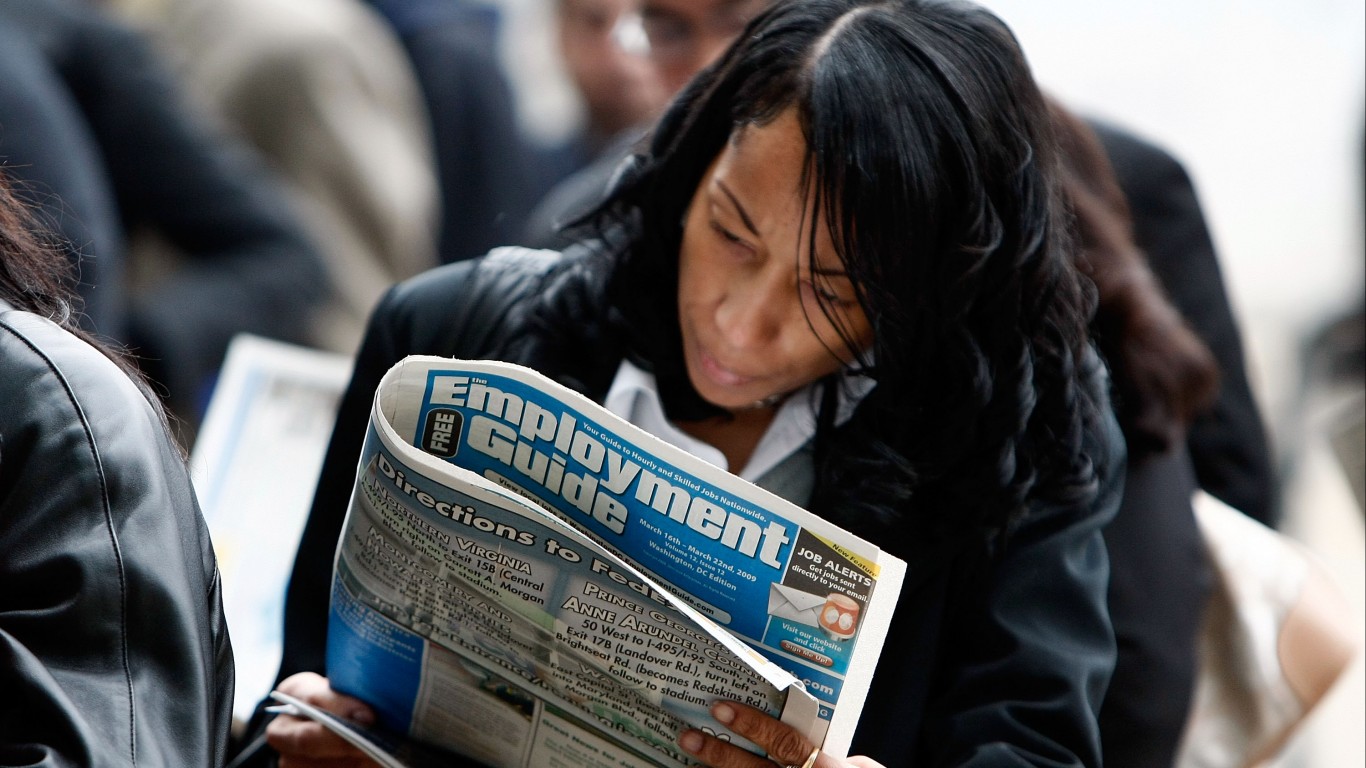
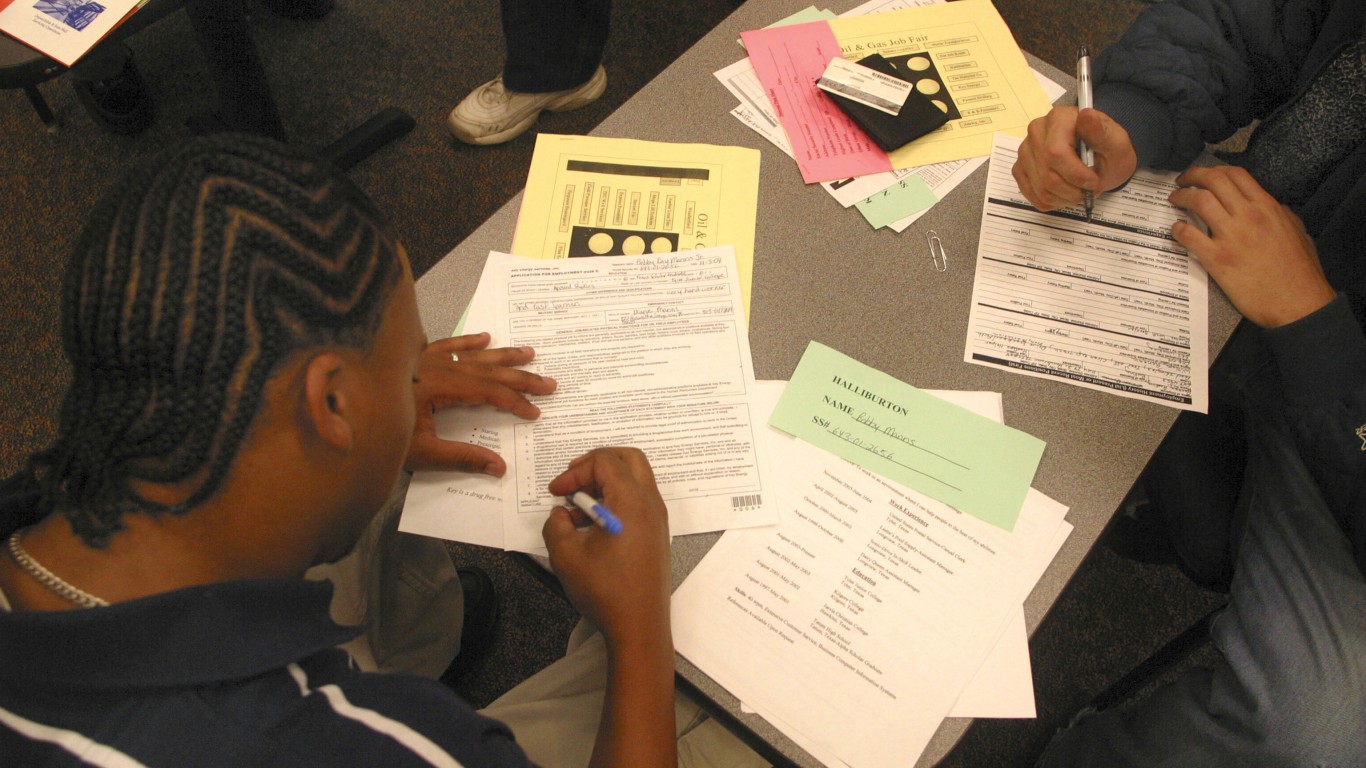
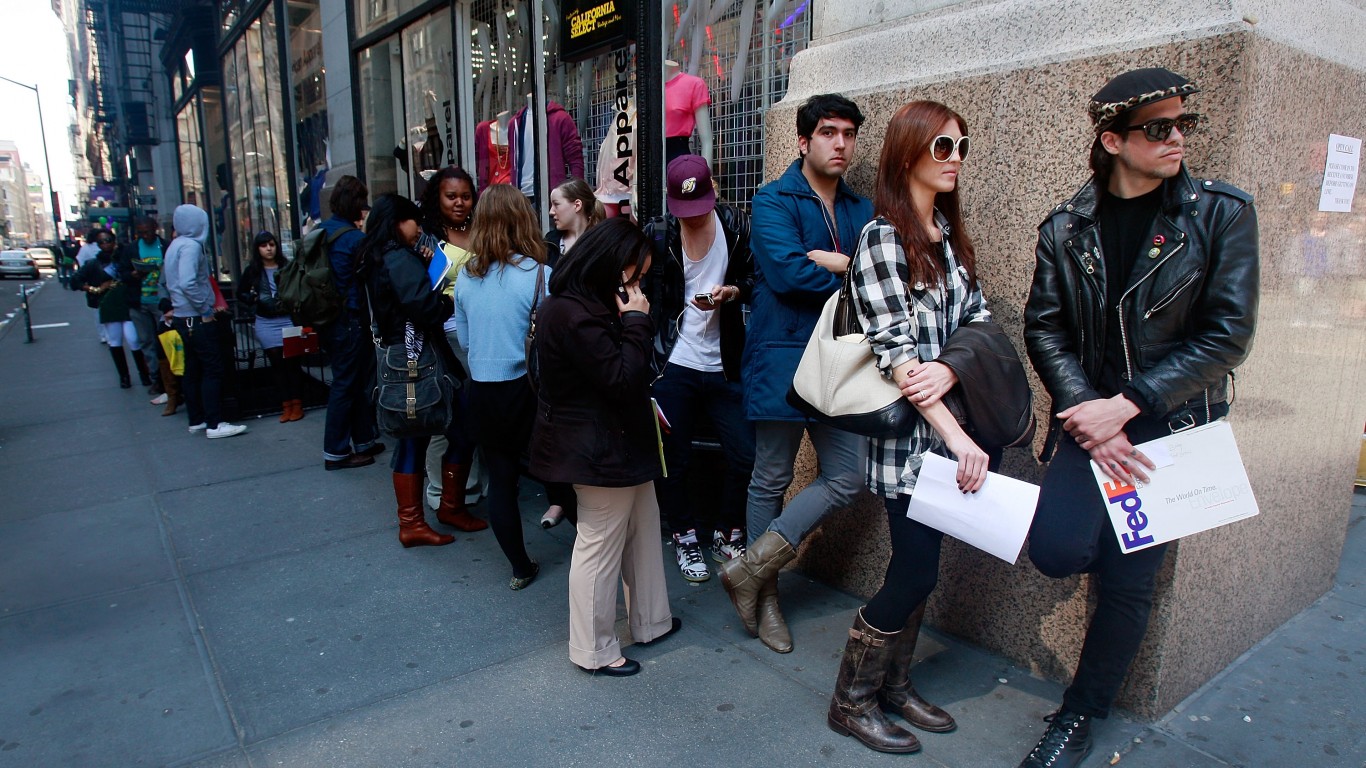
The COVID-19 pandemic ushered in an unemployment crisis of historic magnitude. The national jobless rate more than tripled in a single month from 4.4% in March 2020 to 14.8% in April — a high not seen since the Great Depression. Though the majority of those jobs have since returned, the recovery has exposed and in many cases worsened existing levels of racial inequality.
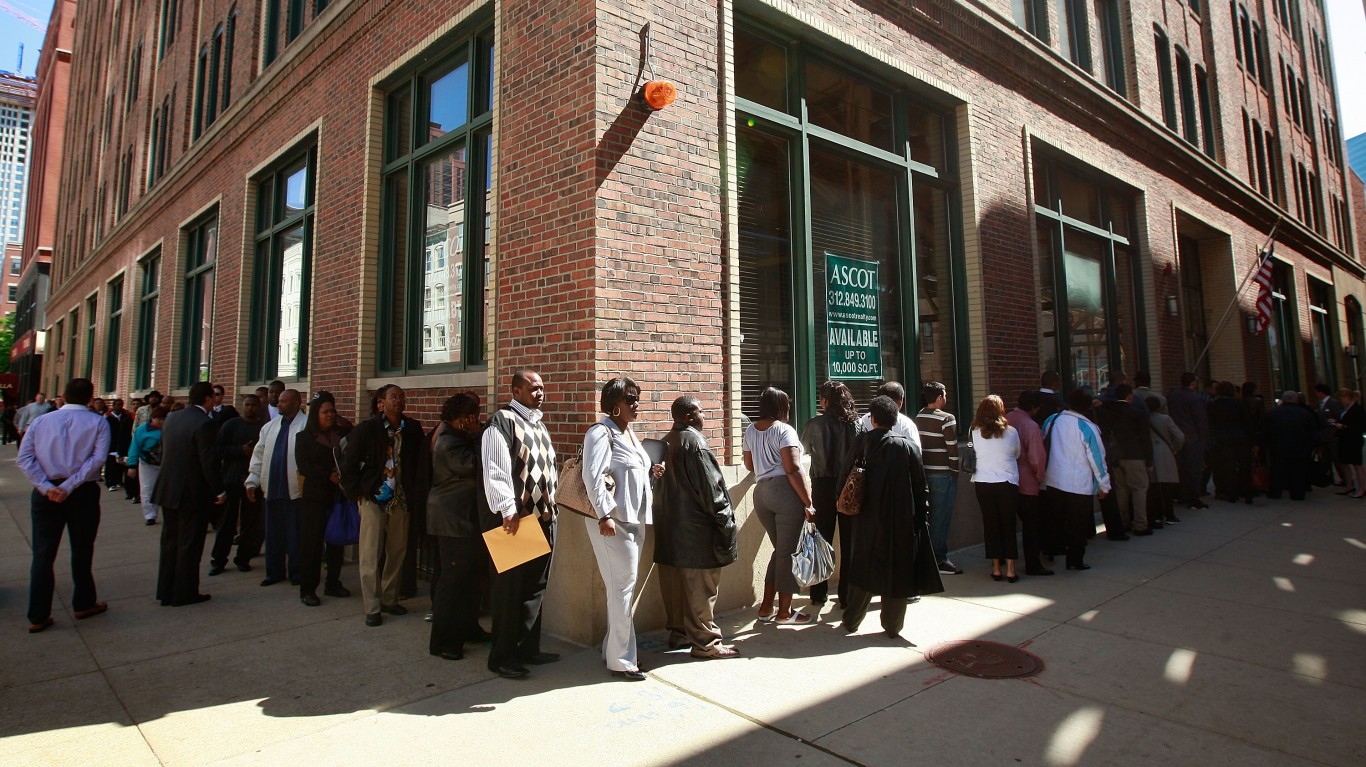
According to a recent report from the Economic Policy Institute, the jobless rate among Black Americans in the second quarter of 2021 far exceeds the white unemployment rate in every state with available data. Nationwide, Black members of the workforce are twice as likely to be out of work as white workers.
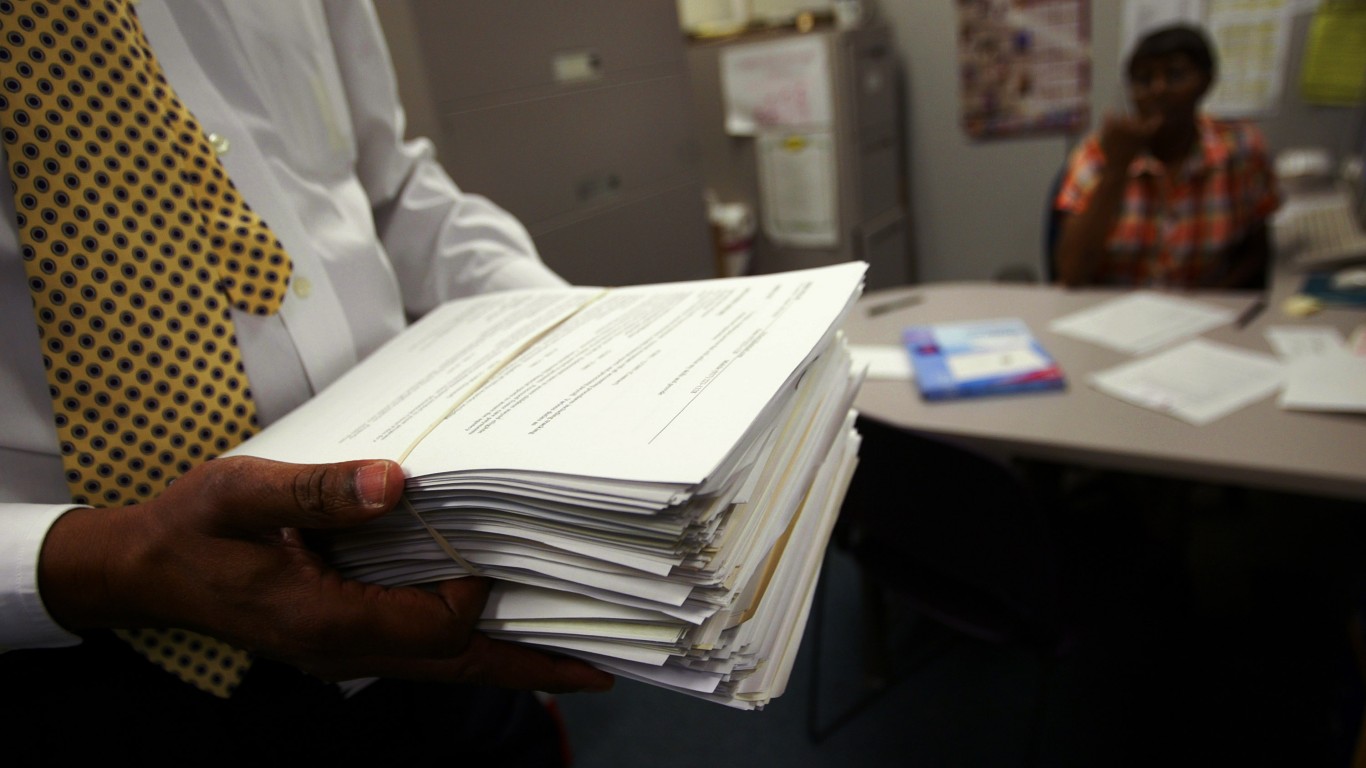
Using Q2 2021 unemployment data from the EPI, 24/7 Wall St. reviewed the black unemployment rate in every state. Only 16 states, including Washington D.C., had a large enough sample size for accurate estimates. We also considered for our list the median household income for Black and white households from the U.S. Census Bureau’s 2019 American Community Survey.
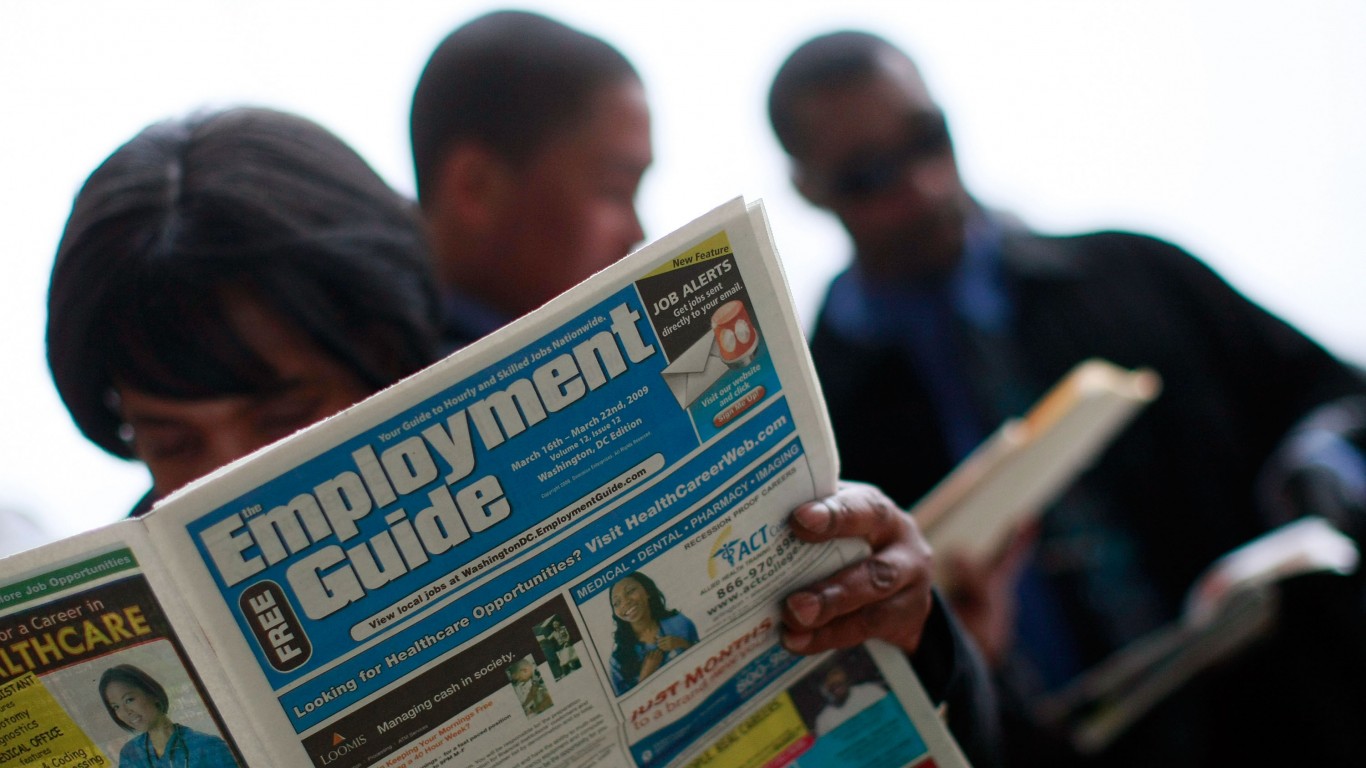
The uneven employment gains as the U.S. economy recovers from the pandemic shock are in many ways part of deeply entrenched historical patterns. Unemployment is just one of many measures that can expose the long-standing racial inequalities in the United States. Here is a look at the worst cities for Black Americans.
Currently, the Black unemployment rate ranges from 4.5% to 13.8%, depending on the state. States are ranked from 16 to one, from the lowest Hispanic unemployment rate to the highest.
Click here to see states with the highest black unemployment.

16. Alabama
> Black unemployment, Q2 2021: 4.5% (5.4% Q1 2021)
> White unemployment, Q2 2021: 3.2% (3.8% Q1 2021)
> Median household income, Black households: $35,774
> Median household income, white households: $59,727
[in-text-ad]

15. Florida
> Black unemployment, Q2 2021: 7.4% (7.0% Q1 2021)
> White unemployment, Q2 2021: 3.5% (3.5% Q1 2021)
> Median household income, Black households: $44,039
> Median household income, white households: $62,132

14. Georgia
> Black unemployment, Q2 2021: 6.0% (7.2% Q1 2021)
> White unemployment, Q2 2021: 3.3% (3.8% Q1 2021)
> Median household income, Black households: $47,096
> Median household income, white households: $70,832
13. Tennessee
> Black unemployment, Q2 2021: 7.4% (7.9% Q1 2021)
> White unemployment, Q2 2021: 4.2% (4.3% Q1 2021)
> Median household income, Black households: $40,768
> Median household income, white households: $60,249
[in-text-ad-2]

12. South Carolina
> Black unemployment, Q2 2021: 7.1% (8.1% Q1 2021)
> White unemployment, Q2 2021: 4.1% (4.3% Q1 2021)
> Median household income, Black households: $37,327
> Median household income, white households: $65,506
11. Maryland
> Black unemployment, Q2 2021: 9.5% (8.1% Q1 2021)
> White unemployment, Q2 2021: 4.7% (5.0% Q1 2021)
> Median household income, Black households: $68,377
> Median household income, white households: $96,724
[in-text-ad]

10. North Carolina
> Black unemployment, Q2 2021: 7.7% (8.7% Q1 2021)
> White unemployment, Q2 2021: 3.5% (4.0% Q1 2021)
> Median household income, Black households: $41,177
> Median household income, white households: $63,887

9. Virginia
> Black unemployment, Q2 2021: 7.8% (9.0% Q1 2021)
> White unemployment, Q2 2021: 3.7% (3.8% Q1 2021)
> Median household income, Black households: $53,896
> Median household income, white households: $82,107

8. Mississippi
> Black unemployment, Q2 2021: 9.7% (10.4% Q1 2021)
> White unemployment, Q2 2021: 3.4% (3.7% Q1 2021)
> Median household income, Black households: $31,067
> Median household income, white households: $57,191
[in-text-ad-2]
7. California
> Black unemployment, Q2 2021: 11.9% (10.6% Q1 2021)
> White unemployment, Q2 2021: 6.3% (7.2% Q1 2021)
> Median household income, Black households: $55,140
> Median household income, white households: $82,706
6. Texas
> Black unemployment, Q2 2021: 10.8% (11.2% Q1 2021)
> White unemployment, Q2 2021: 4.6% (4.9% Q1 2021)
> Median household income, Black households: $47,428
> Median household income, white households: $67,904
[in-text-ad]
5. New York
> Black unemployment, Q2 2021: 10.6% (11.5% Q1 2021)
> White unemployment, Q2 2021: 5.7% (6.7% Q1 2021)
> Median household income, Black households: $51,146
> Median household income, white households: $80,589
 24/7 Wall St.
4. Louisiana
> Black unemployment, Q2 2021: 10.8% (12.0% Q1 2021)
> White unemployment, Q2 2021: 5.1% (5.3% Q1 2021)
> Median household income, Black households: $32,700
> Median household income, white households: $61,456
3. Ohio
> Black unemployment, Q2 2021: 11.0% (12.1% Q1 2021)
> White unemployment, Q2 2021: 4.2% (4.0% Q1 2021)
> Median household income, Black households: $34,955
> Median household income, white households: $62,550
[in-text-ad-2]
2. Illinois
> Black unemployment, Q2 2021: 12.4% (13.3% Q1 2021)
> White unemployment, Q2 2021: 5.7% (6.1% Q1 2021)
> Median household income, Black households: $39,815
> Median household income, white households: $74,728
1. Washington D.C.
> Black unemployment, Q2 2021: 13.8% (15.4% Q1 2021)
> White unemployment, Q2 2021: 3.0% (3.7% Q1 2021)
> Median household income, Black households: $48,652
> Median household income, white households: $149,734
It’s Your Money, Your Future—Own It (sponsor)
Are you ahead, or behind on retirement? For families with more than $500,000 saved for retirement, finding a financial advisor who puts your interest first can be the difference, and today it’s easier than ever. SmartAsset’s free tool matches you with up to three fiduciary financial advisors who serve your area in minutes. Each advisor has been carefully vetted and must act in your best interests. Start your search now.
If you’ve saved and built a substantial nest egg for you and your family, don’t delay; get started right here and help your retirement dreams become a retirement reality.
Thank you for reading! Have some feedback for us?
Contact the 24/7 Wall St. editorial team.
Latest from 24/7


Our expert who first called NVIDIA in 2009 is predicting 2025 will see a historic AI breakthrough.
You can follow him investing $500,000 of his own money on our top AI stocks for free.