
By several key indicators, economic conditions worsened in the United States in 2020. Unemployment climbed from an annual average of 3.7% to 8.1%, GDP fell by 3.5%, and businesses across the country shuttered operations for good. There were some bright spots, however, and one of them is labor productivity, which increased in much of the country. Here is a look at the state economies hit hardest by the COVID-19 recession.
Though total hours American workers logged, as well as total output, fell in 2020, the average value of a single hour of work increased in 45 states. Many of the states that reported the largest increases in labor productivity are those that already rank among the most productive in the country, including New York — the most productive state.
New York is one of only 10 states where productivity climbed by more than 5.0% in 2020. The value of a single hour of work in the state rose to an average of $92.27, nearly double the productivity in some other states.
Using data from the Bureau of Labor Statistics, 24/7 Wall St. ranked states by overall productivity. It is important to note that productivity values are adjusted for inflation to 2012 dollars for more accurate comparisons, both state to state and year over year, and that only private sector, nonfarm labor is considered.
Improvements and differences in productivity from state to state can be due to a number of factors, including technological advancements, capital available to workers, and the workforce’s education and skill level. Here is a look at the most educated city in every state.
Click here to see the most productive state in America

50. Mississippi
> 2020 productivity: $47.62 generated per hour worked
> 1-year change in productivity: +2.1% (23rd lowest)
> Total nonfarm labor time, 2020: 1.6 billion hours (16th least)
> 2020 value of production: $85.8 billion (15th least)
[in-text-ad]
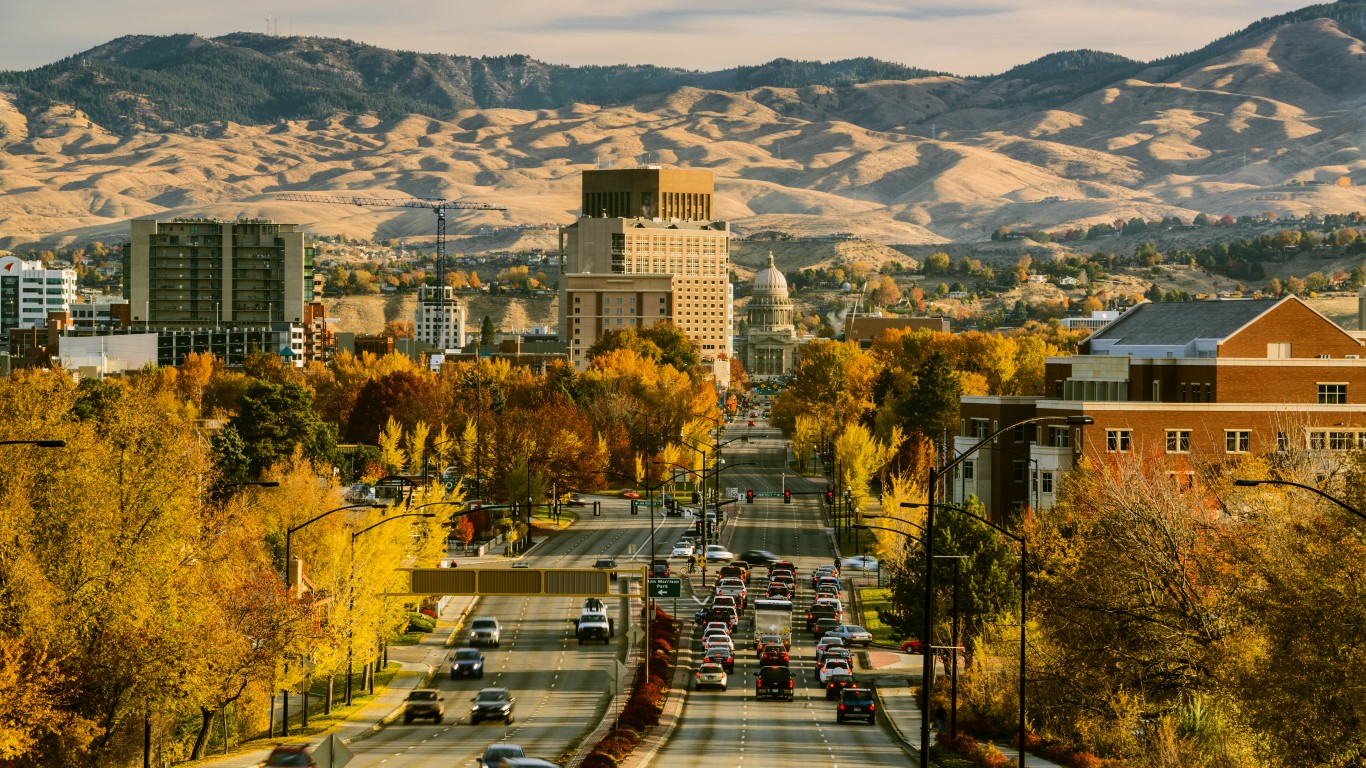
49. Idaho
> 2020 productivity: $48.35 generated per hour worked
> 1-year change in productivity: -2.5% (the lowest)
> Total nonfarm labor time, 2020: 1.1 billion hours (14th least)
> 2020 value of production: $63.4 billion (12th least)

48. Maine
> 2020 productivity: $48.84 generated per hour worked
> 1-year change in productivity: +3.8% (20th highest)
> Total nonfarm labor time, 2020: 901.3 million hours (10th least)
> 2020 value of production: $51.3 billion (8th least)

47. Arkansas
> 2020 productivity: $50.30 generated per hour worked
> 1-year change in productivity: +1.7% (16th lowest)
> Total nonfarm labor time, 2020: 1.8 billion hours (17th least)
> 2020 value of production: $103.1 billion (17th least)
[in-text-ad-2]

46. Montana
> 2020 productivity: $51.31 generated per hour worked
> 1-year change in productivity: -0.7% (5th lowest)
> Total nonfarm labor time, 2020: 667.1 million hours (7th least)
> 2020 value of production: $37.9 billion (4th least)

45. Vermont
> 2020 productivity: $51.46 generated per hour worked
> 1-year change in productivity: +4.0% (16th highest)
> Total nonfarm labor time, 2020: 421.9 million hours (2nd least)
> 2020 value of production: $25.1 billion (the least)
[in-text-ad]

44. Alabama
> 2020 productivity: $51.81 generated per hour worked
> 1-year change in productivity: +1.2% (9th lowest)
> Total nonfarm labor time, 2020: 2.9 billion hours (24th most)
> 2020 value of production: $171.6 billion (24th least)

43. Kentucky
> 2020 productivity: $52.86 generated per hour worked
> 1-year change in productivity: +0.5% (7th lowest)
> Total nonfarm labor time, 2020: 2.8 billion hours (25th least)
> 2020 value of production: $166.6 billion (23rd least)

42. South Carolina
> 2020 productivity: $53.63 generated per hour worked
> 1-year change in productivity: +2.8% (25th highest)
> Total nonfarm labor time, 2020: 3.0 billion hours (23rd most)
> 2020 value of production: $186.6 billion (25th least)
[in-text-ad-2]

41. South Dakota
> 2020 productivity: $54.63 generated per hour worked
> 1-year change in productivity: -1.9% (2nd lowest)
> Total nonfarm labor time, 2020: 627.6 million hours (6th least)
> 2020 value of production: $42.5 billion (6th least)

40. Tennessee
> 2020 productivity: $54.76 generated per hour worked
> 1-year change in productivity: -1.4% (3rd lowest)
> Total nonfarm labor time, 2020: 4.7 billion hours (15th most)
> 2020 value of production: $298.6 billion (18th most)
[in-text-ad]

39. Missouri
> 2020 productivity: $55.51 generated per hour worked
> 1-year change in productivity: +1.9% (20th lowest)
> Total nonfarm labor time, 2020: 4.1 billion hours (20th most)
> 2020 value of production: $260.6 billion (22nd most)

38. Arizona
> 2020 productivity: $56.56 generated per hour worked
> 1-year change in productivity: +1.6% (12th lowest)
> Total nonfarm labor time, 2020: 4.5 billion hours (17th most)
> 2020 value of production: $291.7 billion (20th most)

37. Florida
> 2020 productivity: $57.55 generated per hour worked
> 1-year change in productivity: +3.9% (19th highest)
> Total nonfarm labor time, 2020: 13.0 billion hours (3rd most)
> 2020 value of production: $869.6 billion (4th most)
[in-text-ad-2]

36. West Virginia
> 2020 productivity: $57.70 generated per hour worked
> 1-year change in productivity: +1.6% (11th lowest)
> Total nonfarm labor time, 2020: 935.8 million hours (11th least)
> 2020 value of production: $56.3 billion (9th least)

35. Iowa
> 2020 productivity: $57.80 generated per hour worked
> 1-year change in productivity: +3.3% (24th highest)
> Total nonfarm labor time, 2020: 2.2 billion hours (21st least)
> 2020 value of production: $150.2 billion (21st least)
[in-text-ad]

34. Wisconsin
> 2020 productivity: $57.86 generated per hour worked
> 1-year change in productivity: +1.0% (8th lowest)
> Total nonfarm labor time, 2020: 4.2 billion hours (19th most)
> 2020 value of production: $275.4 billion (21st most)

33. Indiana
> 2020 productivity: $59.91 generated per hour worked
> 1-year change in productivity: +2.0% (21st lowest)
> Total nonfarm labor time, 2020: 4.6 billion hours (16th most)
> 2020 value of production: $311.0 billion (15th most)

32. Rhode Island
> 2020 productivity: $60.30 generated per hour worked
> 1-year change in productivity: +4.9% (11th highest)
> Total nonfarm labor time, 2020: 674.1 million hours (8th least)
> 2020 value of production: $47.2 billion (7th least)
[in-text-ad-2]

31. North Carolina
> 2020 productivity: $60.44 generated per hour worked
> 1-year change in productivity: +1.6% (13th lowest)
> Total nonfarm labor time, 2020: 6.6 billion hours (8th most)
> 2020 value of production: $467.5 billion (12th most)

30. Nebraska
> 2020 productivity: $60.51 generated per hour worked
> 1-year change in productivity: +1.8% (17th lowest)
> Total nonfarm labor time, 2020: 1.4 billion hours (15th least)
> 2020 value of production: $99.1 billion (16th least)
[in-text-ad]

29. Nevada
> 2020 productivity: $60.55 generated per hour worked
> 1-year change in productivity: +8.0% (2nd highest)
> Total nonfarm labor time, 2020: 2.0 billion hours (19th least)
> 2020 value of production: $139.7 billion (19th least)

28. Utah
> 2020 productivity: $61.12 generated per hour worked
> 1-year change in productivity: +3.3% (23rd highest)
> Total nonfarm labor time, 2020: 2.2 billion hours (20th least)
> 2020 value of production: $156.2 billion (22nd least)

27. New Mexico
> 2020 productivity: $61.49 generated per hour worked
> 1-year change in productivity: +3.4% (22nd highest)
> Total nonfarm labor time, 2020: 1.1 billion hours (13th least)
> 2020 value of production: $66.9 billion (13th least)
[in-text-ad-2]

26. Oklahoma
> 2020 productivity: $61.53 generated per hour worked
> 1-year change in productivity: -1.4% (4th lowest)
> Total nonfarm labor time, 2020: 2.4 billion hours (22nd least)
> 2020 value of production: $140.9 billion (20th least)

25. Michigan
> 2020 productivity: $61.86 generated per hour worked
> 1-year change in productivity: +5.0% (10th highest)
> Total nonfarm labor time, 2020: 6.0 billion hours (10th most)
> 2020 value of production: $424.0 billion (13th most)
[in-text-ad]

24. New Hampshire
> 2020 productivity: $62.69 generated per hour worked
> 1-year change in productivity: +1.8% (19th lowest)
> Total nonfarm labor time, 2020: 974.0 million hours (12th least)
> 2020 value of production: $69.6 billion (14th least)

23. Ohio
> 2020 productivity: $62.87 generated per hour worked
> 1-year change in productivity: +1.7% (14th lowest)
> Total nonfarm labor time, 2020: 7.9 billion hours (7th most)
> 2020 value of production: $557.3 billion (7th most)

22. Oregon
> 2020 productivity: $63.12 generated per hour worked
> 1-year change in productivity: +5.8% (5th highest)
> Total nonfarm labor time, 2020: 2.7 billion hours (24th least)
> 2020 value of production: $193.7 billion (25th most)
[in-text-ad-2]

21. Kansas
> 2020 productivity: $63.42 generated per hour worked
> 1-year change in productivity: +2.7% (24th lowest)
> Total nonfarm labor time, 2020: 1.9 billion hours (18th least)
> 2020 value of production: $137.1 billion (18th least)

20. Virginia
> 2020 productivity: $64.69 generated per hour worked
> 1-year change in productivity: +2.7% (25th lowest)
> Total nonfarm labor time, 2020: 5.5 billion hours (12th most)
> 2020 value of production: $405.6 billion (14th most)
[in-text-ad]

19. Minnesota
> 2020 productivity: $64.84 generated per hour worked
> 1-year change in productivity: +1.5% (10th lowest)
> Total nonfarm labor time, 2020: 4.2 billion hours (18th most)
> 2020 value of production: $308.5 billion (16th most)

18. Georgia
> 2020 productivity: $66.54 generated per hour worked
> 1-year change in productivity: +3.7% (21st highest)
> Total nonfarm labor time, 2020: 6.6 billion hours (9th most)
> 2020 value of production: $505.7 billion (8th most)

17. Louisiana
> 2020 productivity: $67.83 generated per hour worked
> 1-year change in productivity: +4.1% (15th highest)
> Total nonfarm labor time, 2020: 2.8 billion hours (25th most)
> 2020 value of production: $198.3 billion (24th most)
[in-text-ad-2]

16. Pennsylvania
> 2020 productivity: $67.98 generated per hour worked
> 1-year change in productivity: +4.0% (17th highest)
> Total nonfarm labor time, 2020: 8.6 billion hours (5th most)
> 2020 value of production: $648.0 billion (6th most)

15. North Dakota
> 2020 productivity: $68.12 generated per hour worked
> 1-year change in productivity: +4.4% (13th highest)
> Total nonfarm labor time, 2020: 581.7 million hours (4th least)
> 2020 value of production: $41.1 billion (5th least)
[in-text-ad]

14. Hawaii
> 2020 productivity: $68.38 generated per hour worked
> 1-year change in productivity: +8.5% (the highest)
> Total nonfarm labor time, 2020: 754.3 million hours (9th least)
> 2020 value of production: $60.8 billion (10th least)

13. Maryland
> 2020 productivity: $70.75 generated per hour worked
> 1-year change in productivity: +4.6% (12th highest)
> Total nonfarm labor time, 2020: 3.7 billion hours (22nd most)
> 2020 value of production: $296.6 billion (19th most)

12. Illinois
> 2020 productivity: $72.17 generated per hour worked
> 1-year change in productivity: +2.1% (22nd lowest)
> Total nonfarm labor time, 2020: 8.5 billion hours (6th most)
> 2020 value of production: $711.4 billion (5th most)
[in-text-ad-2]

11. Colorado
> 2020 productivity: $73.52 generated per hour worked
> 1-year change in productivity: +4.4% (14th highest)
> Total nonfarm labor time, 2020: 3.8 billion hours (21st most)
> 2020 value of production: $307.4 billion (17th most)

10. Wyoming
> 2020 productivity: $75.33 generated per hour worked
> 1-year change in productivity: +0.3% (6th lowest)
> Total nonfarm labor time, 2020: 375.0 million hours (the least)
> 2020 value of production: $26.7 billion (2nd least)
[in-text-ad]

9. Texas
> 2020 productivity: $75.45 generated per hour worked
> 1-year change in productivity: +1.8% (18th lowest)
> Total nonfarm labor time, 2020: 19.3 billion hours (2nd most)
> 2020 value of production: $1.5 trillion (2nd most)

8. New Jersey
> 2020 productivity: $77.94 generated per hour worked
> 1-year change in productivity: +5.4% (8th highest)
> Total nonfarm labor time, 2020: 5.6 billion hours (11th most)
> 2020 value of production: $501.8 billion (9th most)

7. Connecticut
> 2020 productivity: $82.99 generated per hour worked
> 1-year change in productivity: +1.7% (15th lowest)
> Total nonfarm labor time, 2020: 2.4 billion hours (23rd least)
> 2020 value of production: $231.1 billion (23rd most)
[in-text-ad-2]

6. Massachusetts
> 2020 productivity: $83.04 generated per hour worked
> 1-year change in productivity: +5.7% (6th highest)
> Total nonfarm labor time, 2020: 5.0 billion hours (13th most)
> 2020 value of production: $480.4 billion (11th most)

5. Delaware
> 2020 productivity: $84.56 generated per hour worked
> 1-year change in productivity: +5.7% (7th highest)
> Total nonfarm labor time, 2020: 605.7 million hours (5th least)
> 2020 value of production: $62.8 billion (11th least)
[in-text-ad]

4. California
> 2020 productivity: $86.31 generated per hour worked
> 1-year change in productivity: +6.1% (4th highest)
> Total nonfarm labor time, 2020: 25.0 billion hours (the most)
> 2020 value of production: $2.4 trillion (the most)

3. Washington
> 2020 productivity: $87.48 generated per hour worked
> 1-year change in productivity: +3.9% (18th highest)
> Total nonfarm labor time, 2020: 5.0 billion hours (14th most)
> 2020 value of production: $488.4 billion (10th most)

2. Alaska
> 2020 productivity: $91.13 generated per hour worked
> 1-year change in productivity: +6.3% (3rd highest)
> Total nonfarm labor time, 2020: 424.0 million hours (3rd least)
> 2020 value of production: $35.9 billion (3rd least)
[in-text-ad-2]

1. New York
> 2020 productivity: $92.27 generated per hour worked
> 1-year change in productivity: +5.2% (9th highest)
> Total nonfarm labor time, 2020: 12.4 billion hours (4th most)
> 2020 value of production: $1.4 trillion (3rd most)
Thank you for reading! Have some feedback for us?
Contact the 24/7 Wall St. editorial team.
 24/7 Wall St.
 24/7 Wall St.


