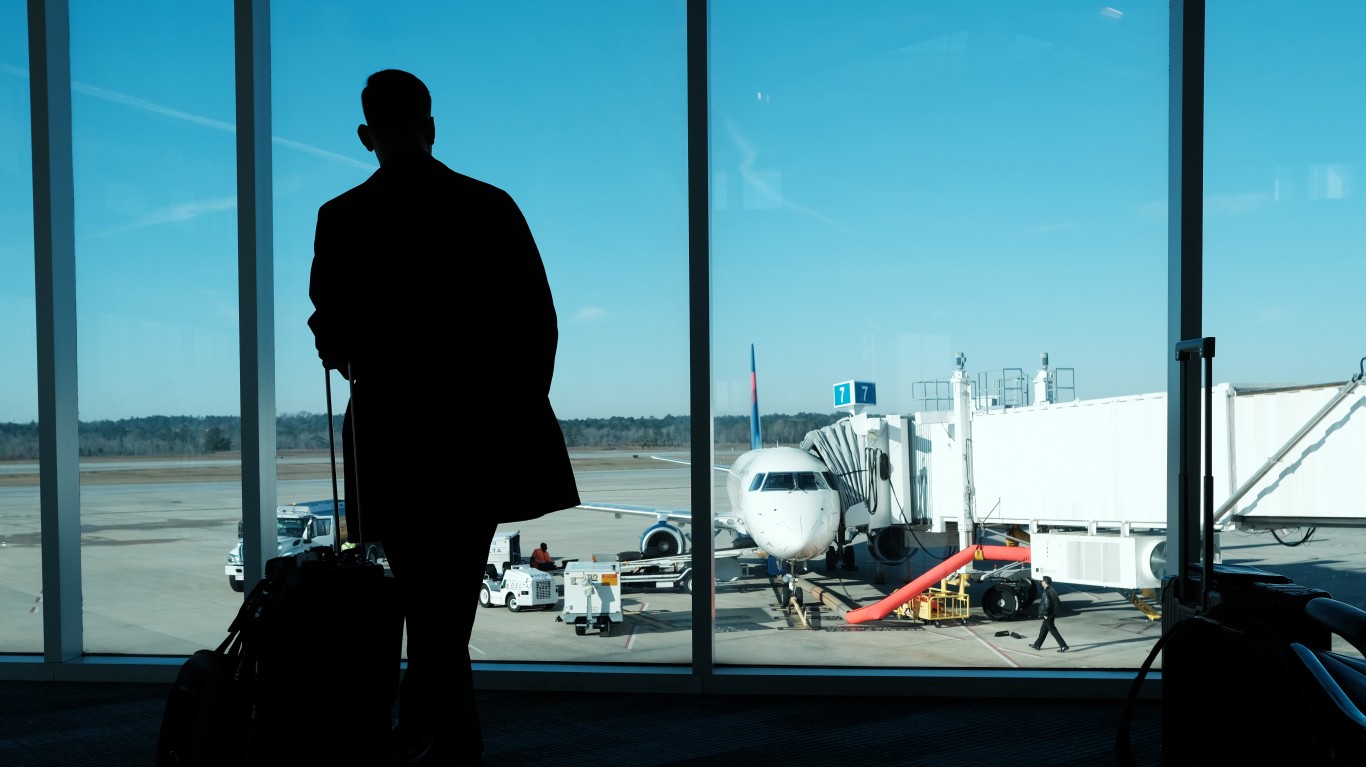
The air travel industry has changed a great deal in a year. Air travel dropped close to zero during the worst part of the COVID-19 pandemic. Airports were empty and planes were grounded. Several large airlines nearly went out of business. Holiday travel in 2020 was sharply curtailed. In 2021, though, more than 2.3 million people flew over the Thanksgiving weekend, the highest level since the pandemic began. There were not enough TSA agents at some airports to handle the volume, which backed up travelers on their way to their planes. (These are America’s busiest air routes right now.)
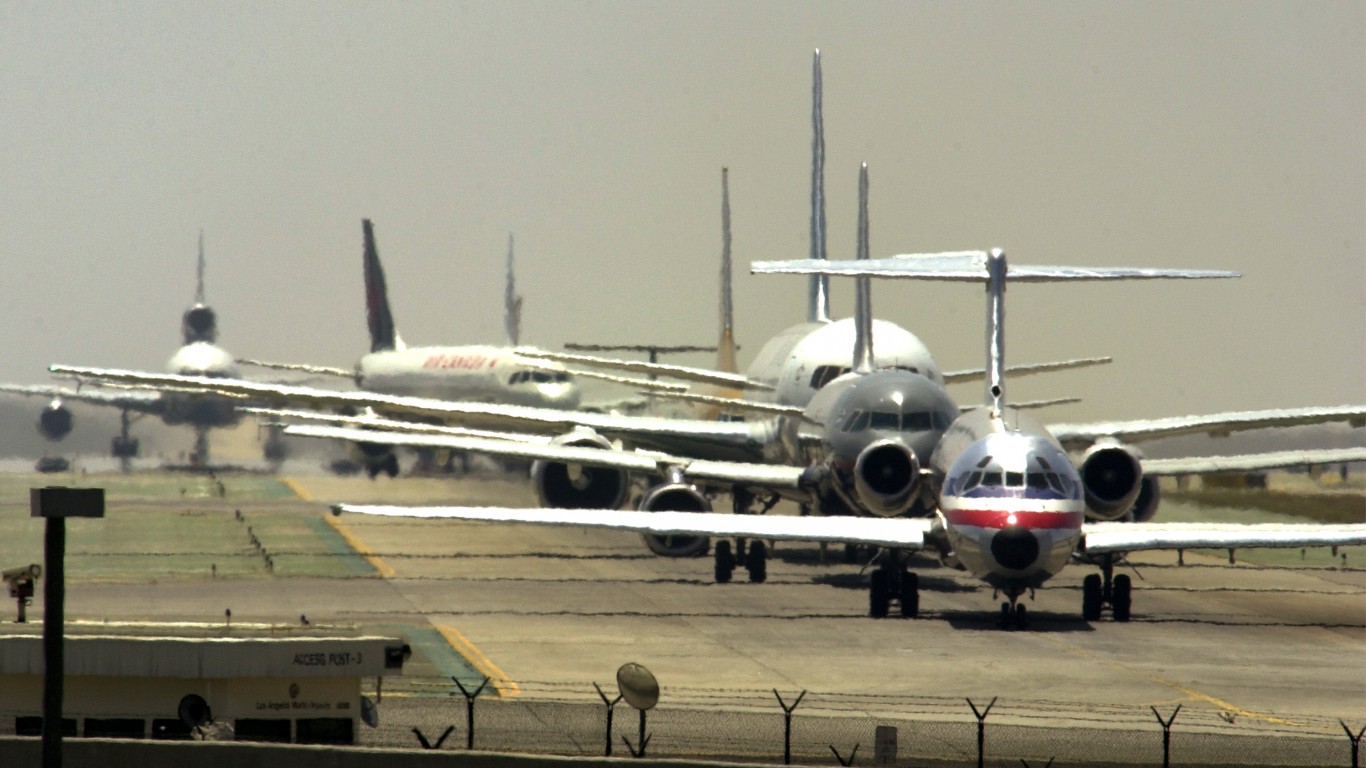
Several airlines have been hit with major delays in the past several months. The most widely covered by the media was a breakdown of the ability of American Airlines to handle all of its passengers. Over 1,000 American Airlines flights were canceled in one day. This left thousands of people stranded in airports. If you’re forced into an unplanned layover at Dallas-Fort Worth International Airport, head for Dallas – because the worst city for a layover is Fort Worth.
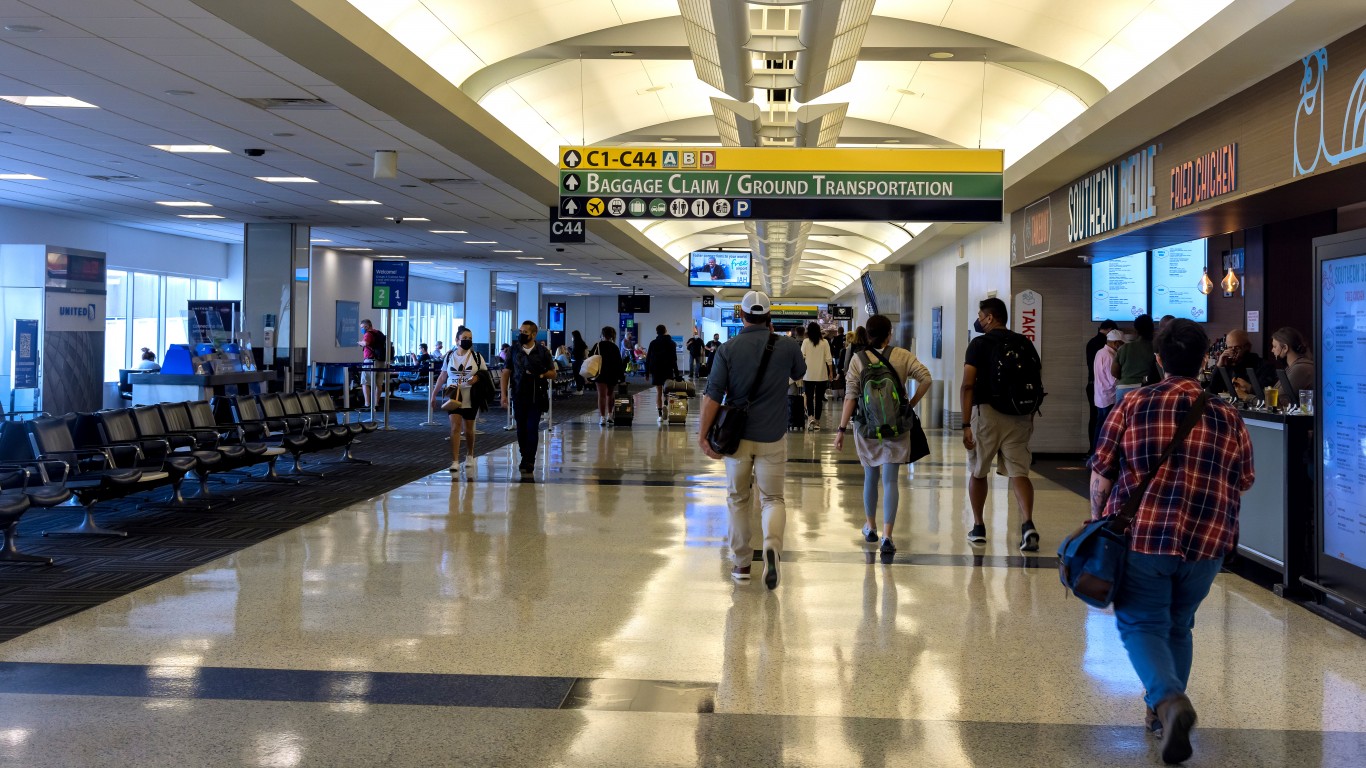
Lawn Love, an online lawn care marketplace, recently released its report on “2022’s Best and Worst Cities for Layovers,” examining 56 of the country’s largest cities and the airports that serve them. The report’s authors wrote, “We looked at each city’s share of delayed and canceled flights and average departure delay time. We also searched for cities that are easy to navigate, especially from the airport, and offer plenty of fun things to see and do without breaking your bank.” (You might end up really liking the city you visit on a layover, especially if it’s one of America’s 50 best cities to live.)
The study considered the share of delay departures, share of arrivals, average length of delays, and maximum delay. The research also included what it cost to stay in the airport, the ease of leaving the airport and coming back, and the safety of the airport. Data came from AreaVibes, Bureau of Transportation Statistics, City-Data.com, LoungeBuddy, Lyft, NeighborhoodScout, TripAdvisor, Uber, Walk Score and Yelp.
The highest overall score for best city for a layover was Portland, Oregon, which received a rating of 66.12. The number of delays and cancellations at the airport is very low. Boise was second at 65.73. It ranked well for similar reasons. Anchorage ranked third at 64.80, and it had the best figure for delays among all airports.
Click here to see the best and worst cities for airport layovers
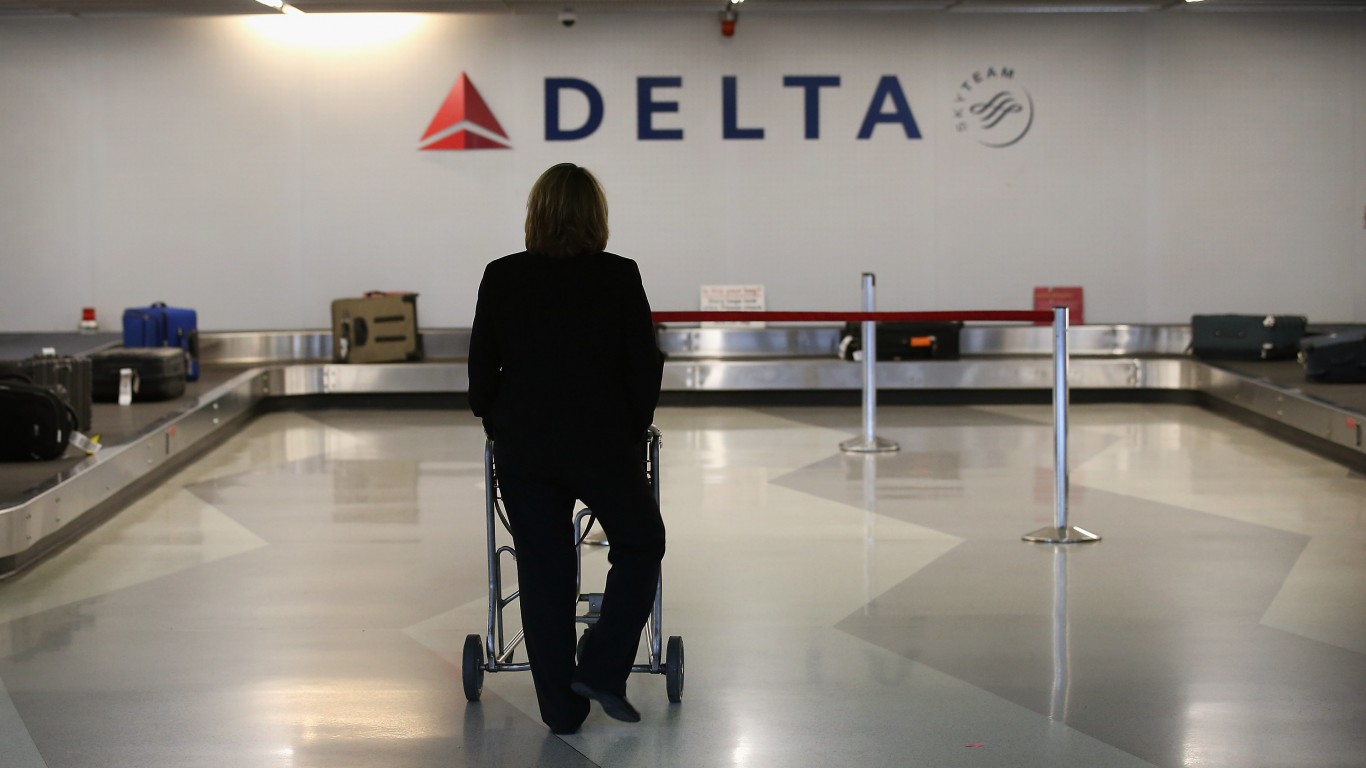
The city with the worst ranking was Fort Worth, with a score of 37.28. It was followed by Detroit and Newark. The latter is one of the three airports that serve New York City. The other two are JFK and LaGuardia.

56. Fort Worth, Texas
> Overall score: 37.3
[in-text-ad]

55. Detroit, Michigan
> Overall score: 39.9
[recirclink id=848007]

54. Newark, New Jersey
> Overall score: 41.2

53. Durham, North Carolina
> Overall score: 42.7
[in-text-ad-2]

52. Cincinnati, Ohio
> Overall score: 43.9

51. Denver, Colorado
> Overall score: 45
[in-text-ad]

50. Raleigh, North Carolina
> Overall score: 45.8
[recirclink id=827531]

49. St. Louis, Missouri
> Overall score: 45.9

48. Kansas City, Missouri
> Overall score: 46.8
[in-text-ad-2]

47. Oklahoma City, Oklahoma
> Overall score: 47.3

46. Orlando, Florida
> Overall score: 47.8
[in-text-ad]

45. Fort Lauderdale, Florida
> Overall score: 47.9
[recirclink id=848195]

44. Cleveland, Ohio
> Overall score: 48.3

43. Dallas, Texas
> Overall score: 48.4
[in-text-ad-2]

42. San Francisco, California
> Overall score: 48.5

41. Chicago, Illinois
> Overall score: 48.5
[in-text-ad]

40. Memphis, Tennessee
> Overall score: 48.5
[recirclink id=848007]

39. Jacksonville, Florida
> Overall score: 50.7

38. Baltimore, Maryland
> Overall score: 51.1
[in-text-ad-2]

37. Columbus, Ohio
> Overall score: 51.3

36. Charlotte, North Carolina
> Overall score: 51.6
[in-text-ad]

35. Tacoma, Washington
> Overall score: 51.7
[recirclink id=827531]

34. Las Vegas, Nevada
> Overall score: 51.8

33. Ontario, California
> Overall score: 51.8
[in-text-ad-2]

32. Indianapolis, Indiana
> Overall score: 52

31. Boston, Massachusetts
> Overall score: 52.2
[in-text-ad]

30. Washington, DC
> Overall score: 52.5
[recirclink id=848195]

29. Pittsburgh, Pennsylvania
> Overall score: 52.6

28. Houston, Texas
> Overall score: 52.7
[in-text-ad-2]
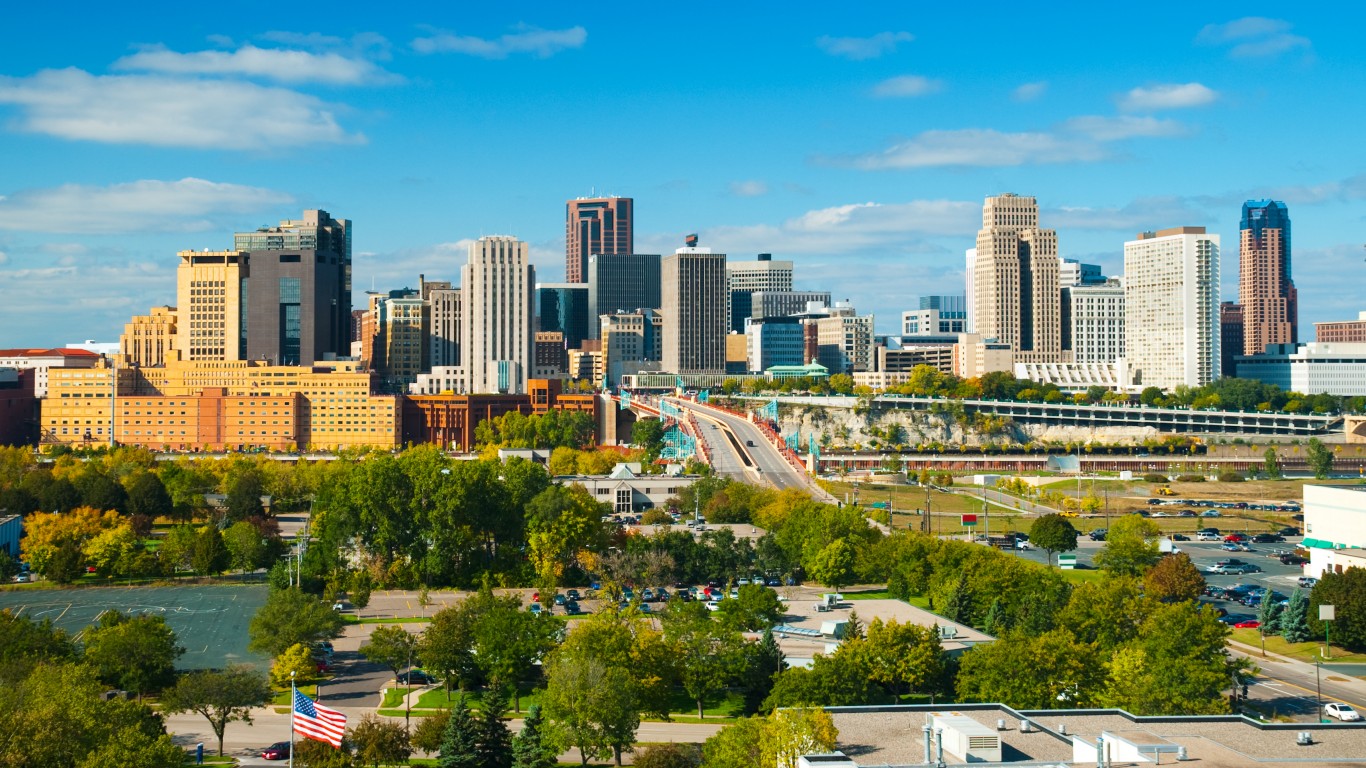
27. St. Paul, Minnesota
> Overall score: 52.9

26. Minneapolis, Minnesota
> Overall score: 54.2
[in-text-ad]

25. New Orleans, Louisiana
> Overall score: 54.3
[recirclink id=848007]

24. Nashville, Tennessee
> Overall score: 54.4

23. Oakland, California
> Overall score: 54.5
[in-text-ad-2]

22. Tampa, Florida
> Overall score: 54.7

21. Austin, Texas
> Overall score: 54.9
[in-text-ad]

20. Santa Ana, California
> Overall score: 55
[recirclink id=827531]

19. Omaha, Nebraska
> Overall score: 55.2

18. Phoenix, Arizona
> Overall score: 56
[in-text-ad-2]

17. Reno, Nevada
> Overall score: 56.4

16. San Jose, California
> Overall score: 56.5
[in-text-ad]

15. Milwaukee, Wisconsin
> Overall score: 56.5
[recirclink id=848195]

14. Philadelphia, Pennsylvania
> Overall score: 56.8

13. Salt Lake City, Utah
> Overall score: 57.4
[in-text-ad-2]

12. San Diego, California
> Overall score: 57.5

11. Seattle, Washington
> Overall score: 58
[in-text-ad]

10. San Antonio, Texas
> Overall score: 58.2
[recirclink id=848007]

9. Sacramento, California
> Overall score: 59

8. Atlanta, Georgia
> Overall score: 59.7
[in-text-ad-2]

7. Los Angeles, California
> Overall score: 59.9

6. Miami, Florida
> Overall score: 60.4
[in-text-ad]

5. Honolulu, Hawaii
> Overall score: 60.5
[recirclink id=827531]

4. New York, New York
> Overall score: 63.1

3. Anchorage, Alaska
> Overall score: 64.8
[in-text-ad-2]

2. Boise, Idaho
> Overall score: 65.7

1. Portland, Oregon
> Overall score: 66.1