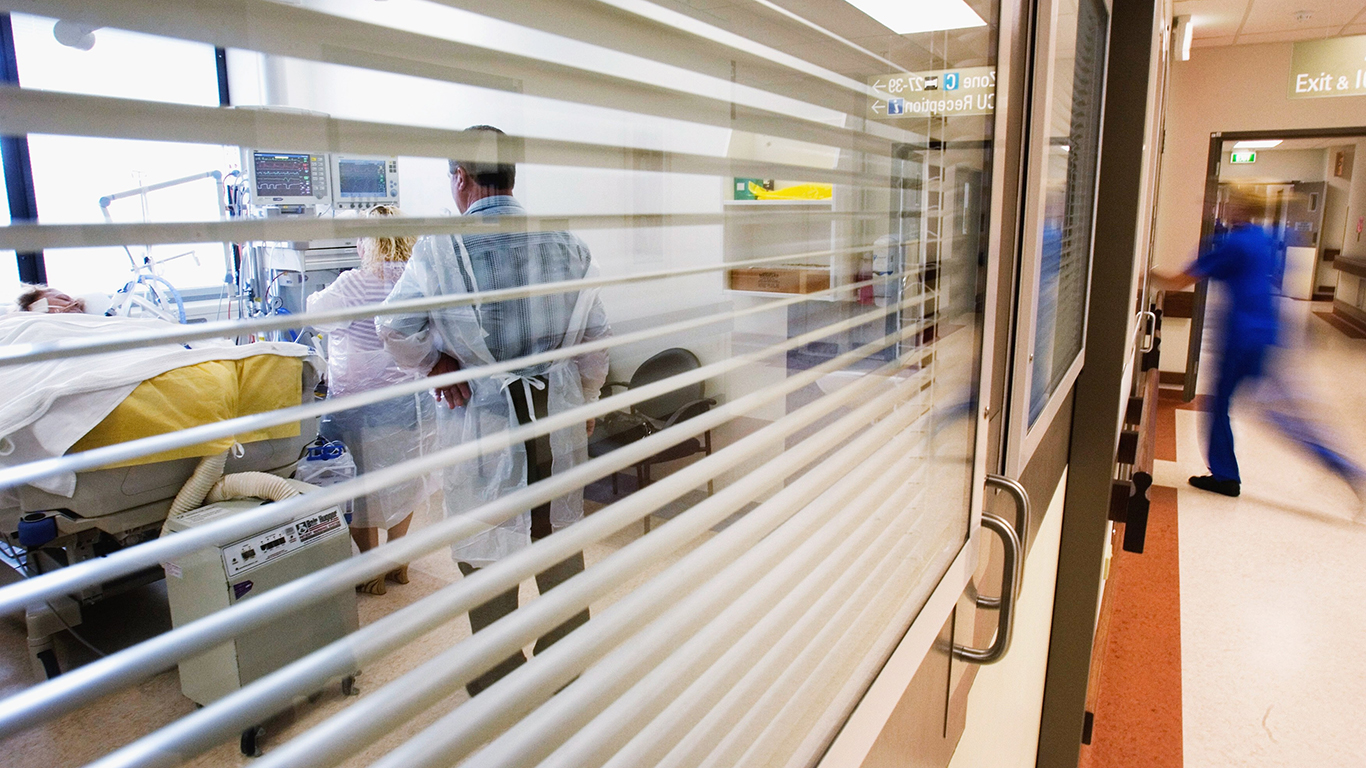
If you’ve ridden the bus or subway to work, you’ve seen them — sleep-deprived commuters nodding off on the way to their jobs. The reasons for sleep deprivation are many. Inconsistent bedtimes, using technology late at night, shift work, long work hours, stress, and sleep apnea can all affect the duration and quality of sleep. (Here are 14 reasons you’re not getting enough sleep.)
In some states, people get more sleep than others. To determine the states getting the most and the least sleep, 24/7 Tempo reviewed the share of adults reporting fewer than seven hours of sleep on average from the 2021 County Health Rankings & Roadmaps report.
The Centers for Disease Control and Prevention reports that 35.2% of American adults usually get less than the recommended amount of sleep, which the CDC says is seven hours of sleep over a 24-hour period. That is an elusive goal, and not getting enough sleep brings any number of risks — lack of concentration while driving and mistakes made at work are among them.
Sleep deprivation has also been connected to chronic conditions such as Type 2 diabetes, obesity, and depression. (These are 21 things that happen to your body when you don’t get enough sleep.)
Lack of sleep becomes less of an issue with age, as just 26.3% of U.S. adults over 65 report short sleep duration, according to a survey done by the CDC in 2014.
A higher percentage of adults who report short sleep duration — less than seven hours of sleep over a 24-hour period — tend to reside in the southeastern and Midwestern U.S. and in states along the Appalachian Mountains. Those getting the most shut-eye tend to live in the Great Plains and Far West states.
Click here to see the states getting the most and least sleep
Click here to read our detailed methodology

50. Minnesota
> Pct. of adults reporting insufficient sleep: 29.1%
> Pct. of adults reporting excessive drinking: 23.2% — 7th highest
> Adults reporting no physical activity: 19.6% — 9th lowest
> Avg. number of unhealthy days per month: 3.5 days — 4th lowest
> Adult population: 4,336,963
[in-text-ad]

49. Colorado
> Pct. of adults reporting insufficient sleep: 30.0%
> Pct. of adults reporting excessive drinking: 21.3% — 12th highest
> Adults reporting no physical activity: 14.8% — the lowest
> Avg. number of unhealthy days per month: 3.7 days — 8th lowest
> Adult population: 4,502,416
[recirclink id=992567]
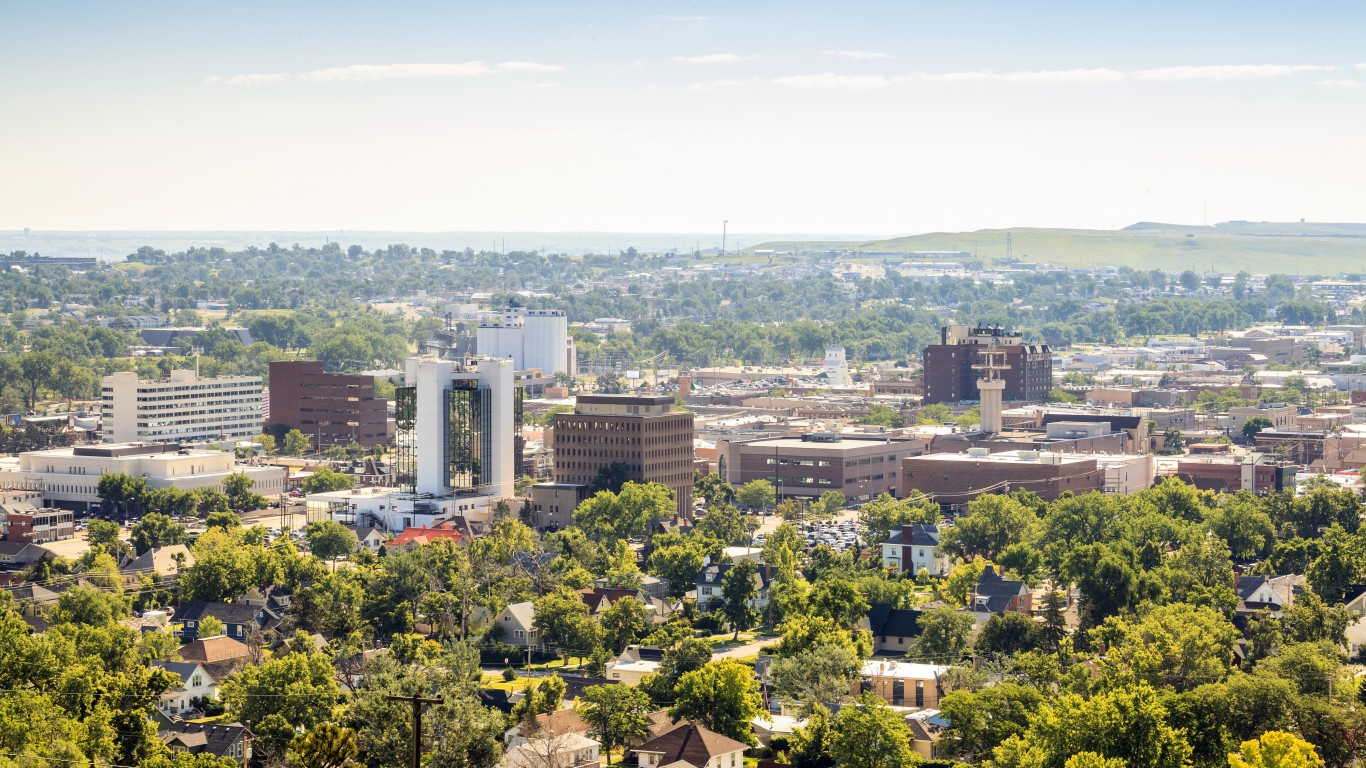
48. South Dakota
> Pct. of adults reporting insufficient sleep: 30.1%
> Pct. of adults reporting excessive drinking: 24.3% — 3rd highest
> Adults reporting no physical activity: 22.0% — 21st lowest
> Avg. number of unhealthy days per month: 3.3 days — the lowest
> Adult population: 669,390

47. Vermont
> Pct. of adults reporting insufficient sleep: 30.1%
> Pct. of adults reporting excessive drinking: 20.5% — 16th highest
> Adults reporting no physical activity: 18.4% — 6th lowest
> Avg. number of unhealthy days per month: 4.2 days — 22nd highest
> Adult population: 510,430
[in-text-ad-2]
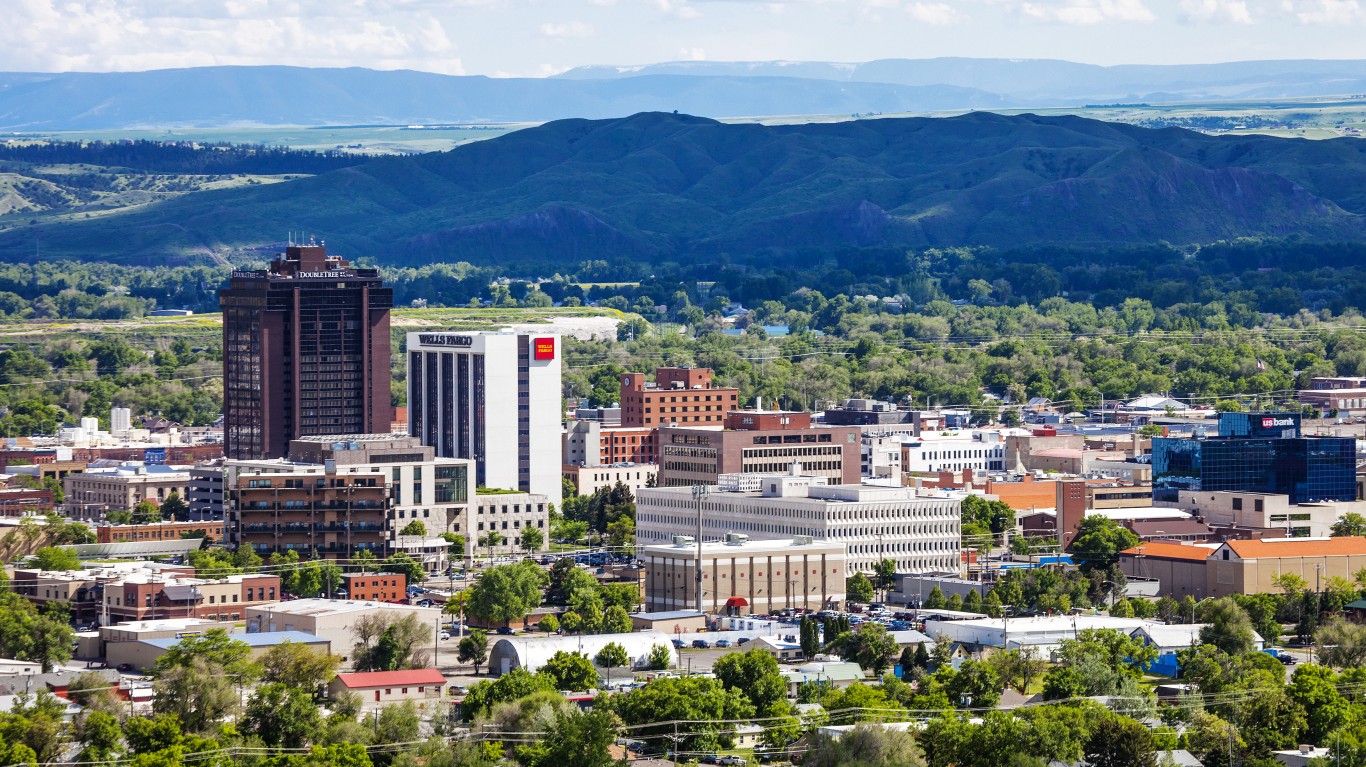
46. Montana
> Pct. of adults reporting insufficient sleep: 30.9%
> Pct. of adults reporting excessive drinking: 21.9% — 10th highest
> Adults reporting no physical activity: 21.7% — 19th lowest
> Avg. number of unhealthy days per month: 3.9 days — 16th lowest
> Adult population: 842,254
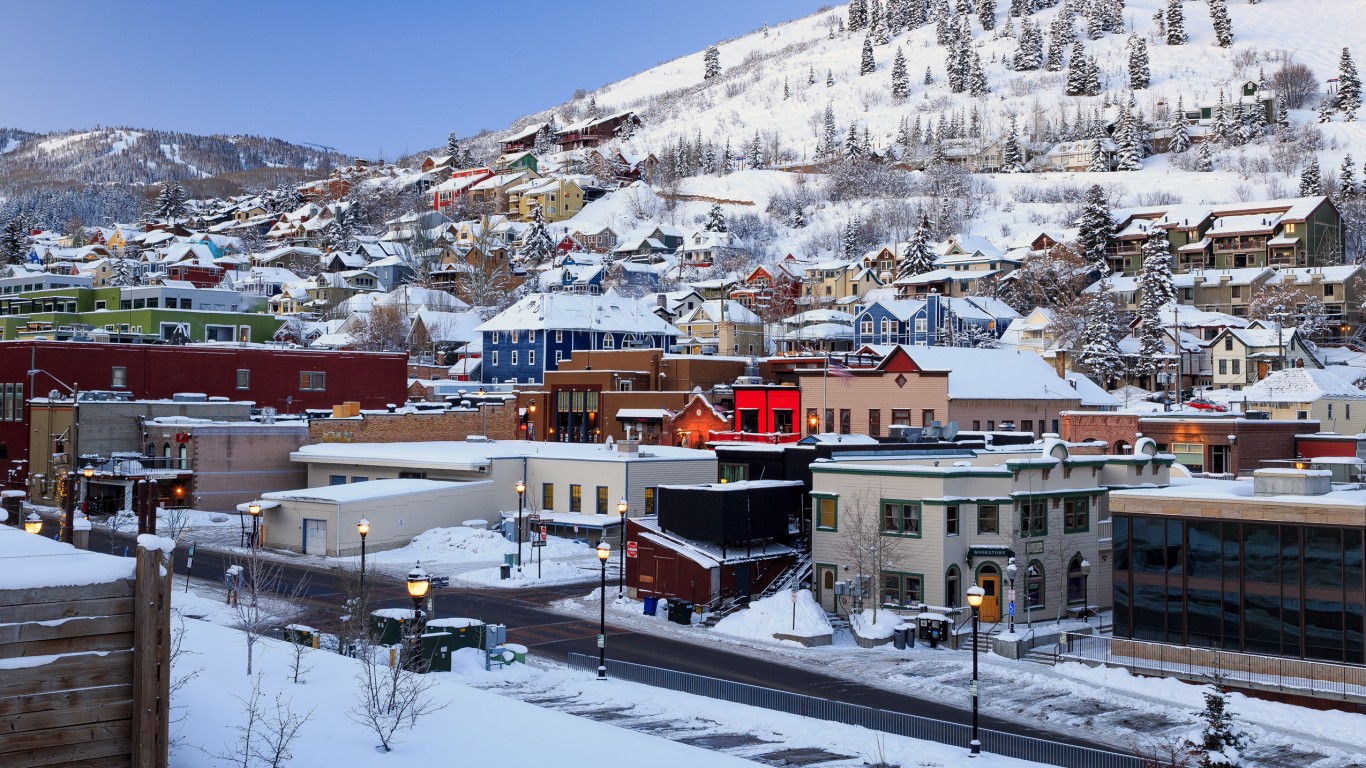
45. Utah
> Pct. of adults reporting insufficient sleep: 31.2%
> Pct. of adults reporting excessive drinking: 11.1% — the lowest
> Adults reporting no physical activity: 16.7% — 3rd lowest
> Avg. number of unhealthy days per month: 3.9 days — 17th lowest
> Adult population: 2,275,650
[in-text-ad]

44. Washington
> Pct. of adults reporting insufficient sleep: 31.8%
> Pct. of adults reporting excessive drinking: 17.1% — 11th lowest
> Adults reporting no physical activity: 16.4% — 2nd lowest
> Avg. number of unhealthy days per month: 4.0 days — 20th lowest
> Adult population: 5,951,928
[recirclink id=991221]

43. Nebraska
> Pct. of adults reporting insufficient sleep: 32.3%
> Pct. of adults reporting excessive drinking: 23.7% — 5th highest
> Adults reporting no physical activity: 22.7% — 25th highest
> Avg. number of unhealthy days per month: 3.6 days — 6th lowest
> Adult population: 1,459,312

42. Wisconsin
> Pct. of adults reporting insufficient sleep: 32.7%
> Pct. of adults reporting excessive drinking: 27.1% — the highest
> Adults reporting no physical activity: 20.3% — 13th lowest
> Avg. number of unhealthy days per month: 4.0 days — 23rd lowest
> Adult population: 4,559,022
[in-text-ad-2]

41. North Dakota
> Pct. of adults reporting insufficient sleep: 32.8%
> Pct. of adults reporting excessive drinking: 23.7% — 4th highest
> Adults reporting no physical activity: 23.1% — 23rd highest
> Avg. number of unhealthy days per month: 3.8 days — 14th lowest
> Adult population: 585,356

40. Oregon
> Pct. of adults reporting insufficient sleep: 32.8%
> Pct. of adults reporting excessive drinking: 19.5% — 24th highest
> Adults reporting no physical activity: 17.3% — 4th lowest
> Avg. number of unhealthy days per month: 4.8 days — 10th highest
> Adult population: 3,354,921
[in-text-ad]

39. New Mexico
> Pct. of adults reporting insufficient sleep: 33.1%
> Pct. of adults reporting excessive drinking: 16.7% — 8th lowest
> Adults reporting no physical activity: 19.0% — 7th lowest
> Avg. number of unhealthy days per month: 4.5 days — 18th highest
> Adult population: 1,622,979
[recirclink id=935271]

38. Iowa
> Pct. of adults reporting insufficient sleep: 33.1%
> Pct. of adults reporting excessive drinking: 25.8% — 2nd highest
> Adults reporting no physical activity: 22.6% — 25th lowest
> Avg. number of unhealthy days per month: 3.5 days — 3rd lowest
> Adult population: 2,433,240
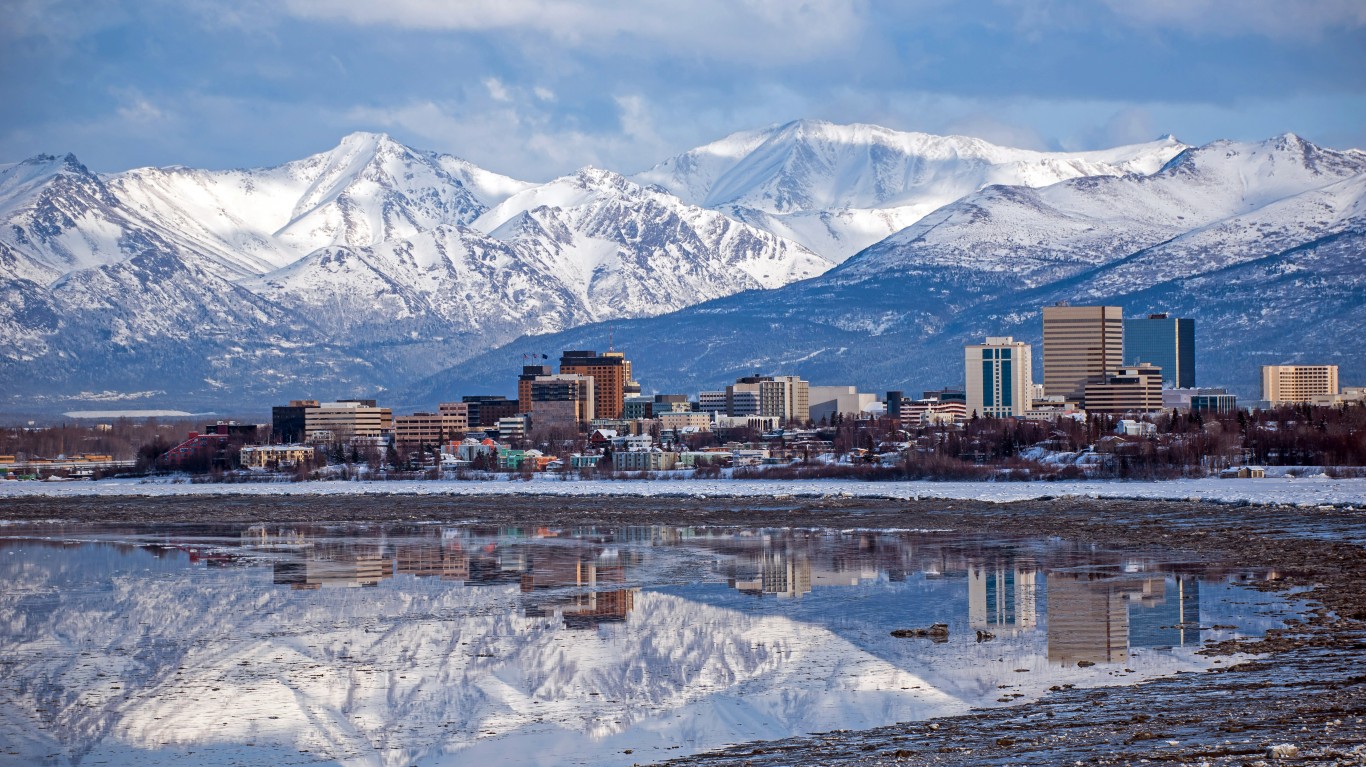
37. Alaska
> Pct. of adults reporting insufficient sleep: 33.3%
> Pct. of adults reporting excessive drinking: 17.6% — 16th lowest
> Adults reporting no physical activity: 19.3% — 8th lowest
> Avg. number of unhealthy days per month: 3.7 days — 9th lowest
> Adult population: 551,796
[in-text-ad-2]
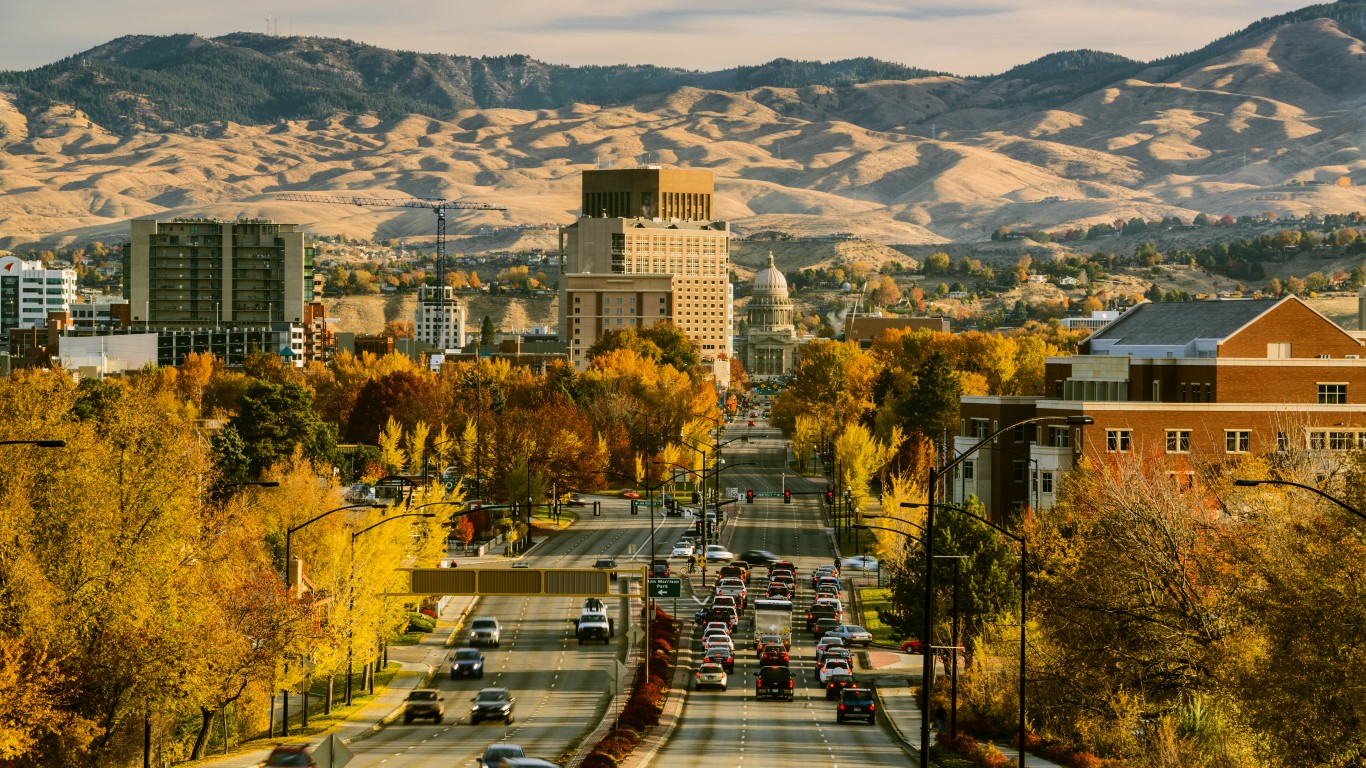
36. Idaho
> Pct. of adults reporting insufficient sleep: 33.4%
> Pct. of adults reporting excessive drinking: 17.1% — 10th lowest
> Adults reporting no physical activity: 20.4% — 14th lowest
> Avg. number of unhealthy days per month: 4.0 days — 19th lowest
> Adult population: 1,337,710

35. Illinois
> Pct. of adults reporting insufficient sleep: 33.5%
> Pct. of adults reporting excessive drinking: 21.5% — 11th highest
> Adults reporting no physical activity: 21.6% — 18th lowest
> Avg. number of unhealthy days per month: 3.8 days — 15th lowest
> Adult population: 9,857,142
[in-text-ad]

34. Wyoming
> Pct. of adults reporting insufficient sleep: 33.8%
> Pct. of adults reporting excessive drinking: 20.1% — 19th highest
> Adults reporting no physical activity: 23.1% — 22nd highest
> Avg. number of unhealthy days per month: 4.0 days — 18th lowest
> Adult population: 444,570
[recirclink id=920533]

33. Connecticut
> Pct. of adults reporting insufficient sleep: 33.8%
> Pct. of adults reporting excessive drinking: 20.5% — 15th highest
> Adults reporting no physical activity: 19.9% — 11th lowest
> Avg. number of unhealthy days per month: 3.8 days — 13th lowest
> Adult population: 2,837,855

32. Kansas
> Pct. of adults reporting insufficient sleep: 34.0%
> Pct. of adults reporting excessive drinking: 18.2% — 22nd lowest
> Adults reporting no physical activity: 23.9% — 17th highest
> Avg. number of unhealthy days per month: 4.1 days — 25th lowest
> Adult population: 2,213,013
[in-text-ad-2]

31. Massachusetts
> Pct. of adults reporting insufficient sleep: 34.3%
> Pct. of adults reporting excessive drinking: 23.5% — 6th highest
> Adults reporting no physical activity: 20.0% — 12th lowest
> Avg. number of unhealthy days per month: 4.3 days — 19th highest
> Adult population: 5,540,726

30. Texas
> Pct. of adults reporting insufficient sleep: 34.4%
> Pct. of adults reporting excessive drinking: 19.0% — 25th lowest
> Adults reporting no physical activity: 23.2% — 21st highest
> Avg. number of unhealthy days per month: 3.8 days — 11th lowest
> Adult population: 21,599,250
[in-text-ad]

29. California
> Pct. of adults reporting insufficient sleep: 34.5%
> Pct. of adults reporting excessive drinking: 18.1% — 21st lowest
> Adults reporting no physical activity: 17.7% — 5th lowest
> Avg. number of unhealthy days per month: 3.7 days — 10th lowest
> Adult population: 30,621,159
[recirclink id=883165]

28. Maine
> Pct. of adults reporting insufficient sleep: 34.5%
> Pct. of adults reporting excessive drinking: 22.0% — 9th highest
> Adults reporting no physical activity: 20.8% — 15th lowest
> Avg. number of unhealthy days per month: 5.0 days — 6th highest
> Adult population: 1,097,859

27. Arizona
> Pct. of adults reporting insufficient sleep: 34.9%
> Pct. of adults reporting excessive drinking: 18.1% — 20th lowest
> Adults reporting no physical activity: 21.2% — 17th lowest
> Avg. number of unhealthy days per month: 4.0 days — 21st lowest
> Adult population: 5,639,069
[in-text-ad-2]

26. Missouri
> Pct. of adults reporting insufficient sleep: 35.2%
> Pct. of adults reporting excessive drinking: 20.5% — 14th highest
> Adults reporting no physical activity: 25.5% — 16th highest
> Avg. number of unhealthy days per month: 4.5 days — 17th highest
> Adult population: 4,764,733

25. New Hampshire
> Pct. of adults reporting insufficient sleep: 35.3%
> Pct. of adults reporting excessive drinking: 20.2% — 17th highest
> Adults reporting no physical activity: 20.8% — 16th lowest
> Avg. number of unhealthy days per month: 4.6 days — 16th highest
> Adult population: 1,103,691
[in-text-ad]

24. North Carolina
> Pct. of adults reporting insufficient sleep: 36.1%
> Pct. of adults reporting excessive drinking: 17.6% — 15th lowest
> Adults reporting no physical activity: 23.3% — 20th highest
> Avg. number of unhealthy days per month: 4.1 days — 25th highest
> Adult population: 8,194,112
[recirclink id=992567]

23. Delaware
> Pct. of adults reporting insufficient sleep: 36.5%
> Pct. of adults reporting excessive drinking: 19.8% — 20th highest
> Adults reporting no physical activity: 27.3% — 8th highest
> Avg. number of unhealthy days per month: 4.2 days — 21st highest
> Adult population: 769,818

22. Rhode Island
> Pct. of adults reporting insufficient sleep: 36.7%
> Pct. of adults reporting excessive drinking: 19.7% — 23rd highest
> Adults reporting no physical activity: 23.5% — 18th highest
> Avg. number of unhealthy days per month: 4.2 days — 24th highest
> Adult population: 855,786
[in-text-ad-2]

21. Arkansas
> Pct. of adults reporting insufficient sleep: 37.2%
> Pct. of adults reporting excessive drinking: 17.3% — 14th lowest
> Adults reporting no physical activity: 30.4% — the highest
> Avg. number of unhealthy days per month: 5.3 days — 2nd highest
> Adult population: 2,318,792

20. Nevada
> Pct. of adults reporting insufficient sleep: 37.3%
> Pct. of adults reporting excessive drinking: 17.9% — 19th lowest
> Adults reporting no physical activity: 22.5% — 24th lowest
> Avg. number of unhealthy days per month: 4.0 days — 22nd lowest
> Adult population: 2,389,419
[in-text-ad]

19. Florida
> Pct. of adults reporting insufficient sleep: 37.3%
> Pct. of adults reporting excessive drinking: 19.7% — 21st highest
> Adults reporting no physical activity: 25.8% — 15th highest
> Avg. number of unhealthy days per month: 4.2 days — 23rd highest
> Adult population: 17,245,782
[recirclink id=991221]

18. Oklahoma
> Pct. of adults reporting insufficient sleep: 37.5%
> Pct. of adults reporting excessive drinking: 14.9% — 5th lowest
> Adults reporting no physical activity: 27.8% — 7th highest
> Avg. number of unhealthy days per month: 4.8 days — 8th highest
> Adult population: 3,004,742

17. New Jersey
> Pct. of adults reporting insufficient sleep: 37.5%
> Pct. of adults reporting excessive drinking: 16.0% — 7th lowest
> Adults reporting no physical activity: 26.6% — 11th highest
> Avg. number of unhealthy days per month: 3.8 days — 12th lowest
> Adult population: 6,944,166
[in-text-ad-2]

16. Maryland
> Pct. of adults reporting insufficient sleep: 37.7%
> Pct. of adults reporting excessive drinking: 15.4% — 6th lowest
> Adults reporting no physical activity: 21.9% — 20th lowest
> Avg. number of unhealthy days per month: 3.7 days — 7th lowest
> Adult population: 4,713,393

15. Mississippi
> Pct. of adults reporting insufficient sleep: 37.8%
> Pct. of adults reporting excessive drinking: 14.8% — 3rd lowest
> Adults reporting no physical activity: 30.4% — 2nd highest
> Avg. number of unhealthy days per month: 4.8 days — 9th highest
> Adult population: 2,277,729
[in-text-ad]

14. Indiana
> Pct. of adults reporting insufficient sleep: 38.0%
> Pct. of adults reporting excessive drinking: 18.6% — 24th lowest
> Adults reporting no physical activity: 26.7% — 10th highest
> Avg. number of unhealthy days per month: 4.7 days — 15th highest
> Adult population: 5,164,798
[recirclink id=935271]

13. Louisiana
> Pct. of adults reporting insufficient sleep: 38.0%
> Pct. of adults reporting excessive drinking: 19.7% — 22nd highest
> Adults reporting no physical activity: 28.0% — 6th highest
> Avg. number of unhealthy days per month: 5.0 days — 5th highest
> Adult population: 3,563,908

12. Georgia
> Pct. of adults reporting insufficient sleep: 38.3%
> Pct. of adults reporting excessive drinking: 16.8% — 9th lowest
> Adults reporting no physical activity: 26.4% — 12th highest
> Avg. number of unhealthy days per month: 4.2 days — 20th highest
> Adult population: 8,114,394
[in-text-ad-2]

11. Virginia
> Pct. of adults reporting insufficient sleep: 38.6%
> Pct. of adults reporting excessive drinking: 17.7% — 17th lowest
> Adults reporting no physical activity: 22.2% — 23rd lowest
> Avg. number of unhealthy days per month: 4.0 days — 24th lowest
> Adult population: 6,677,914

10. Pennsylvania
> Pct. of adults reporting insufficient sleep: 38.6%
> Pct. of adults reporting excessive drinking: 20.2% — 18th highest
> Adults reporting no physical activity: 22.0% — 22nd lowest
> Avg. number of unhealthy days per month: 4.7 days — 14th highest
> Adult population: 10,169,664
[in-text-ad]

9. South Carolina
> Pct. of adults reporting insufficient sleep: 38.8%
> Pct. of adults reporting excessive drinking: 17.8% — 18th lowest
> Adults reporting no physical activity: 26.0% — 14th highest
> Avg. number of unhealthy days per month: 4.7 days — 12th highest
> Adult population: 4,036,414
[recirclink id=920533]

8. New York
> Pct. of adults reporting insufficient sleep: 38.9%
> Pct. of adults reporting excessive drinking: 19.2% — 25th highest
> Adults reporting no physical activity: 23.4% — 19th highest
> Avg. number of unhealthy days per month: 3.6 days — 5th lowest
> Adult population: 15,431,465

7. Alabama
> Pct. of adults reporting insufficient sleep: 39.6%
> Pct. of adults reporting excessive drinking: 14.9% — 4th lowest
> Adults reporting no physical activity: 29.3% — 3rd highest
> Avg. number of unhealthy days per month: 4.9 days — 7th highest
> Adult population: 3,817,588
[in-text-ad-2]

6. Michigan
> Pct. of adults reporting insufficient sleep: 40.4%
> Pct. of adults reporting excessive drinking: 20.9% — 13th highest
> Adults reporting no physical activity: 23.1% — 24th highest
> Avg. number of unhealthy days per month: 4.7 days — 13th highest
> Adult population: 7,844,035

5. Ohio
> Pct. of adults reporting insufficient sleep: 40.6%
> Pct. of adults reporting excessive drinking: 18.5% — 23rd lowest
> Adults reporting no physical activity: 26.1% — 13th highest
> Avg. number of unhealthy days per month: 4.8 days — 11th highest
> Adult population: 9,114,253
[in-text-ad]

4. Tennessee
> Pct. of adults reporting insufficient sleep: 40.8%
> Pct. of adults reporting excessive drinking: 17.1% — 12th lowest
> Adults reporting no physical activity: 27.2% — 9th highest
> Avg. number of unhealthy days per month: 5.2 days — 3rd highest
> Adult population: 5,318,422
[recirclink id=883165]
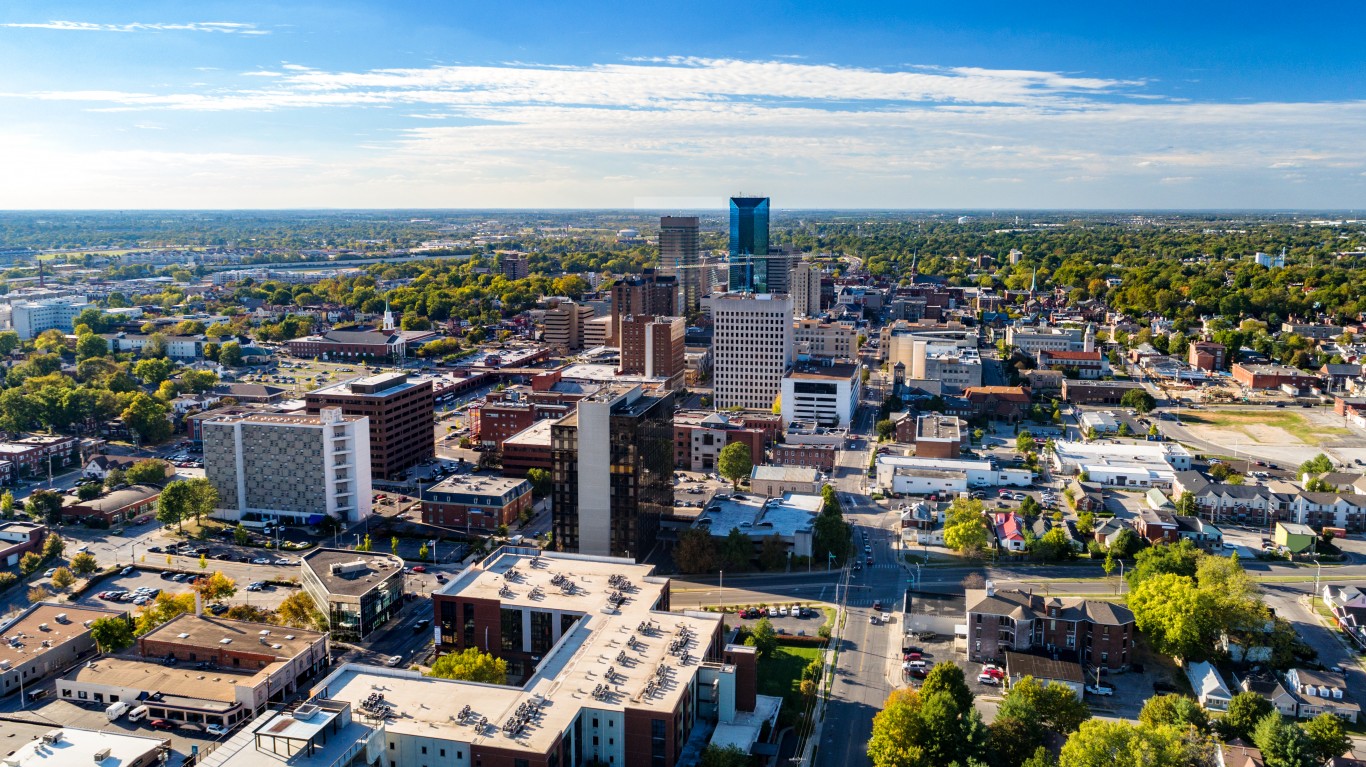
3. Kentucky
> Pct. of adults reporting insufficient sleep: 42.1%
> Pct. of adults reporting excessive drinking: 17.2% — 13th lowest
> Adults reporting no physical activity: 28.7% — 4th highest
> Avg. number of unhealthy days per month: 5.0 days — 4th highest
> Adult population: 3,465,848

2. West Virginia
> Pct. of adults reporting insufficient sleep: 42.5%
> Pct. of adults reporting excessive drinking: 14.4% — 2nd lowest
> Adults reporting no physical activity: 28.0% — 5th highest
> Avg. number of unhealthy days per month: 5.8 days — the highest
> Adult population: 1,433,329
[in-text-ad-2]

1. Hawaii
> Pct. of adults reporting insufficient sleep: 43.2%
> Pct. of adults reporting excessive drinking: 23.0% — 8th highest
> Adults reporting no physical activity: 19.6% — 10th lowest
> Avg. number of unhealthy days per month: 3.4 days — 2nd lowest
> Adult population: 1,115,685
Methodology:
To determine the states getting the most and the least sleep, 24/7 Tempo reviewed the share of adults reporting fewer than seven hours of sleep on average in each state from the Robert Wood Johnson Foundation and the University of Wisconsin Population Health Institute joint program’s 2021 County Health Rankings & Roadmaps report. Insufficient sleep figures published in the report are from 2018.
All other data came from the CHR, and figures are for the most recent year available. Population figures are one-year estimates for the 18 years and over age group from the Census Bureau’s American Community Survey 2019.