The number of unemployed workers in the United States dropped to 6.3 million last month, from 6.5 million in January. The nationwide unemployment rate dropped slightly to 3.8%, according to the Bureau of Labor Statistics.
The positive change in February (243,000 fewer unemployed people) was largely due to jobs added to the economy, as well as in part to workers dropping out of the labor force for various reasons. While these economic indicators are often revised over the course of the year, last month’s improvement follows a relatively long pattern of monthly gains that held true for the nation as well as for most states over the course of 2021.
Following 2020, as states started centering policy priorities away from COVID precautions back towards their economies, unemployment rates fell fairly consistently across the country. This is how many people have died from COVID-19 in each state.
In 2021, the unemployment rate dropped every single month of the year in all but 12 states. The highest unemployment rate of the year was January in every state except Delaware (March and April), Iowa (April, May, June), Maine (April and June), and Maryland (August).
Looking at the year as a whole compared to 2020, the annual unemployment rate decreased in 49 states and the District of Columbia. One state had little change. Seventeen states had rate declines of at least 3.0 percentage points. Here are the states with the largest drops in unemployment between 2020 and last year.
Overall, the unemployment rate was lower than the U.S. figure of 5.3% in 25 states, higher in nine states and the District of Columbia, and not significantly different from the national rate in 16 states.
To identify the states with the highest unemployment last year, 24/7 Wall St. used 2021 annual unemployment rates by state from the Bureau of Labor Statistics. The unemployed population as well as the month with the highest unemployment rate were also obtained using BLS data for 2021. Total population and median household income comes from the 2019 American Community Survey 1-year Estimates. Monthly unemployment rates were seasonally adjusted.
Click here to see the states with the highest annual unemployment.

50. Nebraska
> Annual unemployment rate, 2021: 2.5%
> Average unemployed population, 2021 26,371 — 7th smallest
> Unemployment peak, 2021: January, 2.7%
> Total population, 2019: 1,934,408 — 14th smallest
> Median household income, 2019 $63,229 — 25th highest
[in-text-ad]

49. Utah
> Annual unemployment rate, 2021: 2.7%
> Average unemployed population, 2021 45,344 — 15th smallest
> Unemployment peak, 2021: January, 3.3%
> Total population, 2019: 3,205,958 — 21st smallest
> Median household income, 2019 $75,780 — 11th highest

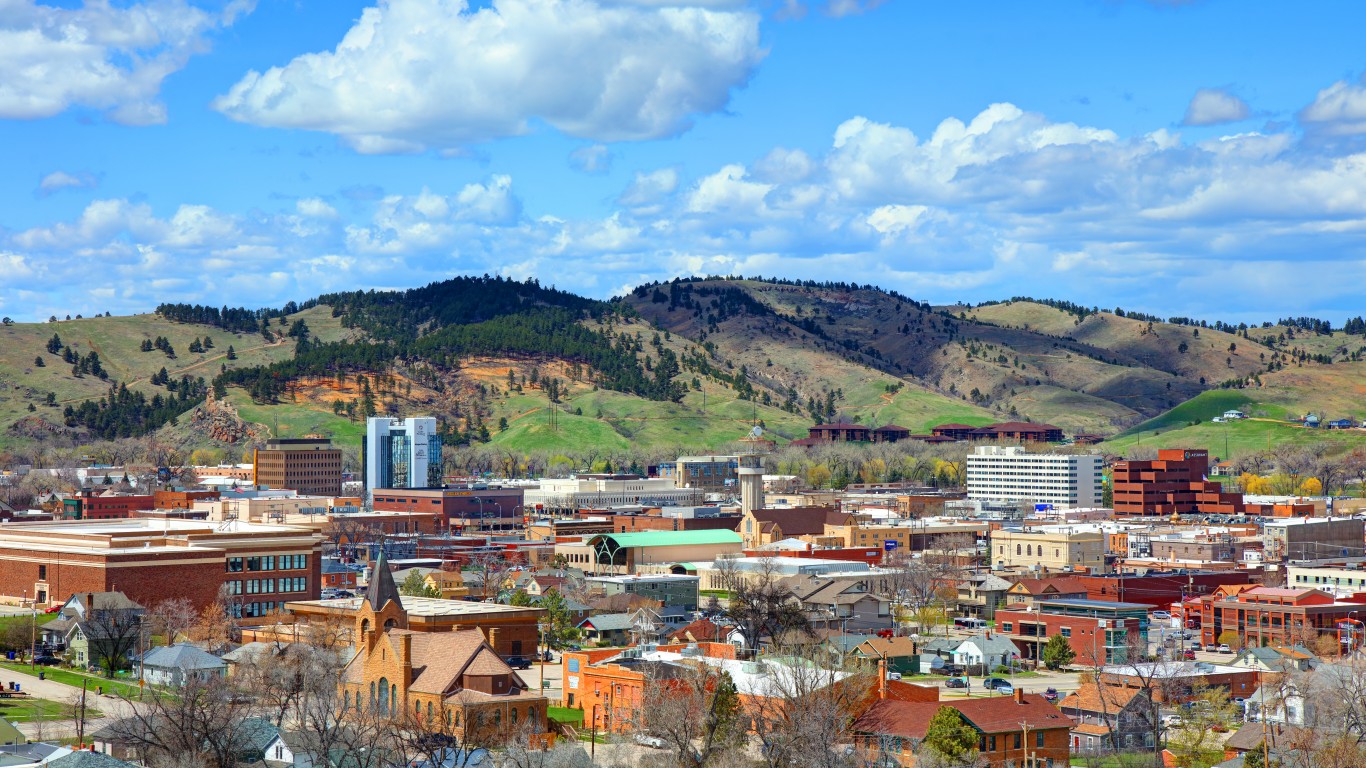
48. South Dakota
> Annual unemployment rate, 2021: 3.1%
> Average unemployed population, 2021 14,504 — 3rd smallest
> Unemployment peak, 2021: January, 3.3%
> Total population, 2019: 884,659 — 5th smallest
> Median household income, 2019 $59,533 — 18th lowest

47. Kansas
> Annual unemployment rate, 2021: 3.2%
> Average unemployed population, 2021 48,342 — 16th smallest
> Unemployment peak, 2021: January, 3.8%
> Total population, 2019: 2,913,314 — 16th smallest
> Median household income, 2019 $62,087 — 24th lowest
[in-text-ad-2]

46. Vermont
> Annual unemployment rate, 2021: 3.4%
> Average unemployed population, 2021 11,275 — the smallest
> Unemployment peak, 2021: January, February – 3.9%
> Total population, 2019: 623,989 — 2nd smallest
> Median household income, 2019 $63,001 — 25th lowest

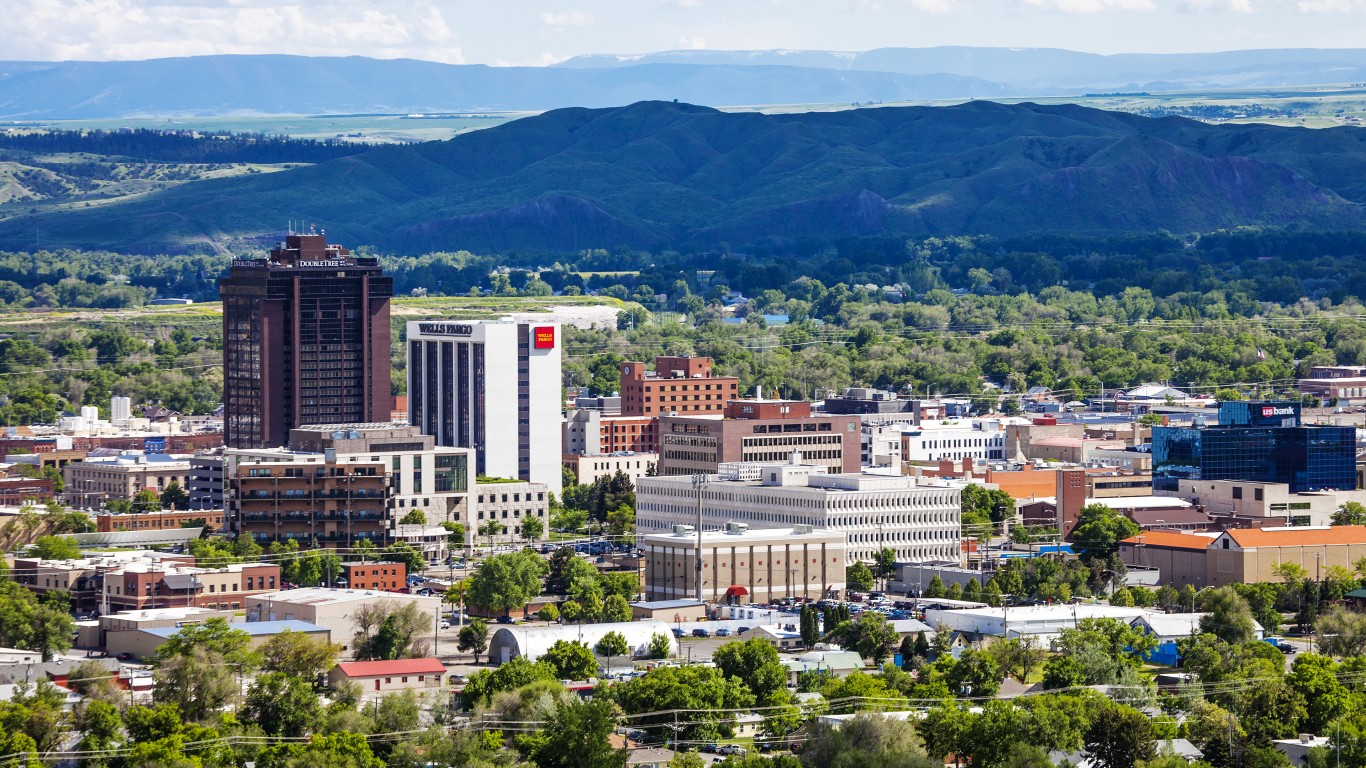
45. Montana
> Annual unemployment rate, 2021: 3.4%
> Average unemployed population, 2021 18,541 — 5th smallest
> Unemployment peak, 2021: January, 3.8%
> Total population, 2019: 1,068,778 — 8th smallest
> Median household income, 2019 $57,153 — 11th lowest
[in-text-ad]

44. Alabama
> Annual unemployment rate, 2021: 3.4%
> Average unemployed population, 2021 77,272 — 22nd smallest
> Unemployment peak, 2021: January, 4.0%
> Total population, 2019: 4,903,185 — 24th largest
> Median household income, 2019 $51,734 — 5th lowest

43. Minnesota
> Annual unemployment rate, 2021: 3.4%
> Average unemployed population, 2021 102,967 — 25th smallest
> Unemployment peak, 2021: January, 4.2%
> Total population, 2019: 5,639,632 — 22nd largest
> Median household income, 2019 $74,593 — 13th highest

42. New Hampshire
> Annual unemployment rate, 2021: 3.5%
> Average unemployed population, 2021 26,482 — 8th smallest
> Unemployment peak, 2021: January, 4.2%
> Total population, 2019: 1,359,711 — 10th smallest
> Median household income, 2019 $77,933 — 8th highest
[in-text-ad-2]

41. Idaho
> Annual unemployment rate, 2021: 3.6%
> Average unemployed population, 2021 32,728 — 12th smallest
> Unemployment peak, 2021: January, 4.0%
> Total population, 2019: 1,787,065 — 12th smallest
> Median household income, 2019 $60,999 — 20th lowest

40. Indiana
> Annual unemployment rate, 2021: 3.6%
> Average unemployed population, 2021 118,382 — 21st largest
> Unemployment peak, 2021: January, 4.5%
> Total population, 2019: 6,732,219 — 17th largest
> Median household income, 2019 $57,603 — 14th lowest
[in-text-ad]

39. North Dakota
> Annual unemployment rate, 2021: 3.7%
> Average unemployed population, 2021 14,932 — 4th smallest
> Unemployment peak, 2021: January, 4.7%
> Total population, 2019: 762,062 — 4th smallest
> Median household income, 2019 $64,577 — 20th highest

38. Oklahoma
> Annual unemployment rate, 2021: 3.8%
> Average unemployed population, 2021 71,154 — 21st smallest
> Unemployment peak, 2021: January, 5.0%
> Total population, 2019: 3,956,971 — 23rd smallest
> Median household income, 2019 $54,449 — 8th lowest

37. Wisconsin
> Annual unemployment rate, 2021: 3.8%
> Average unemployed population, 2021 118,400 — 20th largest
> Unemployment peak, 2021: January, 4.5%
> Total population, 2019: 5,822,434 — 20th largest
> Median household income, 2019 $64,168 — 21st highest
[in-text-ad-2]

36. Virginia
> Annual unemployment rate, 2021: 3.9%
> Average unemployed population, 2021 166,853 — 17th largest
> Unemployment peak, 2021: January, 4.8%
> Total population, 2019: 8,535,519 — 12th largest
> Median household income, 2019 $76,456 — 10th highest

35. Georgia
> Annual unemployment rate, 2021: 3.9%
> Average unemployed population, 2021 203,237 — 13th largest
> Unemployment peak, 2021: January, 4.8%
> Total population, 2019: 10,617,423 — 8th largest
> Median household income, 2019 $61,980 — 22nd lowest
[in-text-ad]

34. Arkansas
> Annual unemployment rate, 2021: 4.0%
> Average unemployed population, 2021 53,636 — 17th smallest
> Unemployment peak, 2021: January, 4.9%
> Total population, 2019: 3,017,804 — 18th smallest
> Median household income, 2019 $48,952 — 3rd lowest

33. South Carolina
> Annual unemployment rate, 2021: 4.0%
> Average unemployed population, 2021 94,553 — 23rd smallest
> Unemployment peak, 2021: January, 4.6%
> Total population, 2019: 5,148,714 — 23rd largest
> Median household income, 2019 $56,227 — 10th lowest

32. Iowa
> Annual unemployment rate, 2021: 4.2%
> Average unemployed population, 2021 70,869 — 20th smallest
> Unemployment peak, 2021: April, May, June – 4.5%
> Total population, 2019: 3,155,070 — 20th smallest
> Median household income, 2019 $61,691 — 21st lowest
[in-text-ad-2]

31. Tennessee
> Annual unemployment rate, 2021: 4.3%
> Average unemployed population, 2021 142,703 — 18th largest
> Unemployment peak, 2021: January, 5.2%
> Total population, 2019: 6,829,174 — 16th largest
> Median household income, 2019 $56,071 — 9th lowest

30. Missouri
> Annual unemployment rate, 2021: 4.4%
> Average unemployed population, 2021 134,081 — 19th largest
> Unemployment peak, 2021: January, 5.0%
> Total population, 2019: 6,137,428 — 18th largest
> Median household income, 2019 $57,409 — 13th lowest
[in-text-ad]

29. Wyoming
> Annual unemployment rate, 2021: 4.5%
> Average unemployed population, 2021 13,032 — 2nd smallest
> Unemployment peak, 2021: January, 5.1%
> Total population, 2019: 578,759 — the smallest
> Median household income, 2019 $65,003 — 19th highest

28. Maine
> Annual unemployment rate, 2021: 4.6%
> Average unemployed population, 2021 31,550 — 10th smallest
> Unemployment peak, 2021: April, 5.0%
> Total population, 2019: 1,344,212 — 9th smallest
> Median household income, 2019 $58,924 — 16th lowest

27. Florida
> Annual unemployment rate, 2021: 4.6%
> Average unemployed population, 2021 469,711 — 4th largest
> Unemployment peak, 2021: January, 6.0%
> Total population, 2019: 21,477,737 — 3rd largest
> Median household income, 2019 $59,227 — 17th lowest
[in-text-ad-2]

26. Kentucky
> Annual unemployment rate, 2021: 4.7%
> Average unemployed population, 2021 95,205 — 24th smallest
> Unemployment peak, 2021: January, June, July, August – 4.8%
> Total population, 2019: 4,467,673 — 25th smallest
> Median household income, 2019 $52,295 — 7th lowest

25. North Carolina
> Annual unemployment rate, 2021: 4.8%
> Average unemployed population, 2021 238,474 — 10th largest
> Unemployment peak, 2021: January, 5.5%
> Total population, 2019: 10,488,084 — 9th largest
> Median household income, 2019 $57,341 — 12th lowest
[in-text-ad]

24. Arizona
> Annual unemployment rate, 2021: 4.9%
> Average unemployed population, 2021 172,106 — 15th largest
> Unemployment peak, 2021: January, 6.1%
> Total population, 2019: 7,278,717 — 14th largest
> Median household income, 2019 $62,055 — 23rd lowest

23. West Virginia
> Annual unemployment rate, 2021: 5.0%
> Average unemployed population, 2021 39,694 — 14th smallest
> Unemployment peak, 2021: January, 5.9%
> Total population, 2019: 1,792,147 — 13th smallest
> Median household income, 2019 $48,850 — 2nd lowest

22. Ohio
> Annual unemployment rate, 2021: 5.1%
> Average unemployed population, 2021 295,003 — 8th largest
> Unemployment peak, 2021: January, 6.0%
> Total population, 2019: 11,689,100 — 7th largest
> Median household income, 2019 $58,642 — 15th lowest
[in-text-ad-2]

21. Oregon
> Annual unemployment rate, 2021: 5.2%
> Average unemployed population, 2021 112,195 — 24th largest
> Unemployment peak, 2021: January, 6.4%
> Total population, 2019: 4,217,737 — 24th smallest
> Median household income, 2019 $67,058 — 18th highest

20. Washington
> Annual unemployment rate, 2021: 5.2%
> Average unemployed population, 2021 204,775 — 12th largest
> Unemployment peak, 2021: January, 6.3%
> Total population, 2019: 7,614,893 — 13th largest
> Median household income, 2019 $78,687 — 7th highest
[in-text-ad]

19. Delaware
> Annual unemployment rate, 2021: 5.3%
> Average unemployed population, 2021 26,555 — 9th smallest
> Unemployment peak, 2021: March, April – 5.8%
> Total population, 2019: 973,764 — 6th smallest
> Median household income, 2019 $70,176 — 16th highest

18. Colorado
> Annual unemployment rate, 2021: 5.4%
> Average unemployed population, 2021 169,399 — 16th largest
> Unemployment peak, 2021: January, 6.2%
> Total population, 2019: 5,758,736 — 21st largest
> Median household income, 2019 $77,127 — 9th highest

17. Louisiana
> Annual unemployment rate, 2021: 5.5%
> Average unemployed population, 2021 113,089 — 23rd largest
> Unemployment peak, 2021: January, 6.5%
> Total population, 2019: 4,648,794 — 25th largest
> Median household income, 2019 $51,073 — 4th lowest
[in-text-ad-2]

16. Rhode Island
> Annual unemployment rate, 2021: 5.6%
> Average unemployed population, 2021 32,065 — 11th smallest
> Unemployment peak, 2021: January, 6.3%
> Total population, 2019: 1,059,361 — 7th smallest
> Median household income, 2019 $71,169 — 15th highest

15. Mississippi
> Annual unemployment rate, 2021: 5.6%
> Average unemployed population, 2021 69,838 — 19th smallest
> Unemployment peak, 2021: January, 6.6%
> Total population, 2019: 2,976,149 — 17th smallest
> Median household income, 2019 $45,792 — the lowest
[in-text-ad]

14. Hawaii
> Annual unemployment rate, 2021: 5.7%
> Average unemployed population, 2021 38,226 — 13th smallest
> Unemployment peak, 2021: January, 8.3%
> Total population, 2019: 1,415,872 — 11th smallest
> Median household income, 2019 $83,102 — 4th highest

13. Massachusetts
> Annual unemployment rate, 2021: 5.7%
> Average unemployed population, 2021 215,392 — 11th largest
> Unemployment peak, 2021: January, 7.1%
> Total population, 2019: 6,892,503 — 15th largest
> Median household income, 2019 $85,843 — 2nd highest

12. Texas
> Annual unemployment rate, 2021: 5.7%
> Average unemployed population, 2021 807,410 — 2nd largest
> Unemployment peak, 2021: January, 6.7%
> Total population, 2019: 28,995,881 — 2nd largest
> Median household income, 2019 $64,034 — 22nd highest
[in-text-ad-2]

11. Maryland
> Annual unemployment rate, 2021: 5.8%
> Average unemployed population, 2021 183,322 — 14th largest
> Unemployment peak, 2021: August, 6.2%
> Total population, 2019: 6,045,680 — 19th largest
> Median household income, 2019 $86,738 — the highest

10. Michigan
> Annual unemployment rate, 2021: 5.9%
> Average unemployed population, 2021 280,459 — 9th largest
> Unemployment peak, 2021: January, 6.4%
> Total population, 2019: 9,986,857 — 10th largest
> Median household income, 2019 $59,584 — 19th lowest
[in-text-ad]

9. Illinois
> Annual unemployment rate, 2021: 6.1%
> Average unemployed population, 2021 382,941 — 6th largest
> Unemployment peak, 2021: January, 7.1%
> Total population, 2019: 12,671,821 — 6th largest
> Median household income, 2019 $69,187 — 17th highest

8. Connecticut
> Annual unemployment rate, 2021: 6.3%
> Average unemployed population, 2021 116,108 — 22nd largest
> Unemployment peak, 2021: January, 7.3%
> Total population, 2019: 3,565,287 — 22nd smallest
> Median household income, 2019 $78,833 — 6th highest

7. New Jersey
> Annual unemployment rate, 2021: 6.3%
> Average unemployed population, 2021 295,690 — 7th largest
> Unemployment peak, 2021: January, 7.3%
> Total population, 2019: 8,882,190 — 11th largest
> Median household income, 2019 $85,751 — 3rd highest
[in-text-ad-2]

6. Pennsylvania
> Annual unemployment rate, 2021: 6.3%
> Average unemployed population, 2021 406,743 — 5th largest
> Unemployment peak, 2021: January, 7.5%
> Total population, 2019: 12,801,989 — 5th largest
> Median household income, 2019 $63,463 — 23rd highest

5. Alaska
> Annual unemployment rate, 2021: 6.4%
> Average unemployed population, 2021 22,670 — 6th smallest
> Unemployment peak, 2021: January, 7.1%
> Total population, 2019: 731,545 — 3rd smallest
> Median household income, 2019 $75,463 — 12th highest
[in-text-ad]

4. New Mexico
> Annual unemployment rate, 2021: 6.8%
> Average unemployed population, 2021 64,027 — 18th smallest
> Unemployment peak, 2021: January, 7.4%
> Total population, 2019: 2,096,829 — 15th smallest
> Median household income, 2019 $51,945 — 6th lowest

3. New York
> Annual unemployment rate, 2021: 6.9%
> Average unemployed population, 2021 655,178 — 3rd largest
> Unemployment peak, 2021: January, 8.6%
> Total population, 2019: 19,453,561 — 4th largest
> Median household income, 2019 $72,108 — 14th highest

2. Nevada
> Annual unemployment rate, 2021: 7.2%
> Average unemployed population, 2021 108,822 — 25th largest
> Unemployment peak, 2021: January, 10.2%
> Total population, 2019: 3,080,156 — 19th smallest
> Median household income, 2019 $63,276 — 24th highest
[in-text-ad-2]

1. California
> Annual unemployment rate, 2021: 7.3%
> Average unemployed population, 2021 1,381,250 — the largest
> Unemployment peak, 2021: January, 8.8%
> Total population, 2019: 39,512,223 — the largest
> Median household income, 2019 $80,440 — 5th highest
Take Charge of Your Retirement In Just A Few Minutes (Sponsor)
Retirement planning doesn’t have to feel overwhelming. The key is finding expert guidance—and SmartAsset’s simple quiz makes it easier than ever for you to connect with a vetted financial advisor.
Here’s how it works:
- Answer a Few Simple Questions. Tell us a bit about your goals and preferences—it only takes a few minutes!
- Get Matched with Vetted Advisors Our smart tool matches you with up to three pre-screened, vetted advisors who serve your area and are held to a fiduciary standard to act in your best interests. Click here to begin
- Choose Your Fit Review their profiles, schedule an introductory call (or meet in person), and select the advisor who feel is right for you.
Why wait? Start building the retirement you’ve always dreamed of. Click here to get started today!
Thank you for reading! Have some feedback for us?
Contact the 24/7 Wall St. editorial team.
 24/7 Wall St.
 24/7 Wall St.
 24/7 Wall St.
 24/7 Wall St.


