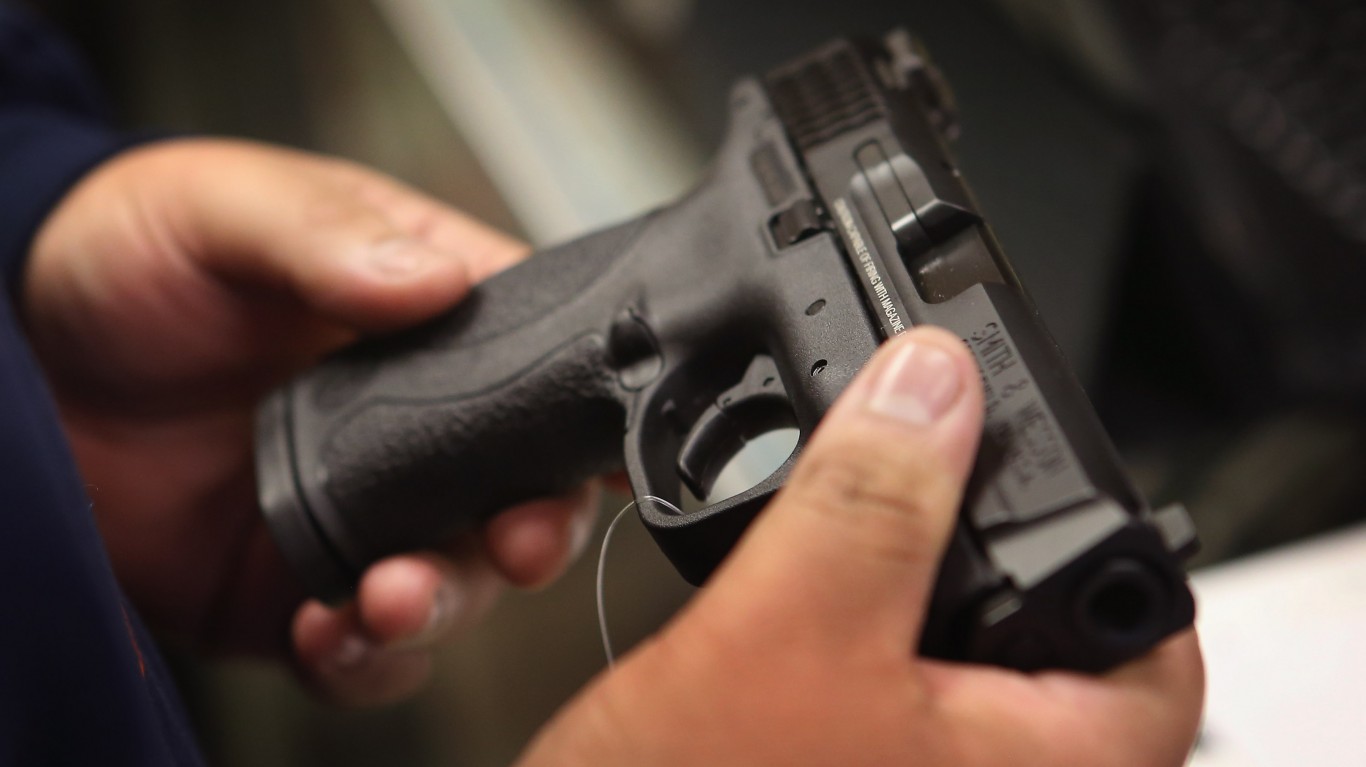
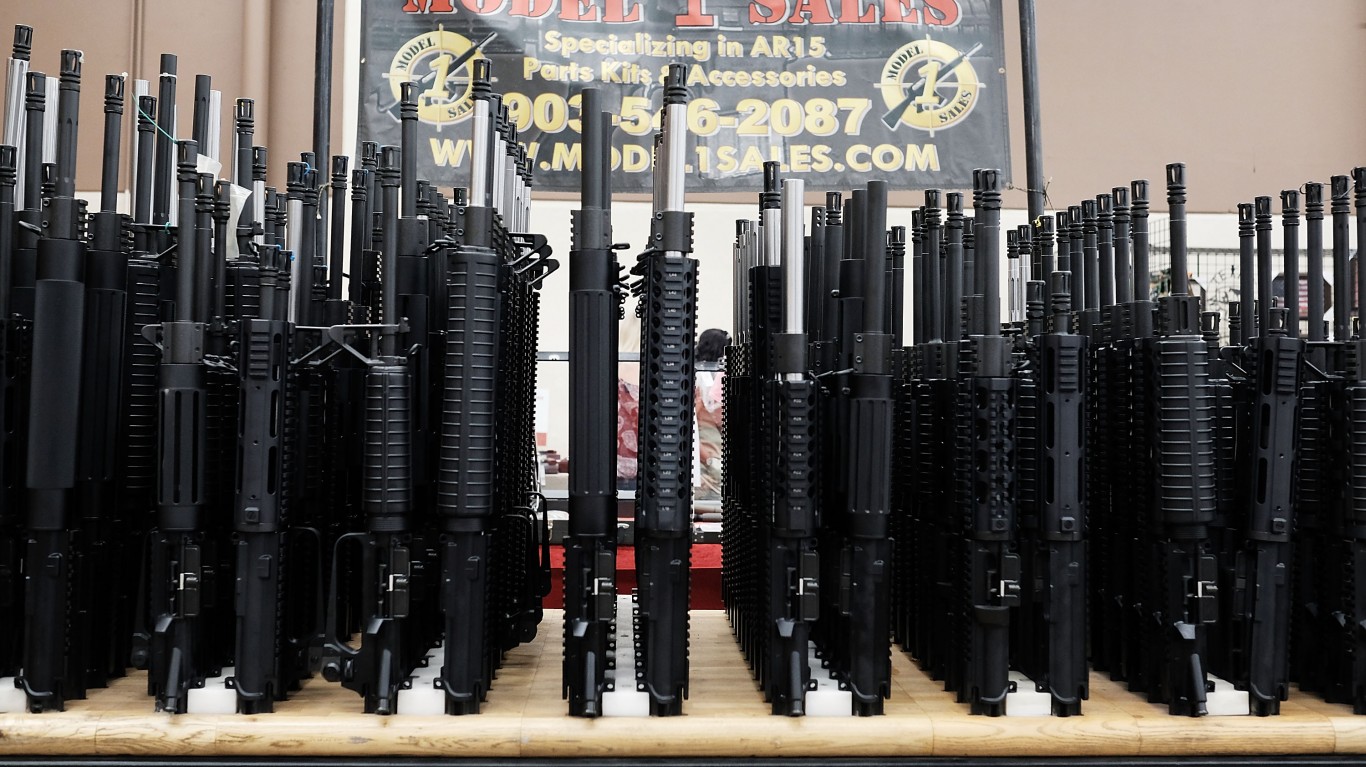
The trend in gun sales changed last year compared to most other years in the past decade. Gun sales, using the FBI’s firearms background check as a proxy, reached 38,876,673 in 2021. This was down slightly from the record set in 2020 of 39,695,315.
There are several theories explaining the fast pace of gun sales over the past 24 months. Among them is that violence in American cities during protests, which occurred over a year ago, caused purchases to spike. Another is that the pandemic has, perhaps irrationally, increased concerns about protecting one’s property. The 2022 numbers show that some of these trends may have started to taper off.
Despite the recent sales decline, gun violence continues to be a regular part of the news headlines this year. Murders in American cities spiked last year, particularly in large cities. So far in 2022, the trend has continued. The Wall Street Journal recently reported on a surge in gun violence in Seattle, which is generally considered a relatively safe city. In the past few days, there has been more violence, including an incident in Sacramento in which shooters killed six people and injured another 12. (These are the cities where murder rate is soaring.)
According to the Gun Violence Archive, there already have been 10,807 gun deaths in America as of April 3. Even with stricter gun ownership and purchasing laws, the difficult fact is that private citizens, the police, and the military currently own about 400 million guns. The chance that civilians who own guns will turn them into the government, no matter the incentive, is small.
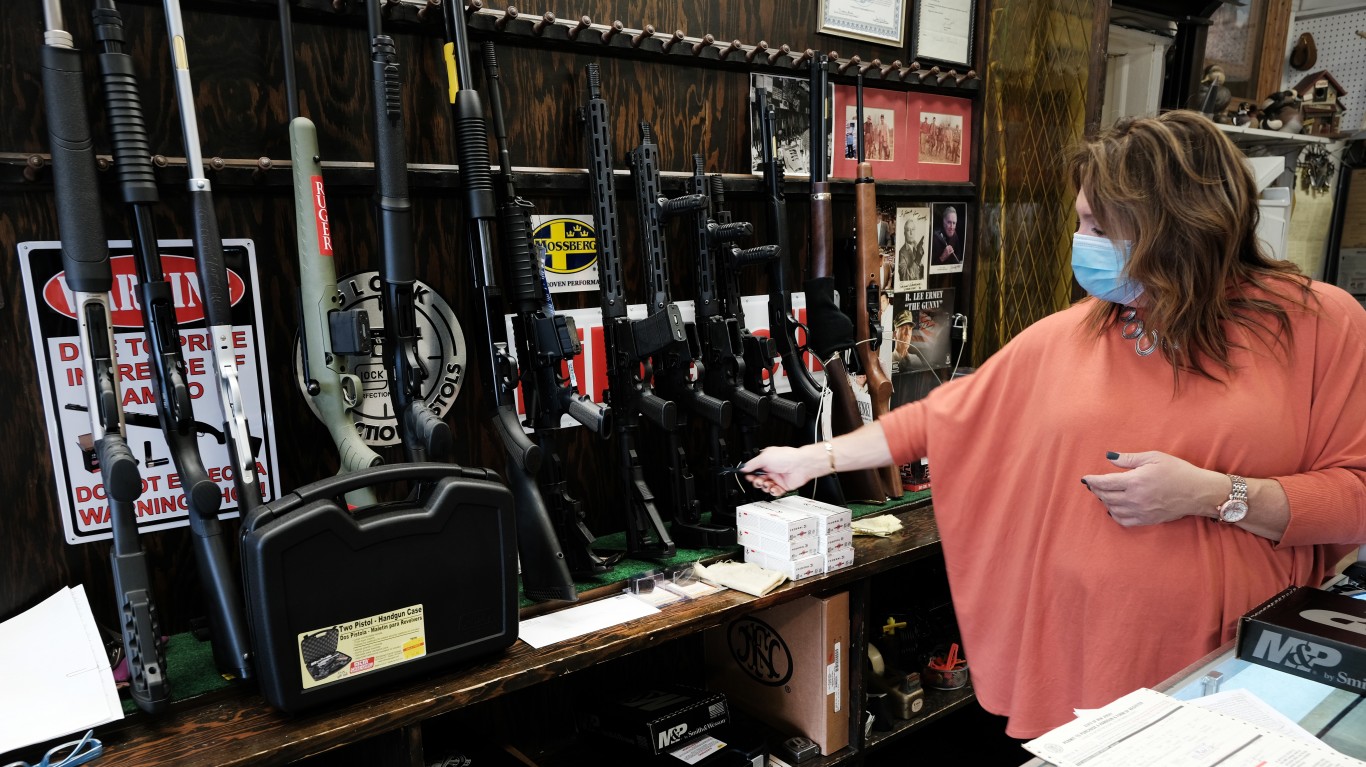
One fact about who made gun purchases from 2019 through 2021 stands out. According to The Economist, “Of the 7.5m Americans who bought firearms for the first time between January 2019 and April 2021 – as gun-buying surged nationwide – half were female, a fifth black and a fifth Hispanic, according to a recent study by Matthew Miller of Northeastern University and his co-authors.”
Inexplicably, gun sales collapsed in the first three months of this year, compared to the same period in 2021.
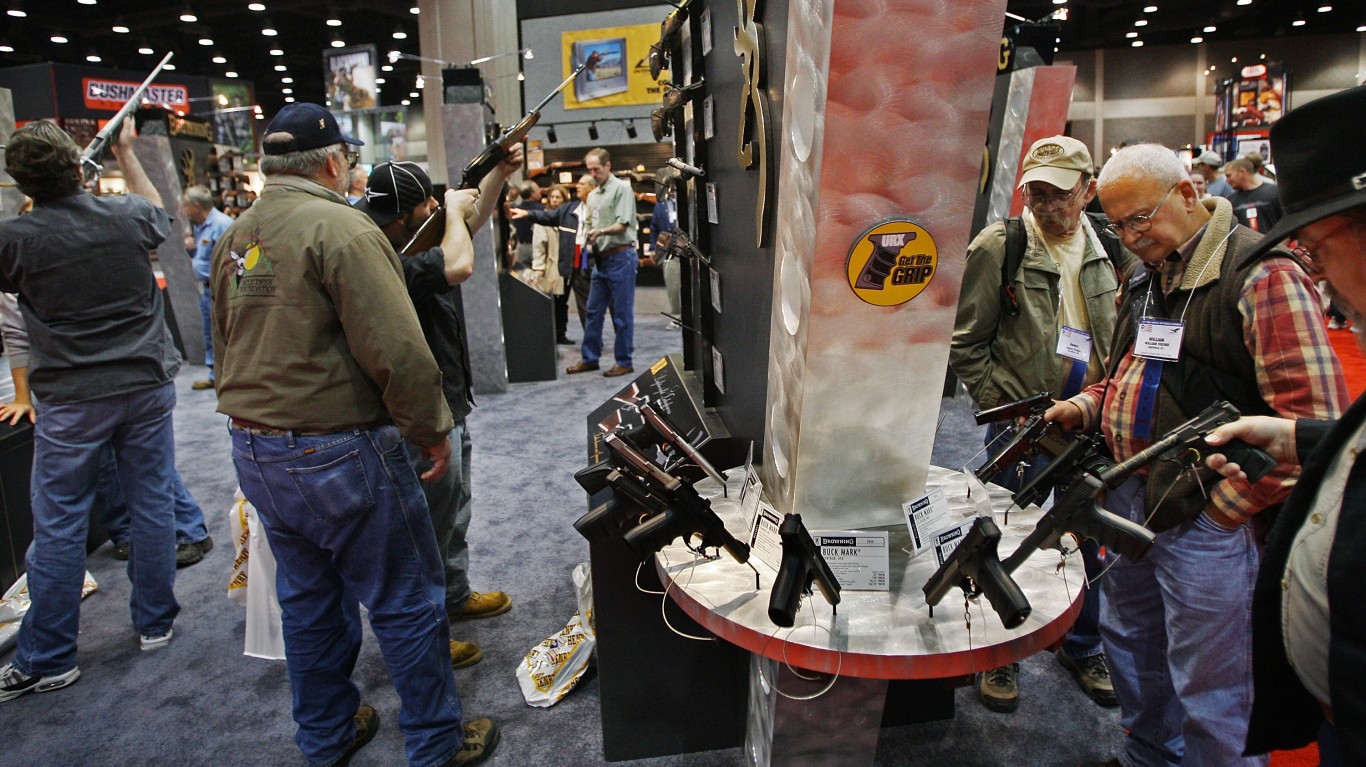
To determine how many guns people bought in each state so far this year, 24/7 Wall St. reviewed data on background checks data from Jan. 1, 2022, to March 31, 2022, from the FBI’s National Instant Criminal Background Check System Firearm Checks. We used the background checks as a proxy for year-to-date gun sales as the vast majority of background checks are approved. (Population data used to calculate gun sales per capita came from the U.S. Census Bureau.)
So far this year, the FBI conducted 8,228,224 background checks, compared to last year’s 12,452,319 background checks. That means the 2022 number from January through March was only 70% of the number during the same period in 2021. The total remained high in some states. They were particularly large in Illinois at 1,167,252 during the first three months of 2022 and 1,071,206 in Kentucky. (Historically, this is the year Americans bought the most guns.)
Here are the gun sales figures for the first three months of 2022 for all 50 states

Alabama
> Estimated gun sales YTD: 208,356
> Gun sales per capita: 42.6 per 1,000
> Total population: 4.9 million
[in-text-ad]

Alaska
> Estimated gun sales YTD: 18,688
> Gun sales per capita: 25.4 per 1,000
> Total population: 736,990
[recirclink id=1075236]

Arizona
> Estimated gun sales YTD: 122,478
> Gun sales per capita: 17.1 per 1,000
> Total population: 7.2 million

Arkansas
> Estimated gun sales YTD: 60,901
> Gun sales per capita: 20.2 per 1,000
> Total population: 3.0 million
[in-text-ad-2]

California
> Estimated gun sales YTD: 339,968
> Gun sales per capita: 8.6 per 1,000
> Total population: 39.3 million

Colorado
> Estimated gun sales YTD: 136,575
> Gun sales per capita: 24.0 per 1,000
> Total population: 5.7 million
[in-text-ad]

Connecticut
> Estimated gun sales YTD: 66,315
> Gun sales per capita: 18.6 per 1,000
> Total population: 3.6 million
[recirclink id=1081968]

Delaware
> Estimated gun sales YTD: 15,512
> Gun sales per capita: 16.0 per 1,000
> Total population: 967,679

Florida
> Estimated gun sales YTD: 375,447
> Gun sales per capita: 17.7 per 1,000
> Total population: 21.2 million
[in-text-ad-2]

Georgia
> Estimated gun sales YTD: 165,969
> Gun sales per capita: 15.8 per 1,000
> Total population: 10.5 million

Hawaii
> Estimated gun sales YTD: 4,470
> Gun sales per capita: 3.1 per 1,000
> Total population: 1.4 million
[in-text-ad]

Idaho
> Estimated gun sales YTD: 60,369
> Gun sales per capita: 34.4 per 1,000
> Total population: 1.8 million
[recirclink id=1072168]

Illinois
> Estimated gun sales YTD: 1,167,252
> Gun sales per capita: 91.8 per 1,000
> Total population: 12.7 million

Indiana
> Estimated gun sales YTD: 353,020
> Gun sales per capita: 52.7 per 1,000
> Total population: 6.7 million
[in-text-ad-2]

Iowa
> Estimated gun sales YTD: 76,302
> Gun sales per capita: 24.2 per 1,000
> Total population: 3.2 million

Kansas
> Estimated gun sales YTD: 51,059
> Gun sales per capita: 17.5 per 1,000
> Total population: 2.9 million
[in-text-ad]

Kentucky
> Estimated gun sales YTD: 1,071,206
> Gun sales per capita: 240.1 per 1,000
> Total population: 4.5 million
[recirclink id=1066816]

Louisiana
> Estimated gun sales YTD: 94,927
> Gun sales per capita: 20.4 per 1,000
> Total population: 4.7 million

Maine
> Estimated gun sales YTD: 27,189
> Gun sales per capita: 20.3 per 1,000
> Total population: 1.3 million
[in-text-ad-2]

Maryland
> Estimated gun sales YTD: 58,343
> Gun sales per capita: 9.7 per 1,000
> Total population: 6.0 million

Massachusetts
> Estimated gun sales YTD: 59,141
> Gun sales per capita: 8.6 per 1,000
> Total population: 6.9 million
[in-text-ad]

Michigan
> Estimated gun sales YTD: 208,988
> Gun sales per capita: 21.0 per 1,000
> Total population: 10.0 million
[recirclink id=1081968]

Minnesota
> Estimated gun sales YTD: 231,172
> Gun sales per capita: 41.3 per 1,000
> Total population: 5.6 million

Mississippi
> Estimated gun sales YTD: 75,215
> Gun sales per capita: 25.2 per 1,000
> Total population: 3.0 million
[in-text-ad-2]

Missouri
> Estimated gun sales YTD: 139,563
> Gun sales per capita: 22.8 per 1,000
> Total population: 6.1 million

Montana
> Estimated gun sales YTD: 34,151
> Gun sales per capita: 32.2 per 1,000
> Total population: 1.1 million
[in-text-ad]

Nebraska
> Estimated gun sales YTD: 20,681
> Gun sales per capita: 10.7 per 1,000
> Total population: 1.9 million
[recirclink id=1075236]

Nevada
> Estimated gun sales YTD: 40,866
> Gun sales per capita: 13.5 per 1,000
> Total population: 3.0 million

New Hampshire
> Estimated gun sales YTD: 33,164
> Gun sales per capita: 24.5 per 1,000
> Total population: 1.4 million
[in-text-ad-2]

New Jersey
> Estimated gun sales YTD: 42,926
> Gun sales per capita: 4.8 per 1,000
> Total population: 8.9 million

New Mexico
> Estimated gun sales YTD: 45,241
> Gun sales per capita: 21.6 per 1,000
> Total population: 2.1 million
[in-text-ad]

New York
> Estimated gun sales YTD: 104,917
> Gun sales per capita: 5.4 per 1,000
> Total population: 19.5 million
[recirclink id=1081968]

North Carolina
> Estimated gun sales YTD: 174,330
> Gun sales per capita: 16.8 per 1,000
> Total population: 10.4 million

North Dakota
> Estimated gun sales YTD: 18,425
> Gun sales per capita: 24.2 per 1,000
> Total population: 760,394
[in-text-ad-2]

Ohio
> Estimated gun sales YTD: 180,021
> Gun sales per capita: 15.4 per 1,000
> Total population: 11.7 million

Oklahoma
> Estimated gun sales YTD: 93,749
> Gun sales per capita: 23.7 per 1,000
> Total population: 3.9 million
[in-text-ad]

Oregon
> Estimated gun sales YTD: 101,746
> Gun sales per capita: 24.4 per 1,000
> Total population: 4.2 million
[recirclink id=1072168]

Pennsylvania
> Estimated gun sales YTD: 322,811
> Gun sales per capita: 25.2 per 1,000
> Total population: 12.8 million

Rhode Island
> Estimated gun sales YTD: 7,732
> Gun sales per capita: 7.3 per 1,000
> Total population: 1.1 million
[in-text-ad-2]
South Carolina
> Estimated gun sales YTD: 110,460
> Gun sales per capita: 21.7 per 1,000
> Total population: 5.1 million

South Dakota
> Estimated gun sales YTD: 22,761
> Gun sales per capita: 25.9 per 1,000
> Total population: 879,336
[in-text-ad]

Tennessee
> Estimated gun sales YTD: 224,092
> Gun sales per capita: 33.1 per 1,000
> Total population: 6.8 million
[recirclink id=1066816]

Texas
> Estimated gun sales YTD: 438,049
> Gun sales per capita: 15.3 per 1,000
> Total population: 28.6 million

Utah
> Estimated gun sales YTD: 249,043
> Gun sales per capita: 79.0 per 1,000
> Total population: 3.2 million
[in-text-ad-2]

Vermont
> Estimated gun sales YTD: 11,778
> Gun sales per capita: 18.9 per 1,000
> Total population: 624,340

Virginia
> Estimated gun sales YTD: 145,200
> Gun sales per capita: 17.1 per 1,000
> Total population: 8.5 million
[in-text-ad]

Washington
> Estimated gun sales YTD: 188,012
> Gun sales per capita: 25.0 per 1,000
> Total population: 7.5 million
[recirclink id=487572]

West Virginia
> Estimated gun sales YTD: 49,719
> Gun sales per capita: 27.5 per 1,000
> Total population: 1.8 million

Wisconsin
> Estimated gun sales YTD: 171,006
> Gun sales per capita: 29.4 per 1,000
> Total population: 5.8 million
[in-text-ad-2]

Wyoming
> Estimated gun sales YTD: 17,564
> Gun sales per capita: 30.2 per 1,000
> Total population: 581,348