The share of Americans working from home skyrocketed during the pandemic. A recent Gallup study found that 45% of full-time workers in the United States – and two-thirds of white-collar workers – were doing their job remotely at least some of the time.
The shift is proving to be a positive development for millions of Americans. Gallup reports that over 90% of remote workers hope that the trend continues after the pandemic, citing the lack of commute time as the chief benefit. (Here is a look at the state where the most people are working from home.)
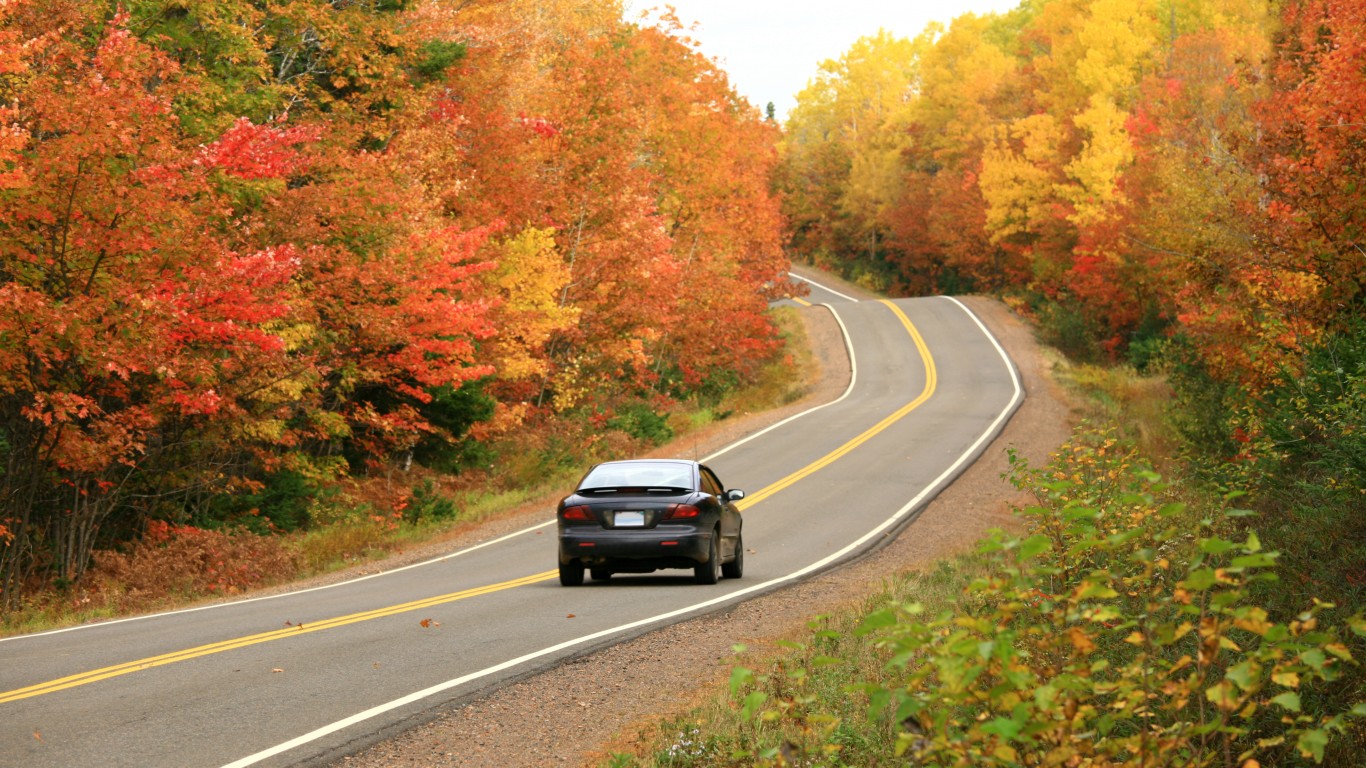
According to the U.S. Census Bureau, the average commute time in the United States is 26.9 minutes. For those who have shifted to full-time remote work, this translates to about 4.5 hours per week, or nearly 10 days a year, of time that they did not have before.
Of course, commute times vary from person to person, but in some parts of the country, workers are far more likely to have longer commutes than in others. Using census data, 24/7 Wall St. identified the 50 U.S. counties and county equivalents with the longest commutes.
Among the counties on this list, average commute times range from about 38 minutes up to 51 minutes. Over the course of a week, these commute times add up, from over six hours up to eight and a half – and in most cases, more than two weeks over the course of a year for those who commute every Monday through Friday.
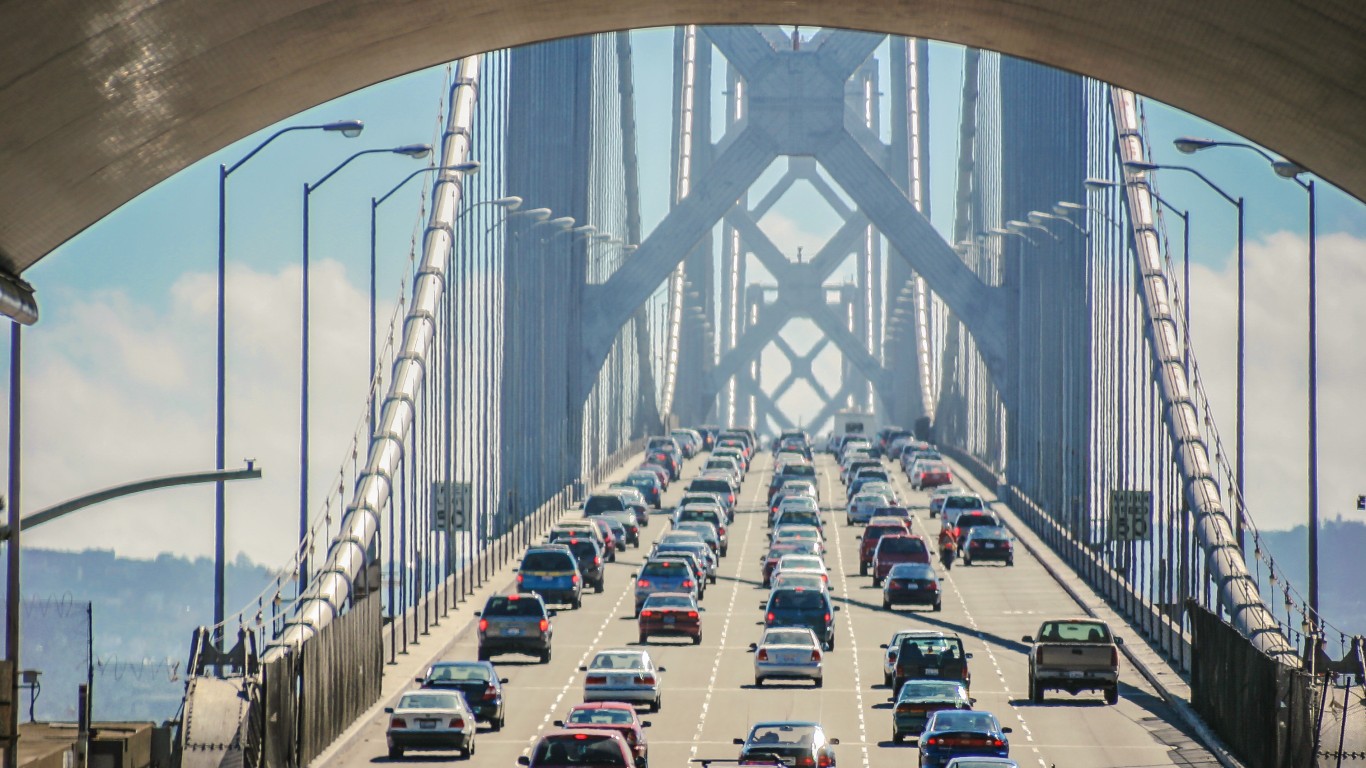
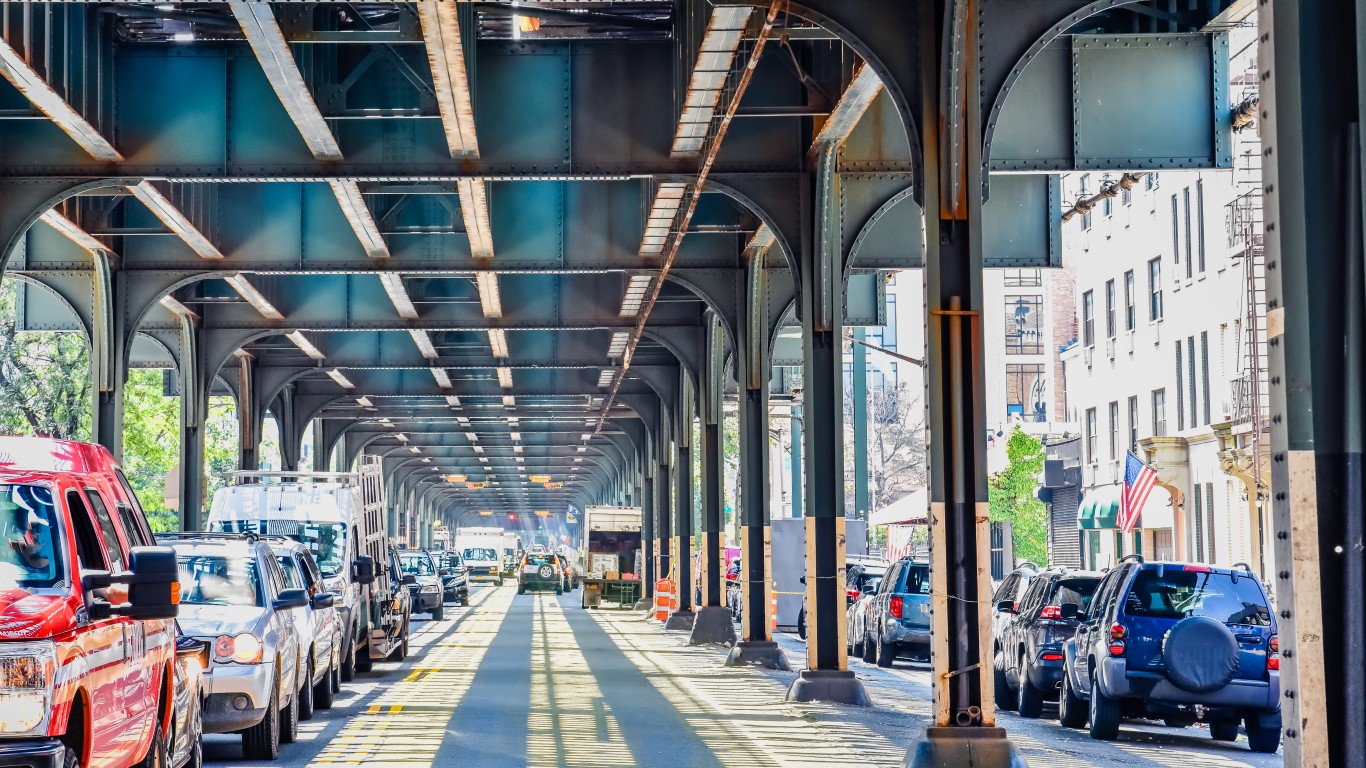
All four counties that make up the outer boroughs of New York City – Bronx, Kings, Queens, and Richmond Counties – rank among this list, likely in part because of the large share of commuters in these areas who rely on the city’s bus and subway systems. Public transportation is less direct than simply driving from door to door, which can add to commute times.
In contrast to the urban and suburban counties, including those in New York City, several counties on this list are relatively isolated, located well beyond the outskirts of the nearest major city. In many of these places, the share of commuters driving themselves to work far exceeds the 74.9% national average. Here is a look at the cities where people lose the most time driving each year.
Click here to see counties where it takes the longest to get to work
Click here to see our detailed methodology

50. Leslie County, Kentucky
> Avg. commute time (minutes): 38.1
> Share of commuters driving alone: 85.8% – 326th highest of 2,997 counties
> Share of commuters carpooling: 11.5% – 592nd highest of 2,997 counties
> Share of commuters using public transit: 0.0% reported – the lowest of 2,997 counties (tied)
[in-text-ad]

49. Spotsylvania County, Virginia
> Avg. commute time (minutes): 38.2
> Share of commuters driving alone: 76.6% – 637th lowest of 2,997 counties
> Share of commuters carpooling: 11.5% – 582nd highest of 2,997 counties
> Share of commuters using public transit: 2.5% – 185th highest of 2,997 counties

48. Mathews County, Virginia
> Avg. commute time (minutes): 38.2
> Share of commuters driving alone: 77.8% – 834th lowest of 2,997 counties
> Share of commuters carpooling: 10.7% – 812th highest of 2,997 counties
> Share of commuters using public transit: 1.4% – 356th highest of 2,997 counties

47. Amelia County, Virginia
> Avg. commute time (minutes): 38.3
> Share of commuters driving alone: 87.5% – 135th highest of 2,997 counties
> Share of commuters carpooling: 4.6% – 54th lowest of 2,997 counties
> Share of commuters using public transit: 0.6% – 920th highest of 2,997 counties
[in-text-ad-2]

46. Buckingham County, Virginia
> Avg. commute time (minutes): 38.4
> Share of commuters driving alone: 82.5% – 1,034th highest of 2,997 counties
> Share of commuters carpooling: 8.4% – 1,134th lowest of 2,997 counties
> Share of commuters using public transit: 0.7% – 708th highest of 2,997 counties

45. Gilpin County, Colorado
> Avg. commute time (minutes): 38.4
> Share of commuters driving alone: 73.1% – 321st lowest of 2,997 counties
> Share of commuters carpooling: 9.3% – 1,428th highest of 2,997 counties
> Share of commuters using public transit: 0.7% – 769th highest of 2,997 counties
[in-text-ad]
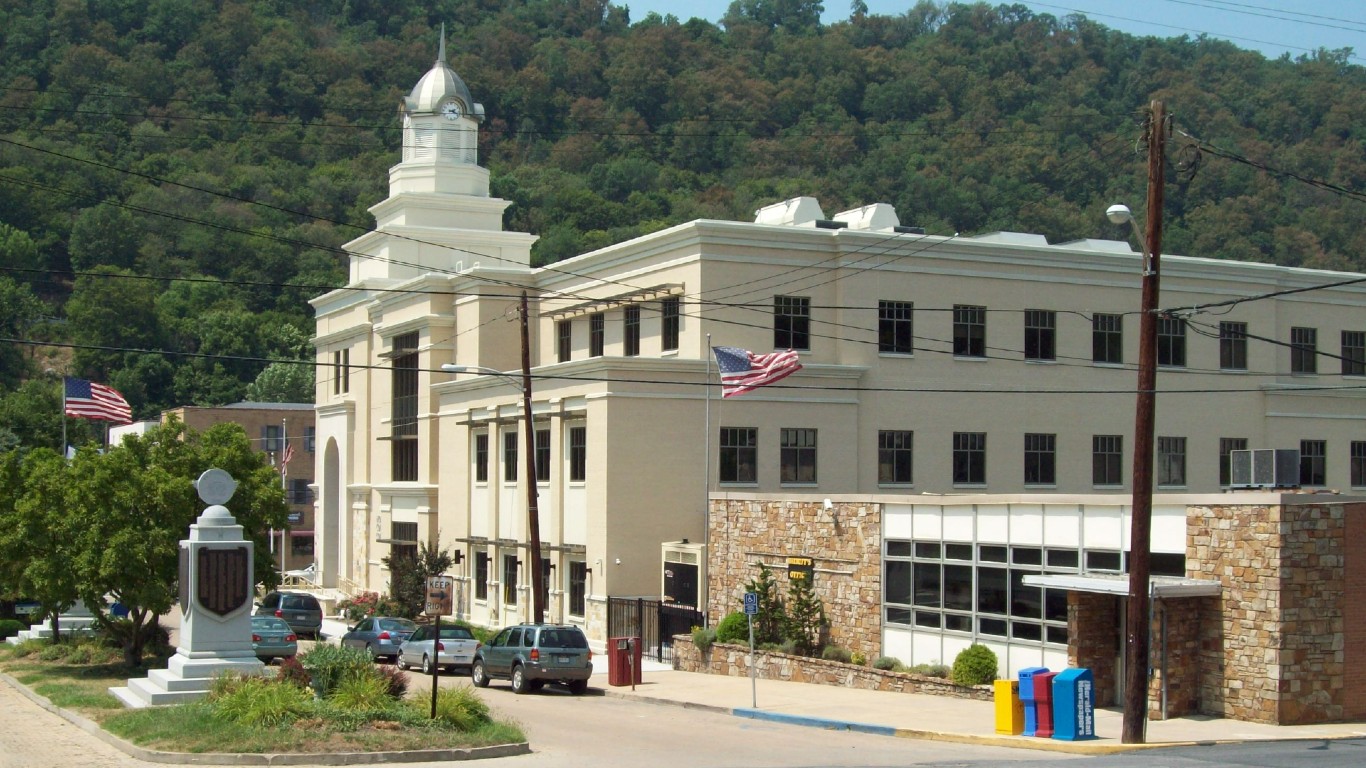
 Courthou... by Taber Andrew Bain")
44. Hampshire County, West Virginia
> Avg. commute time (minutes): 38.5
> Share of commuters driving alone: 86.0% – 301st highest of 2,997 counties
> Share of commuters carpooling: 8.8% – 1,354th lowest of 2,997 counties
> Share of commuters using public transit: 0.1% – 1,045th lowest of 2,997 counties

43. Contra Costa County, California
> Avg. commute time (minutes): 38.5
> Share of commuters driving alone: 65.7% – 82nd lowest of 2,997 counties
> Share of commuters carpooling: 10.7% – 816th highest of 2,997 counties
> Share of commuters using public transit: 10.3% – 33rd highest of 2,997 counties

42. Menifee County, Kentucky
> Avg. commute time (minutes): 38.5
> Share of commuters driving alone: 80.0% – 1,332nd lowest of 2,997 counties
> Share of commuters carpooling: 10.3% – 968th highest of 2,997 counties
> Share of commuters using public transit: 0.0% reported – the lowest of 2,997 counties (tied)
[in-text-ad-2]

41. Calaveras County, California
> Avg. commute time (minutes): 38.7
> Share of commuters driving alone: 76.0% – 574th lowest of 2,997 counties
> Share of commuters carpooling: 10.3% – 970th highest of 2,997 counties
> Share of commuters using public transit: 0.8% – 619th highest of 2,997 counties

40. Grant Parish, Louisiana
> Avg. commute time (minutes): 38.8
> Share of commuters driving alone: 83.1% – 877th highest of 2,997 counties
> Share of commuters carpooling: 11.5% – 595th highest of 2,997 counties
> Share of commuters using public transit: 0.1% – 1,032nd lowest of 2,997 counties
[in-text-ad]

39. King William County, Virginia
> Avg. commute time (minutes): 38.8
> Share of commuters driving alone: 86.3% – 251st highest of 2,997 counties
> Share of commuters carpooling: 5.4% – 127th lowest of 2,997 counties
> Share of commuters using public transit: 0.2% – 1,375th lowest of 2,997 counties
38. Morgan County, West Virginia
> Avg. commute time (minutes): 38.8
> Share of commuters driving alone: 81.7% – 1,245th highest of 2,997 counties
> Share of commuters carpooling: 9.1% – 1,480th lowest of 2,997 counties
> Share of commuters using public transit: 0.4% – 1,275th highest of 2,997 counties

37. Lawrence County, Mississippi
> Avg. commute time (minutes): 38.9
> Share of commuters driving alone: 87.8% – 118th highest of 2,997 counties
> Share of commuters carpooling: 6.4% – 304th lowest of 2,997 counties
> Share of commuters using public transit: 1.1% – 467th highest of 2,997 counties
[in-text-ad-2]

36. Newton County, Texas
> Avg. commute time (minutes): 38.9
> Share of commuters driving alone: 89.9% – 31st highest of 2,997 counties
> Share of commuters carpooling: 5.9% – 197th lowest of 2,997 counties
> Share of commuters using public transit: 0.3% – 1,424th lowest of 2,997 counties

35. Elliott County, Kentucky
> Avg. commute time (minutes): 39.0
> Share of commuters driving alone: 81.7% – 1,270th highest of 2,997 counties
> Share of commuters carpooling: 15.0% – 129th highest of 2,997 counties
> Share of commuters using public transit: 0.3% – 1,307th highest of 2,997 counties
[in-text-ad]

34. Paulding County, Georgia
> Avg. commute time (minutes): 39.2
> Share of commuters driving alone: 81.9% – 1,213th highest of 2,997 counties
> Share of commuters carpooling: 7.9% – 904th lowest of 2,997 counties
> Share of commuters using public transit: 0.6% – 849th highest of 2,997 counties
 24/7 Wall St.
33. Liberty County, Texas
> Avg. commute time (minutes): 39.3
> Share of commuters driving alone: 81.8% – 1,238th highest of 2,997 counties
> Share of commuters carpooling: 9.9% – 1,122nd highest of 2,997 counties
> Share of commuters using public transit: 0.4% – 1,248th highest of 2,997 counties

32. LaSalle Parish, Louisiana
> Avg. commute time (minutes): 39.4
> Share of commuters driving alone: 76.2% – 594th lowest of 2,997 counties
> Share of commuters carpooling: 16.0% – 89th highest of 2,997 counties
> Share of commuters using public transit: 0.6% – 813th highest of 2,997 counties
[in-text-ad-2]

31. Warren County, Virginia
> Avg. commute time (minutes): 39.4
> Share of commuters driving alone: 74.9% – 465th lowest of 2,997 counties
> Share of commuters carpooling: 13.0% – 302nd highest of 2,997 counties
> Share of commuters using public transit: 0.1% – 745th lowest of 2,997 counties

30. Stafford County, Virginia
> Avg. commute time (minutes): 39.7
> Share of commuters driving alone: 71.9% – 250th lowest of 2,997 counties
> Share of commuters carpooling: 13.0% – 293rd highest of 2,997 counties
> Share of commuters using public transit: 4.0% – 105th highest of 2,997 counties
[in-text-ad]

29. Bandera County, Texas
> Avg. commute time (minutes): 39.7
> Share of commuters driving alone: 78.2% – 916th lowest of 2,997 counties
> Share of commuters carpooling: 12.8% – 322nd highest of 2,997 counties
> Share of commuters using public transit: 0.0% reported – the lowest of 2,997 counties (tied)
28. Fauquier County, Virginia
> Avg. commute time (minutes): 39.7
> Share of commuters driving alone: 79.7% – 1,256th lowest of 2,997 counties
> Share of commuters carpooling: 7.8% – 821st lowest of 2,997 counties
> Share of commuters using public transit: 0.8% – 627th highest of 2,997 counties

27. Prince William County, Virginia
> Avg. commute time (minutes): 39.8
> Share of commuters driving alone: 73.1% – 318th lowest of 2,997 counties
> Share of commuters carpooling: 11.2% – 650th highest of 2,997 counties
> Share of commuters using public transit: 4.4% – 94th highest of 2,997 counties
[in-text-ad-2]
 by Nicholas A. Tonelli")
26. Monroe County, Pennsylvania
> Avg. commute time (minutes): 40.0
> Share of commuters driving alone: 77.4% – 775th lowest of 2,997 counties
> Share of commuters carpooling: 10.6% – 834th highest of 2,997 counties
> Share of commuters using public transit: 3.5% – 115th highest of 2,997 counties

25. Putnam County, New York
> Avg. commute time (minutes): 40.0
> Share of commuters driving alone: 74.7% – 432nd lowest of 2,997 counties
> Share of commuters carpooling: 8.0% – 952nd lowest of 2,997 counties
> Share of commuters using public transit: 7.8% – 44th highest of 2,997 counties
[in-text-ad]

24. San Jacinto County, Texas
> Avg. commute time (minutes): 40.5
> Share of commuters driving alone: 78.6% – 999th lowest of 2,997 counties
> Share of commuters carpooling: 11.4% – 606th highest of 2,997 counties
> Share of commuters using public transit: 0.5% – 1,043rd highest of 2,997 counties
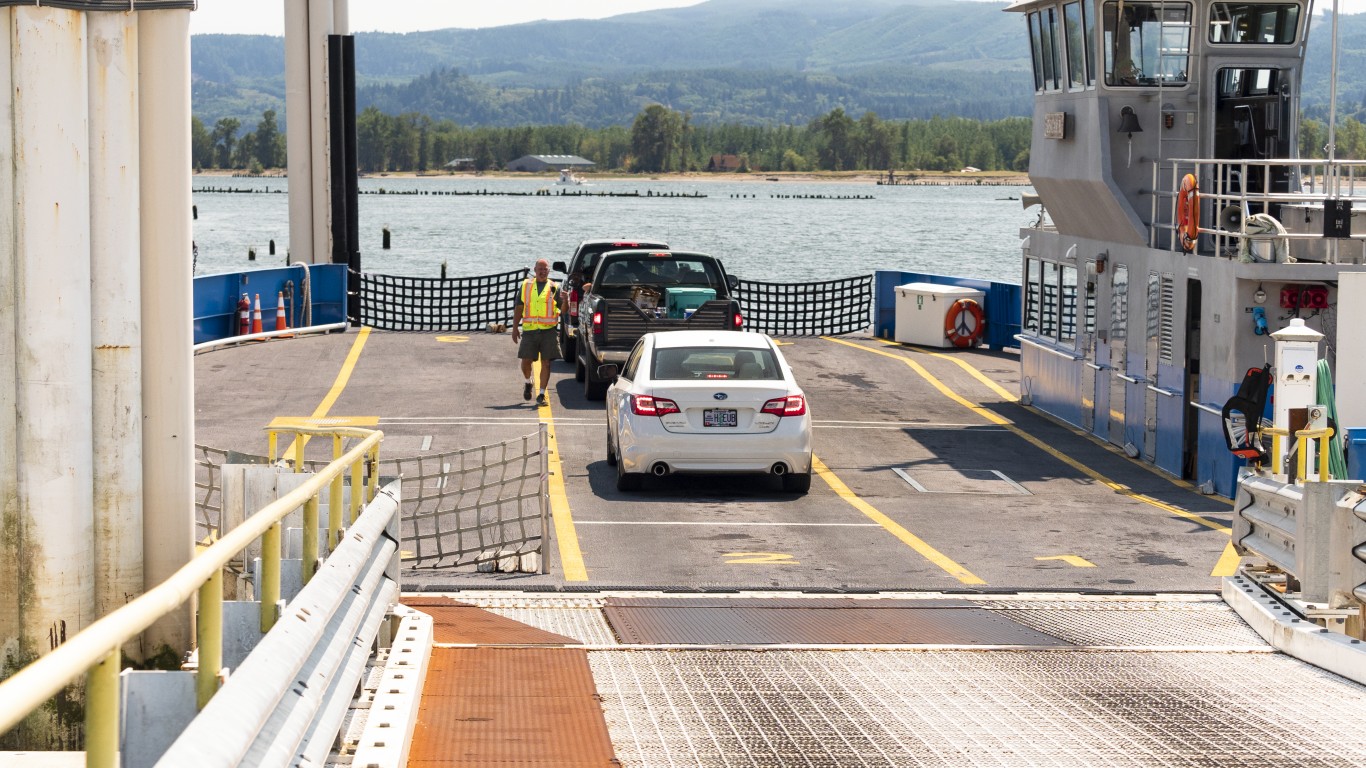
23. Wahkiakum County, Washington
> Avg. commute time (minutes): 40.8
> Share of commuters driving alone: 74.7% – 437th lowest of 2,997 counties
> Share of commuters carpooling: 8.1% – 965th lowest of 2,997 counties
> Share of commuters using public transit: 0.8% – 647th highest of 2,997 counties
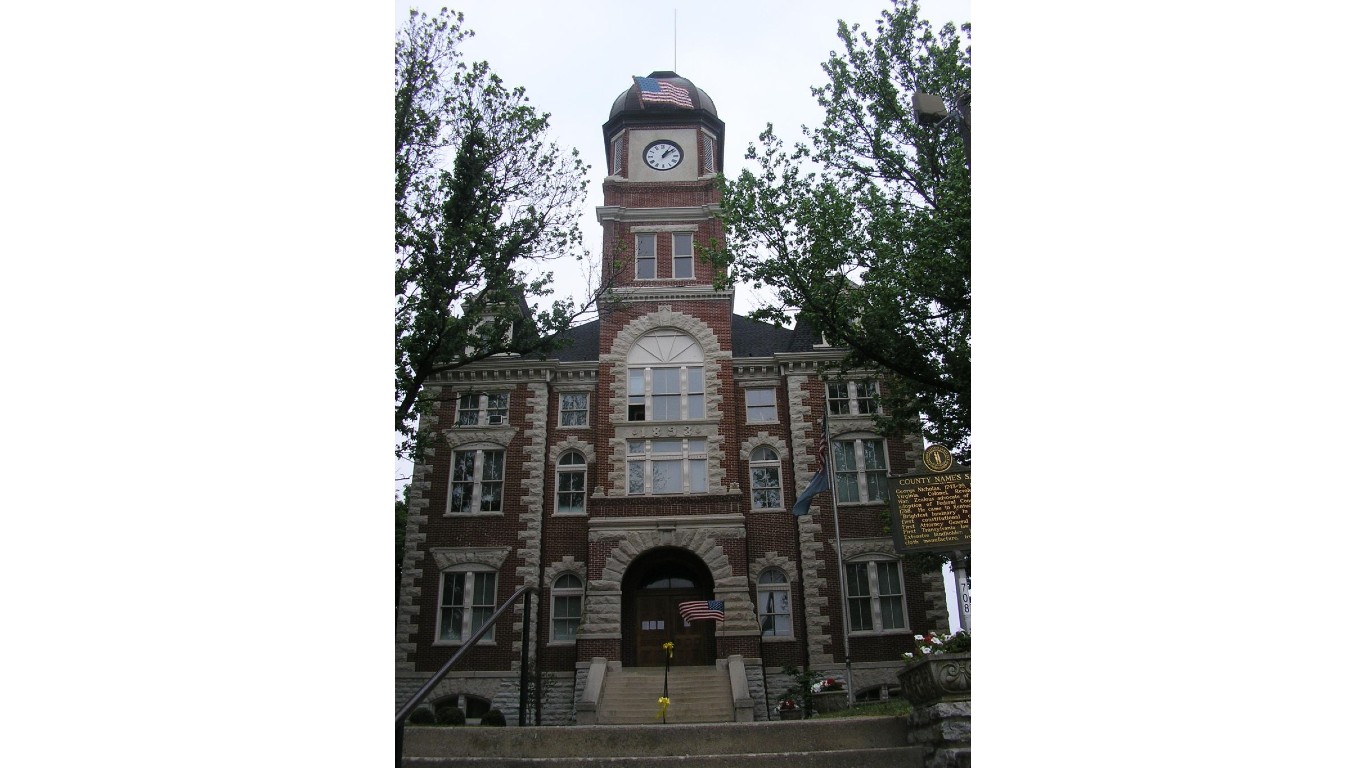
22. Nicholas County, Kentucky
> Avg. commute time (minutes): 41.0
> Share of commuters driving alone: 80.1% – 1,343rd lowest of 2,997 counties
> Share of commuters carpooling: 13.4% – 246th highest of 2,997 counties
> Share of commuters using public transit: 0.5% – 1,093rd highest of 2,997 counties
[in-text-ad-2]

21. Trousdale County, Tennessee
> Avg. commute time (minutes): 41.0
> Share of commuters driving alone: 79.1% – 1,114th lowest of 2,997 counties
> Share of commuters carpooling: 15.2% – 119th highest of 2,997 counties
> Share of commuters using public transit: 0.0% reported – the lowest of 2,997 counties (tied)

20. Owen County, Kentucky
> Avg. commute time (minutes): 41.2
> Share of commuters driving alone: 75.5% – 514th lowest of 2,997 counties
> Share of commuters carpooling: 14.3% – 177th highest of 2,997 counties
> Share of commuters using public transit: 0.0% reported – the lowest of 2,997 counties (tied)
[in-text-ad]

19. Rappahannock County, Virginia
> Avg. commute time (minutes): 41.2
> Share of commuters driving alone: 73.5% – 351st lowest of 2,997 counties
> Share of commuters carpooling: 11.9% – 480th highest of 2,997 counties
> Share of commuters using public transit: 1.2% – 417th highest of 2,997 counties
 24/7 Wall St.
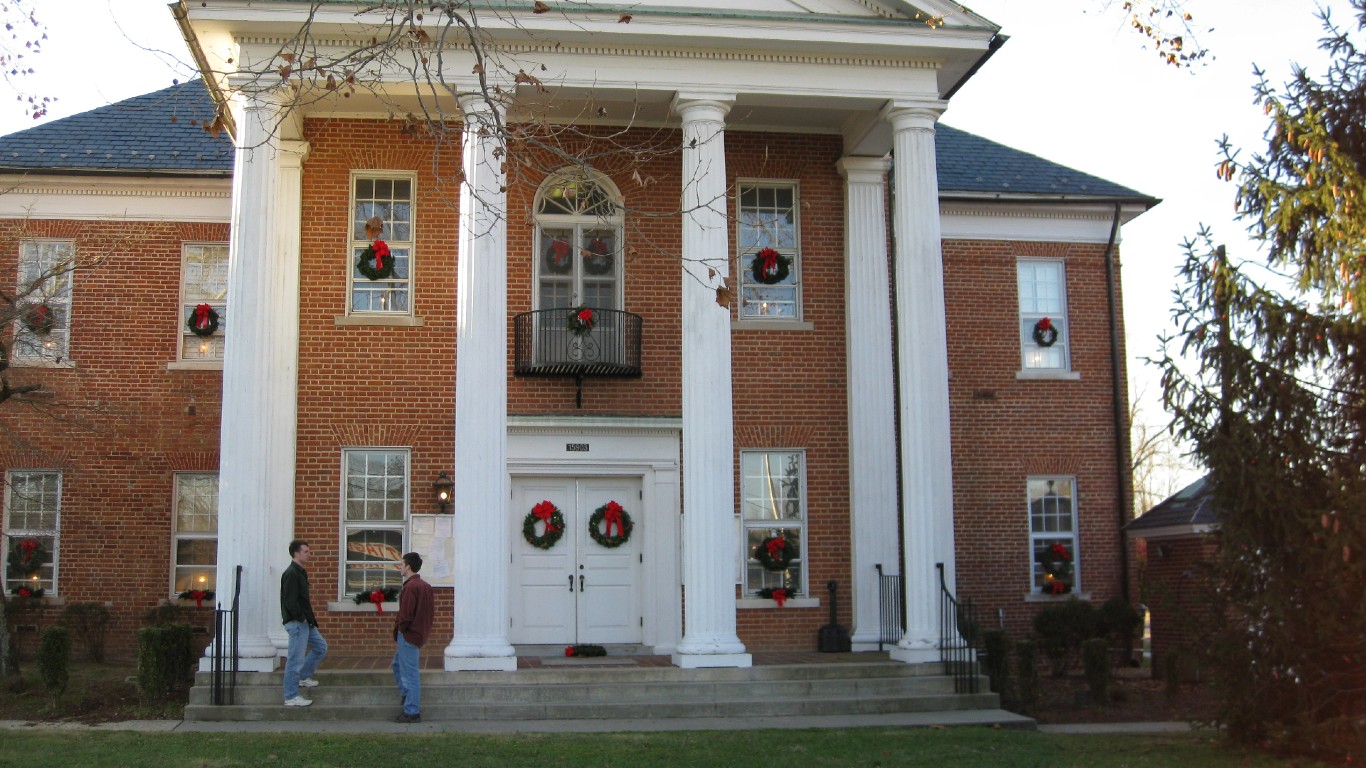
18. Cumberland County, Virginia
> Avg. commute time (minutes): 41.2
> Share of commuters driving alone: 82.4% – 1,073rd highest of 2,997 counties
> Share of commuters carpooling: 8.7% – 1,290th lowest of 2,997 counties
> Share of commuters using public transit: 0.0% reported – the lowest of 2,997 counties (tied)
17. Westmoreland County, Virginia
> Avg. commute time (minutes): 41.4
> Share of commuters driving alone: 79.1% – 1,115th lowest of 2,997 counties
> Share of commuters carpooling: 7.8% – 824th lowest of 2,997 counties
> Share of commuters using public transit: 0.3% – 1,408th lowest of 2,997 counties
[in-text-ad-2]

16. Manassas Park city, Virginia
> Avg. commute time (minutes): 41.6
> Share of commuters driving alone: 74.5% – 421st lowest of 2,997 counties
> Share of commuters carpooling: 10.9% – 749th highest of 2,997 counties
> Share of commuters using public transit: 7.7% – 45th highest of 2,997 counties

15. Elbert County, Colorado
> Avg. commute time (minutes): 42.0
> Share of commuters driving alone: 79.0% – 1,101st lowest of 2,997 counties
> Share of commuters carpooling: 7.9% – 861st lowest of 2,997 counties
> Share of commuters using public transit: 0.2% – 1,124th lowest of 2,997 counties
[in-text-ad]

14. Amite County, Mississippi
> Avg. commute time (minutes): 42.1
> Share of commuters driving alone: 83.1% – 880th highest of 2,997 counties
> Share of commuters carpooling: 11.0% – 702nd highest of 2,997 counties
> Share of commuters using public transit: 1.9% – 242nd highest of 2,997 counties
 24/7 Wall St.
13. Calvert County, Maryland
> Avg. commute time (minutes): 42.2
> Share of commuters driving alone: 81.4% – 1,324th highest of 2,997 counties
> Share of commuters carpooling: 6.9% – 464th lowest of 2,997 counties
> Share of commuters using public transit: 2.6% – 175th highest of 2,997 counties

12. Surry County, Virginia
> Avg. commute time (minutes): 42.2
> Share of commuters driving alone: 83.5% – 769th highest of 2,997 counties
> Share of commuters carpooling: 8.3% – 1,087th lowest of 2,997 counties
> Share of commuters using public transit: 3.0% – 144th highest of 2,997 counties
[in-text-ad-2]

11. Calhoun County, Illinois
> Avg. commute time (minutes): 42.6
> Share of commuters driving alone: 78.9% – 1,067th lowest of 2,997 counties
> Share of commuters carpooling: 8.3% – 1,089th lowest of 2,997 counties
> Share of commuters using public transit: 0.1% – 877th lowest of 2,997 counties
")
10. Clay County, West Virginia
> Avg. commute time (minutes): 43.0
> Share of commuters driving alone: 77.3% – 746th lowest of 2,997 counties
> Share of commuters carpooling: 19.0% – 32nd highest of 2,997 counties
> Share of commuters using public transit: 0.7% – 759th highest of 2,997 counties
[in-text-ad]

u00c3u0083u00c2u00a5u00c3u0082u00c2u00b8u00c3u0082u00c2u0083u00c3u0083u00c2u00a9u00c3u0082u00c2u00adu00c3u0082u00c2u00afu00c3u0083u00c2u00a5u00c3u0082u00c2u0085u00c3u0082u00c2u008bu00c3u0083u00c2u00a6u00c3u0082u00c2u009eu00c3u0082u00c2u0097u00c3u0083u00c2u00a5u00c3u0082u00c2u00a4u00c3u0082u00c2u00a7u00c3u0083u00c2u00a6u00c3u0082u00c2u00a9u00c3u0082u00c2u008b, u00c3u0083u00c2u00a6u00c3u0082u00c2u009du00c3u0082u00c2u00b1u00c3u0083u00c2u00a6u00c3u0082u00c2u00b2u00c3u0082u00c2u00b3u00c3u0083u00c2u00a5u00c3u0082u00c2u00a4u00c3u0082u00c2u00a7u00c3u0083u00c2u00a6... (CC BY-SA 2.0) by bryan...
9. Kings County, New York
> Avg. commute time (minutes): 43.0
> Share of commuters driving alone: 18.3% – 4th lowest of 2,997 counties
> Share of commuters carpooling: 4.1% – 34th lowest of 2,997 counties
> Share of commuters using public transit: 57.8% – the highest of 2,997 counties
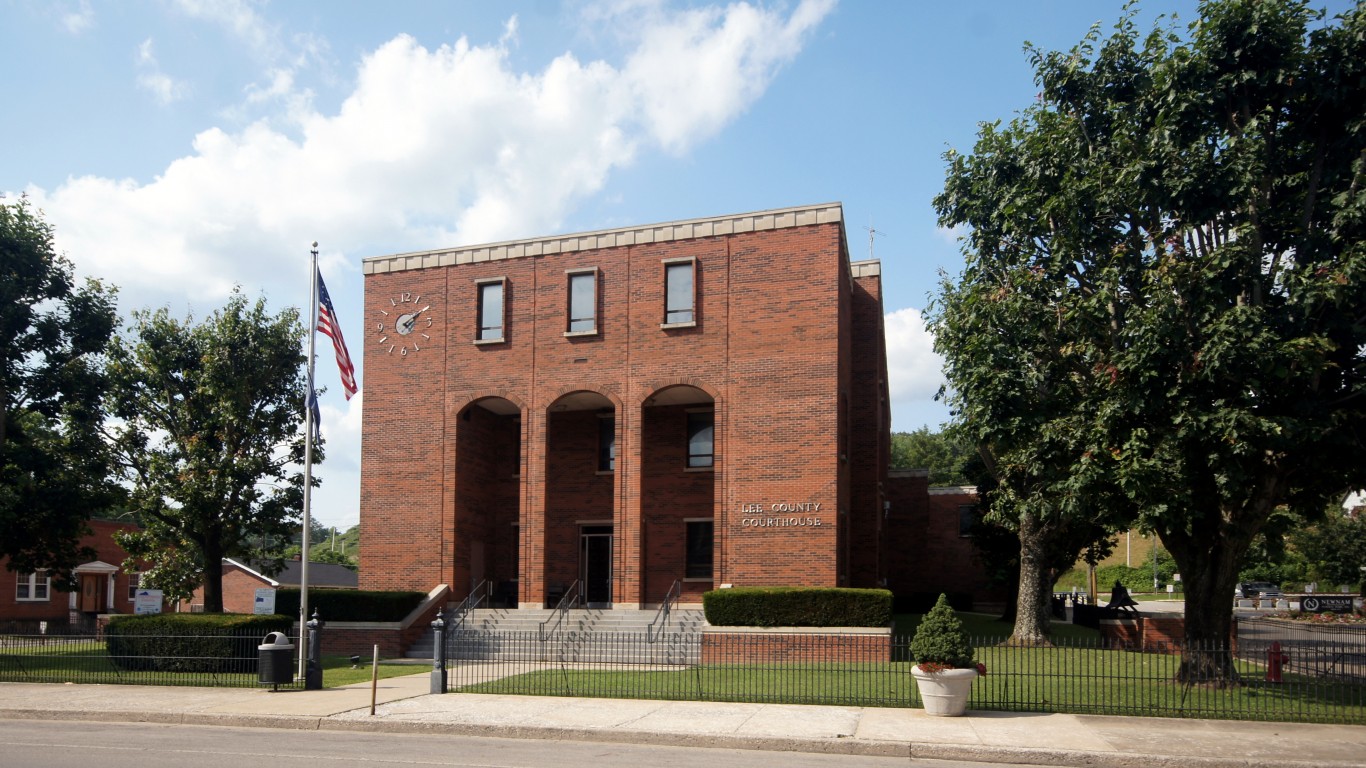
8. Lee County, Kentucky
> Avg. commute time (minutes): 44.1
> Share of commuters driving alone: 80.3% – 1,401st lowest of 2,997 counties
> Share of commuters carpooling: 9.8% – 1,166th highest of 2,997 counties
> Share of commuters using public transit: 0.0% reported – the lowest of 2,997 counties (tied)

7. Queens County, New York
> Avg. commute time (minutes): 44.2
> Share of commuters driving alone: 32.5% – 14th lowest of 2,997 counties
> Share of commuters carpooling: 6.3% – 279th lowest of 2,997 counties
> Share of commuters using public transit: 48.2% – 4th highest of 2,997 counties
[in-text-ad-2]

6. Richmond County, New York
> Avg. commute time (minutes): 44.6
> Share of commuters driving alone: 55.8% – 32nd lowest of 2,997 counties
> Share of commuters carpooling: 7.8% – 829th lowest of 2,997 counties
> Share of commuters using public transit: 28.0% – 9th highest of 2,997 counties
5. Bronx County, New York
> Avg. commute time (minutes): 45.3
> Share of commuters driving alone: 24.2% – 7th lowest of 2,997 counties
> Share of commuters carpooling: 4.4% – 46th lowest of 2,997 counties
> Share of commuters using public transit: 57.4% – 2nd highest of 2,997 counties
[in-text-ad]

4. Charles County, Maryland
> Avg. commute time (minutes): 45.4
> Share of commuters driving alone: 80.2% – 1,377th lowest of 2,997 counties
> Share of commuters carpooling: 6.7% – 380th lowest of 2,997 counties
> Share of commuters using public transit: 5.4% – 71st highest of 2,997 counties

3. Pike County, Pennsylvania
> Avg. commute time (minutes): 45.6
> Share of commuters driving alone: 80.7% – 1,498th highest of 2,997 counties
> Share of commuters carpooling: 8.1% – 974th lowest of 2,997 counties
> Share of commuters using public transit: 1.9% – 241st highest of 2,997 counties
2. Lewis County, Kentucky
> Avg. commute time (minutes): 46.0
> Share of commuters driving alone: 78.2% – 912th lowest of 2,997 counties
> Share of commuters carpooling: 11.8% – 508th highest of 2,997 counties
> Share of commuters using public transit: 0.0% reported – the lowest of 2,997 counties (tied)
[in-text-ad-2]

1. Mora County, New Mexico
> Avg. commute time (minutes): 51.3
> Share of commuters driving alone: 65.1% – 74th lowest of 2,997 counties
> Share of commuters carpooling: 23.3% – 4th highest of 2,997 counties
> Share of commuters using public transit: 0.0% reported – the lowest of 2,997 counties (tied)
Methodology
To determine the counties with the longest commutes, 24/7 Wall St. reviewed five-year estimates of average commute times from the U.S. Census Bureau’s 2020 American Community Survey. We considered all counties and county equivalents.
Counties were excluded if average commute time estimates were not available in the 2020 ACS, if there were fewer than 1,000 workers 16 years and over who did not work from home, or if the sampling error associated with a county’s data was deemed too high.
The sampling error was defined as too high if the coefficient of variation – a statistical assessment of how reliable an estimate is – for a county’s average commute time was above 15% and greater than two standard deviations above the mean CV for all counties’ average commute times. We similarly excluded counties that had a sampling error too high for their population, using the same definition.
Counties were ranked based on their average commute time. To break ties, we used the share of workers with a commute of 45 minutes or longer.
Additional information on the share of commuters driving alone, carpooling, and using public transit are also five-year estimates from the 2020 ACS.
Are You Ahead, or Behind on Retirement?
If you’re one of the over 4 Million Americans set to retire this year, you may want to pay attention. Many people have worked their whole lives preparing to retire without ever knowing the answer to the most important question: am I ahead, or behind on my goals?
Don’t make the same mistake. It’s an easy question to answer. A quick conversation with a financial advisor can help you unpack your savings, spending, and goals for your money. With Zoe Financial’s free matching tool, you can connect with trusted financial advisors in minutes.
Why wait? Click here to get started today!
Thank you for reading! Have some feedback for us?
Contact the 24/7 Wall St. editorial team.
Latest from 24/7


Our expert who first called NVIDIA in 2009 is predicting 2025 will see a historic AI breakthrough.
You can follow him investing $500,000 of his own money on our top AI stocks for free.