In an era of historic inflation and growing concerns over a potential recession, the job market remains a bright spot in the U.S. economy. The national jobless rate stands at 3.6%, its lowest point since the beginning of the pandemic and closely in line with pre-pandemic lows. Despite a tight labor market overall, certain occupations do not provide as much job security as others.
Using data from the Bureau of Labor Statistics, 24/7 Wall St. reviewed unemployment rates by occupation to identify the jobs with the worst job security. To be counted among a certain occupation, an unemployed individual needed to have held that specific job immediately prior to being unemployed. Among the jobs on this list, unemployment rates range from 9% to 33%.
Many jobs on this list are in the travel, hospitality, and entertainment industries that were hit hard by closures early on in the COVID-19 pandemic. These jobs include flight attendants, hosts and hostesses, maids, and bartenders. Travel restrictions and business closures during the pandemic led to the loss of nearly 4 million hospitality jobs in 2020, according to American Hotel and Lodging Association, an industry advocacy group. Here is a look at the industries laying off the most Americans.
Other potential explanations for the high unemployment levels among the jobs on this list include decreasing demand for workers due to increasing automation. Some high-unemployment occupations, such as cashiers and legal secretaries and administrative assistants will be in far lower demand as technological advances continue to reduce the need for personnel.
It is important to note that in many of these occupations, high unemployment is partially attributable to workers willingly walking away. In a trend now known as the Great Resignation, Americans are quitting at near-record rates, often citing low pay and little room for advancement as reasons. Indeed, many of the jobs on this list are entry-level positions that are typically low paying, including wait staff and dishwashers. Here is a look at the states where the most people are quitting their jobs.
Click here to see the jobs with the worst job security
Click here to read our detailed methodology

38. Construction trades helpers
> Unemployment rate: 9.0%
> Labor force: 78,000
> Median annual wage: $34,000
> Projected employment change 2020-2030: +2.6%
> Typical entry-level education requirement: N/A
[in-text-ad]

37. Refuse and recyclable material collectors
> Unemployment rate: 9.1%
> Labor force: 96,000
> Median annual wage: $39,100
> Projected employment change 2020-2030: +11.9%
> Typical entry-level education requirement: No formal educational credential

36. Flight attendants
> Unemployment rate: 9.1%
> Labor force: 115,000
> Median annual wage: $59,050
> Projected employment change 2020-2030: +30.3%
> Typical entry-level education requirement: High school diploma or equivalent

35. Cashiers
> Unemployment rate: 9.1%
> Labor force: 2,862,000
> Median annual wage: $25,020
> Projected employment change 2020-2030: -10.0%
> Typical entry-level education requirement: No formal educational credential
[in-text-ad-2]

34. Roofers
> Unemployment rate: 9.2%
> Labor force: 243,000
> Median annual wage: $43,580
> Projected employment change 2020-2030: +4.6%
> Typical entry-level education requirement: No formal educational credential

33. Childcare workers
> Unemployment rate: 9.2%
> Labor force: 1,072,000
> Median annual wage: $25,460
> Projected employment change 2020-2030: +8.5%
> Typical entry-level education requirement: High school diploma or equivalent
[in-text-ad]
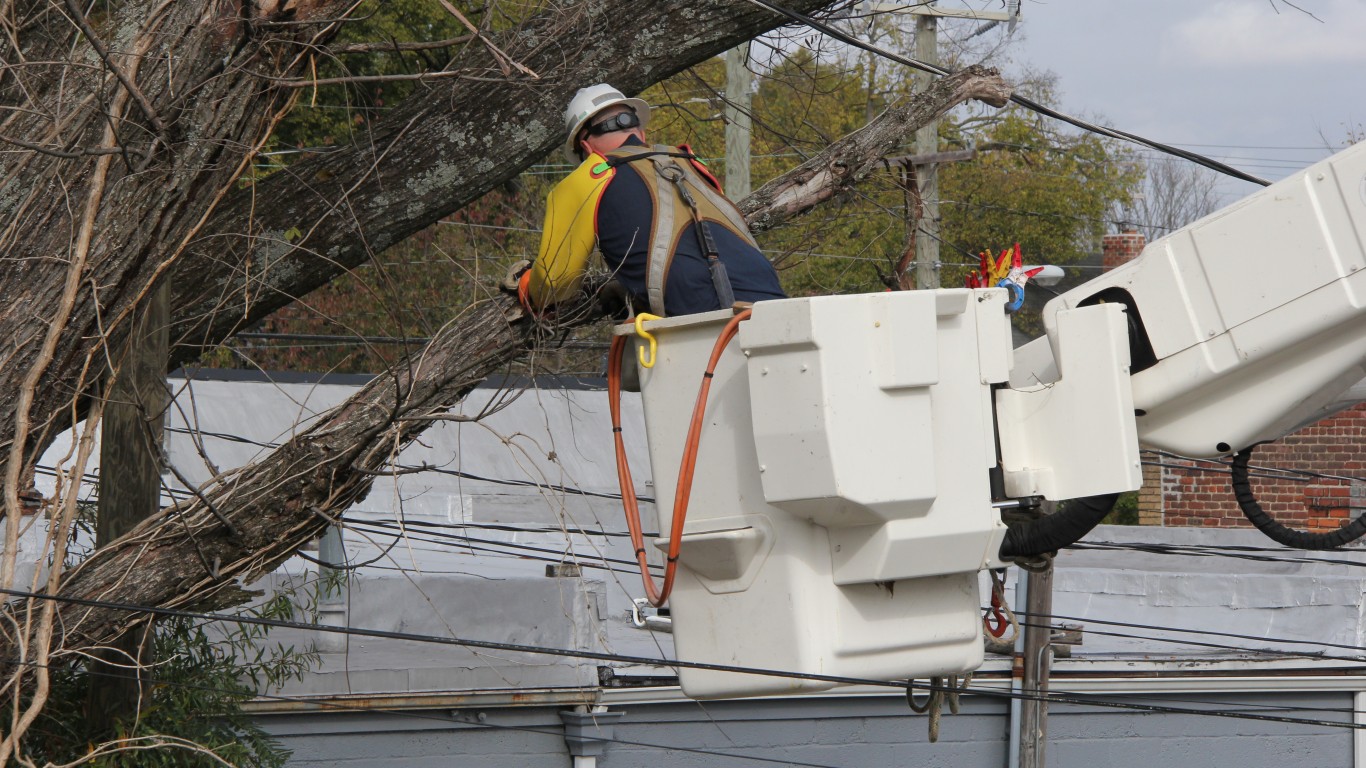
32. Tree trimmers and pruners
> Unemployment rate: 9.2%
> Labor force: 108,000
> Median annual wage: $41,340
> Projected employment change 2020-2030: +6.2%
> Typical entry-level education requirement: High school diploma or equivalent

31. Meeting, convention, and event planners
> Unemployment rate: 9.3%
> Labor force: 128,000
> Median annual wage: $51,560
> Projected employment change 2020-2030: +17.6%
> Typical entry-level education requirement: Bachelor’s degree

30. Stockers and order fillers
> Unemployment rate: 9.5%
> Labor force: 1,826,000
> Median annual wage: $29,190
> Projected employment change 2020-2030: +4.3%
> Typical entry-level education requirement: High school diploma or equivalent
[in-text-ad-2]

29. Bill and account collectors
> Unemployment rate: 9.5%
> Labor force: 107,000
> Median annual wage: $38,100
> Projected employment change 2020-2030: -9.2%
> Typical entry-level education requirement: High school diploma or equivalent

28. Tax preparers
> Unemployment rate: 9.6%
> Labor force: 112,000
> Median annual wage: $44,300
> Projected employment change 2020-2030: +1.6%
> Typical entry-level education requirement: High school diploma or equivalent
[in-text-ad]

27. Interpreters and translators
> Unemployment rate: 9.7%
> Labor force: 103,000
> Median annual wage: $52,330
> Projected employment change 2020-2030: +23.7%
> Typical entry-level education requirement: Bachelor’s degree

26. Construction laborers
> Unemployment rate: 9.9%
> Labor force: 2,403,000
> Median annual wage: $37,890
> Projected employment change 2020-2030: +8.0%
> Typical entry-level education requirement: No formal educational credential

25. Hand laborers and freight, stock, and material movers
> Unemployment rate: 10.0%
> Labor force: 2,401,000
> Median annual wage: $31,120
> Projected employment change 2020-2030: +9.1%
> Typical entry-level education requirement: No formal educational credential
[in-text-ad-2]

24. Statisticians
> Unemployment rate: 10.0%
> Labor force: 50,000
> Median annual wage: $92,270
> Projected employment change 2020-2030: +35.5%
> Typical entry-level education requirement: Master’s degree

23. Medical transcriptionists
> Unemployment rate: 10.2%
> Labor force: 50,000
> Median annual wage: $35,270
> Projected employment change 2020-2030: -7.4%
> Typical entry-level education requirement: Postsecondary nondegree award
[in-text-ad]

22. Non-postal-service mail clerks and mail machine operators
> Unemployment rate: 10.5%
> Labor force: 59,000
> Median annual wage: $31,920
> Projected employment change 2020-2030: -4.3%
> Typical entry-level education requirement: High school diploma or equivalent

21. Hotel, motel, and resort desk clerks
> Unemployment rate: 10.5%
> Labor force: 133,000
> Median annual wage: $25,490
> Projected employment change 2020-2030: +16.4%
> Typical entry-level education requirement: High school diploma or equivalent

20. Parking attendants
> Unemployment rate: 10.6%
> Labor force: 79,000
> Median annual wage: $27,080
> Projected employment change 2020-2030: +14.1%
> Typical entry-level education requirement: No formal educational credential
[in-text-ad-2]

19. Maids and housekeeping cleaners
> Unemployment rate: 10.7%
> Labor force: 1,519,000
> Median annual wage: $26,220
> Projected employment change 2020-2030: +11.3%
> Typical entry-level education requirement: No formal educational credential

18. Legal secretaries and administrative assistants
> Unemployment rate: 10.9%
> Labor force: 55,000
> Median annual wage: $48,980
> Projected employment change 2020-2030: -21.0%
> Typical entry-level education requirement: High school diploma or equivalent
[in-text-ad]

17. Waiters and waitresses
> Unemployment rate: 10.9%
> Labor force: 1,830,000
> Median annual wage: $23,740
> Projected employment change 2020-2030: +20.1%
> Typical entry-level education requirement: No formal educational credential

16. Baggage porters, bellhops, and concierges
> Unemployment rate: 11.1%
> Labor force: 95,000
> Median annual wage: $30,110
> Projected employment change 2020-2030: +22.0%
> Typical entry-level education requirement: N/A

15. Recreation workers
> Unemployment rate: 11.8%
> Labor force: 158,000
> Median annual wage: $28,440
> Projected employment change 2020-2030: +16.3%
> Typical entry-level education requirement: High school diploma or equivalent
[in-text-ad-2]

14. Telephone, mail, and in-person interviewers
> Unemployment rate: 11.9%
> Labor force: 230,000
> Median annual wage: $36,170
> Projected employment change 2020-2030: -6.5%
> Typical entry-level education requirement: High school diploma or equivalent

13. Hosts and hostesses, restaurant, lounge, and coffee shop
> Unemployment rate: 12.0%
> Labor force: 320,000
> Median annual wage: $23,880
> Projected employment change 2020-2030: +25.2%
> Typical entry-level education requirement: No formal educational credential
[in-text-ad]

12. Hand packers and packagers
> Unemployment rate: 12.2%
> Labor force: 845,000
> Median annual wage: $28,050
> Projected employment change 2020-2030: +0.2%
> Typical entry-level education requirement: No formal educational credential

11. Graders and sorters of agricultural products
> Unemployment rate: 13.6%
> Labor force: 61,000
> Median annual wage: $28,220
> Projected employment change 2020-2030: -1.2%
> Typical entry-level education requirement: No formal educational credential

10. Production worker helpers
> Unemployment rate: 13.7%
> Labor force: 61,000
> Median annual wage: $30,500
> Projected employment change 2020-2030: -4.5%
> Typical entry-level education requirement: High school diploma or equivalent
[in-text-ad-2]

9. Dishwashers
> Unemployment rate: 13.8%
> Labor force: 282,000
> Median annual wage: $25,270
> Projected employment change 2020-2030: +19.0%
> Typical entry-level education requirement: No formal educational credential

8. Bartenders
> Unemployment rate: 14.0%
> Labor force: 421,000
> Median annual wage: $24,960
> Projected employment change 2020-2030: +32.5%
> Typical entry-level education requirement: No formal educational credential
[in-text-ad]

7. Dining room and cafeteria attendants and bartender helpers
> Unemployment rate: 14.8%
> Labor force: 285,000
> Median annual wage: $25,010
> Projected employment change 2020-2030: +26.6%
> Typical entry-level education requirement: No formal educational credential

6. Musicians and singers
> Unemployment rate: 14.8%
> Labor force: 149,000
> Median annual wage: N/A
> Projected employment change 2020-2030: +11.1%
> Typical entry-level education requirement: No formal educational credential

5. Taxi drivers
> Unemployment rate: 15.1%
> Labor force: 397,000
> Median annual wage: N/A
> Projected employment change 2020-2030: N/A
> Typical entry-level education requirement: N/A
[in-text-ad-2]

4. Crossing guards and flaggers
> Unemployment rate: 15.6%
> Labor force: 60,000
> Median annual wage: $30,790
> Projected employment change 2020-2030: +13.5%
> Typical entry-level education requirement: No formal educational credential

3. Structural iron and steel workers
> Unemployment rate: 19.4%
> Labor force: 51,000
> Median annual wage: $54,830
> Projected employment change 2020-2030: +6.1%
> Typical entry-level education requirement: High school diploma or equivalent
[in-text-ad]

2. Shuttle drivers and chauffeurs
> Unemployment rate: 20.9%
> Labor force: 72,000
> Median annual wage: N/A
> Projected employment change 2020-2030: N/A
> Typical entry-level education requirement: .

1. Actors
> Unemployment rate: 33.0%
> Labor force: 67,000
> Median annual wage: N/A
> Projected employment change 2020-2030: +32.4%
> Typical entry-level education requirement: Some college, no degree
Methodology
To determine the jobs with the worst security, 24/7 Wall St. reviewed unpublished data on unemployment rate for over 500 detailed occupations from the Bureau of Labor Statistics’ Current Population Survey. Detailed occupations were ranked based on the percentage of the labor force that was unemployed as of 2021. Unemployed members of an occupational labor force need to have been last employed in this occupation prior to unemployment. Only occupations whose labor forces were 50,000 or greater were considered. Broad occupation titles classified as “all other” were excluded from consideration.
Supplemental data on median annual wage came from the BLS Occupational Employment and Wage Statistics and are for 2020. Data on projected employment change from 2020 to 2030 and the typical education requirement for entry-level positions within the profession came from the BLS Employment Projections program.
Find a Qualified Financial Advisor (Sponsor)
Finding a qualified financial advisor doesn’t have to be hard. SmartAsset’s free tool matches you with up to 3 fiduciary financial advisors in your area in 5 minutes. Each advisor has been vetted by SmartAsset and is held to a fiduciary standard to act in your best interests. If you’re ready to be matched with local advisors that can help you achieve your financial goals, get started now.
Thank you for reading! Have some feedback for us?
Contact the 24/7 Wall St. editorial team.
 24/7 Wall St.
 24/7 Wall St.
 24/7 Wall St.

