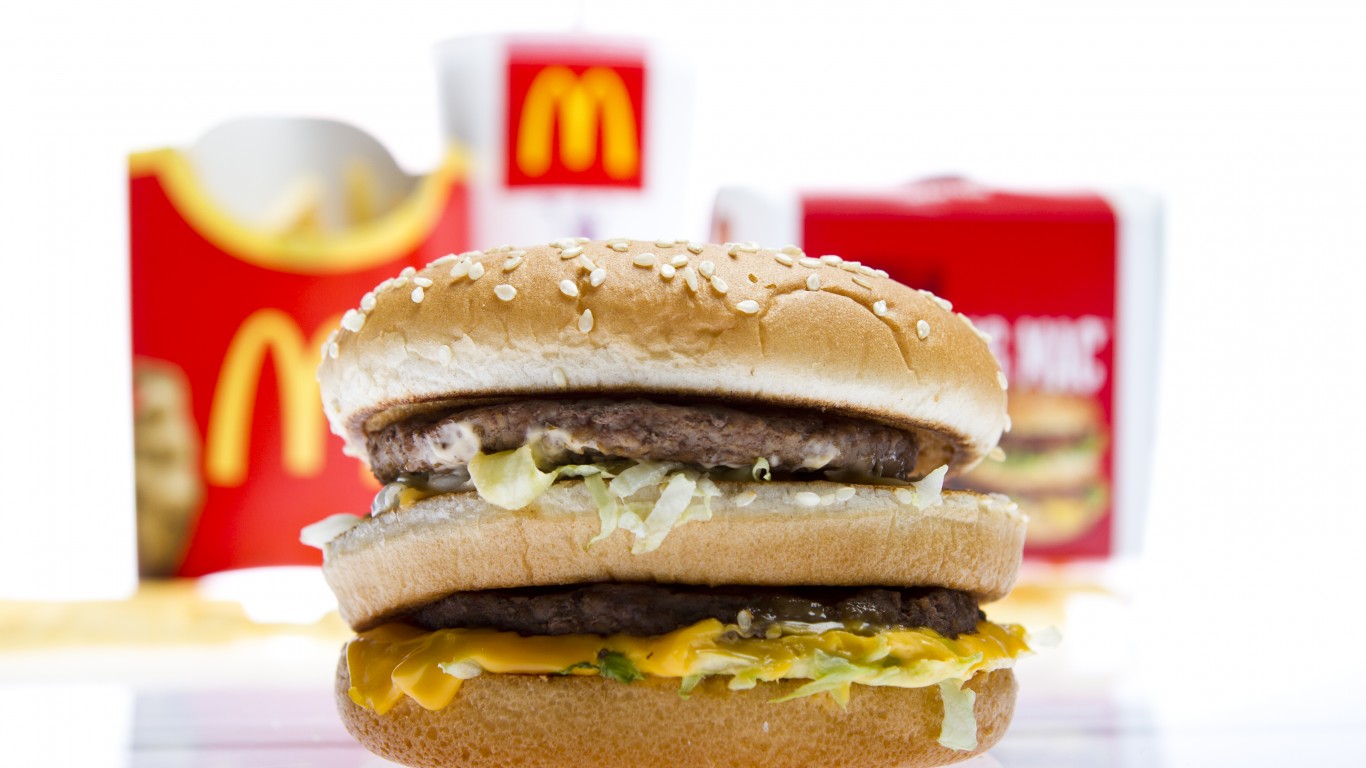
Arguably the most iconic fast food item of all time, McDonald’s has had the Big Mac on its menu since 1968. During the commercials of the 1970s, company marketing recited the burger’s ingredients: two all-beef patties, special sauce, lettuce, cheese, pickles, onions on a sesame seed bun.
A hallmark of McDonald’s food is that it is supposed to taste the same whether you live in Hilo, Hawaii, or Bangor, Maine. While that may be true, the affordability of a 550-calorie Big Mac varies widely from state to state.
To identify the 32 states where people can’t afford a Big Mac, 24/7 Wall St. reviewed Pantry and Larder’s report The Truth About Big Mac Inflation. To determine Big Mac affordability, the report used Big Mac prices in U.S. states (from fastfoodmenuprices.com) and per capita disposable income in each state for March 2022 from the U.S. Bureau of Economic Analysis.
The report converted Big Mac prices into a price index, with 100 being the median price. The average U.S. disposable income used to calculate affordability is $55,671. Total population figures came from the Census Bureau’s American Community Survey 2020 five-year estimates. (The price of this household item is soaring.)
The price of the iconic burger is lowest in Mississippi, costing 11% less than average. However, the sandwich is also the least affordable in the state because residents of the Magnolia State are among the poorest in the country. Disposable income in Mississippi is $41,916, the lowest of any state. The states where the Big Mac is least affordable are in the South, Southwest, and the Plains states.
Click here to see states where people can’t afford a Big Mac.

32. Rhode Island
> Affordability of a Big Mac: 1.2% less affordable than average
> Price of a Big Mac: 1.8% more than average price
> Disposable income: $54,991
> Population: 1,057,798
[in-text-ad]

31. Texas
> Affordability of a Big Mac: 2.5% less affordable than average
> Price of a Big Mac: 0.0% less than average price
> Disposable income: $54,280
> Population: 28,635,442
[recirclink id=1154831]

30. Florida
> Affordability of a Big Mac: 2.8% less affordable than average
> Price of a Big Mac: 1.8% more than average price
> Disposable income: $54,099
> Population: 21,216,924

29. Hawaii
> Affordability of a Big Mac: 3.3% less affordable than average
> Price of a Big Mac: 21.0% more than average price
> Disposable income: $53,815
> Population: 1,420,074
[in-text-ad-2]

28. Vermont
> Affordability of a Big Mac: 3.9% less affordable than average
> Price of a Big Mac: 4.6% more than average price
> Disposable income: $53,506
> Population: 624,340
27. Kansas
> Affordability of a Big Mac: 4.6% less affordable than average
> Price of a Big Mac: 7.3% less than average price
> Disposable income: $53,102
> Population: 2,912,619
[in-text-ad]
26. Oregon
> Affordability of a Big Mac: 5.3% less affordable than average
> Price of a Big Mac: 1.8% more than average price
> Disposable income: $52,748
> Population: 4,176,346
[recirclink id=1154200]

25. Nevada
> Affordability of a Big Mac: 6.2% less affordable than average
> Price of a Big Mac: 0.9% more than average price
> Disposable income: $52,198
> Population: 3,030,281
24. Delaware
> Affordability of a Big Mac: 6.7% less affordable than average
> Price of a Big Mac: 5.5% more than average price
> Disposable income: $51,916
> Population: 967,679
[in-text-ad-2]

23. Wisconsin
> Affordability of a Big Mac: 7.2% less affordable than average
> Price of a Big Mac: 4.6% less than average price
> Disposable income: $51,663
> Population: 5,806,975

22. Iowa
> Affordability of a Big Mac: 8.3% less affordable than average
> Price of a Big Mac: 7.3% less than average price
> Disposable income: $51,031
> Population: 3,150,011
[in-text-ad]
21. Maine
> Affordability of a Big Mac: 8.3% less affordable than average
> Price of a Big Mac: 1.8% more than average price
> Disposable income: $51,073
> Population: 1,340,825
[recirclink id=1160803]
20. Montana
> Affordability of a Big Mac: 9.1% less affordable than average
> Price of a Big Mac: 2.7% less than average price
> Disposable income: $50,596
> Population: 1,061,705

19. Ohio
> Affordability of a Big Mac: 9.3% less affordable than average
> Price of a Big Mac: 8.2% less than average price
> Disposable income: $50,469
> Population: 11,675,275
[in-text-ad-2]

18. Indiana
> Affordability of a Big Mac: 9.7% less affordable than average
> Price of a Big Mac: 6.4% less than average price
> Disposable income: $50,264
> Population: 6,696,893

17. Tennessee
> Affordability of a Big Mac: 9.7% less affordable than average
> Price of a Big Mac: 6.4% less than average price
> Disposable income: $50,292
> Population: 6,772,268
[in-text-ad]

16. Louisiana
> Affordability of a Big Mac: 10.7% less affordable than average
> Price of a Big Mac: 5.5% less than average price
> Disposable income: $49,715
> Population: 4,664,616
[recirclink id=1161455]

15. Michigan
> Affordability of a Big Mac: 11.2% less affordable than average
> Price of a Big Mac: 2.7% less than average price
> Disposable income: $49,427
> Population: 9,973,907
14. Missouri
> Affordability of a Big Mac: 11.4% less affordable than average
> Price of a Big Mac: 9.1% less than average price
> Disposable income: $49,300
> Population: 6,124,160
[in-text-ad-2]
13. Utah
> Affordability of a Big Mac: 11.5% less affordable than average
> Price of a Big Mac: 0.0% less than average price
> Disposable income: $49,291
> Population: 3,151,239

12. Georgia
> Affordability of a Big Mac: 11.6% less affordable than average
> Price of a Big Mac: 5.5% less than average price
> Disposable income: $49,192
> Population: 10,516,579
[in-text-ad]

11. North Carolina
> Affordability of a Big Mac: 12.4% less affordable than average
> Price of a Big Mac: 5.5% less than average price
> Disposable income: $48,792
> Population: 10,386,227
[recirclink id=1148209]

10. Arizona
> Affordability of a Big Mac: 12.5% less affordable than average
> Price of a Big Mac: 0.9% more than average price
> Disposable income: $48,732
> Population: 7,174,064

9. Oklahoma
> Affordability of a Big Mac: 12.9% less affordable than average
> Price of a Big Mac: 7.3% less than average price
> Disposable income: $48,494
> Population: 3,949,342
[in-text-ad-2]

8. South Carolina
> Affordability of a Big Mac: 16.1% less affordable than average
> Price of a Big Mac: 6.4% less than average price
> Disposable income: $46,715
> Population: 5,091,517
7. Arkansas
> Affordability of a Big Mac: 16.9% less affordable than average
> Price of a Big Mac: 10.0% less than average price
> Disposable income: $46,278
> Population: 3,011,873
[in-text-ad]

6. Idaho
> Affordability of a Big Mac: 17.3% less affordable than average
> Price of a Big Mac: 3.6% less than average price
> Disposable income: $46,026
> Population: 1,754,367
[recirclink id=1154831]

5. Kentucky
> Affordability of a Big Mac: 18.5% less affordable than average
> Price of a Big Mac: 8.2% less than average price
> Disposable income: $45,357
> Population: 4,461,952

4. New Mexico
> Affordability of a Big Mac: 18.6% less affordable than average
> Price of a Big Mac: 1.8% less than average price
> Disposable income: $45,293
> Population: 2,097,021
[in-text-ad-2]
3. Alabama
> Affordability of a Big Mac: 21.0% less affordable than average
> Price of a Big Mac: 9.1% less than average price
> Disposable income: $44,003
> Population: 4,893,186

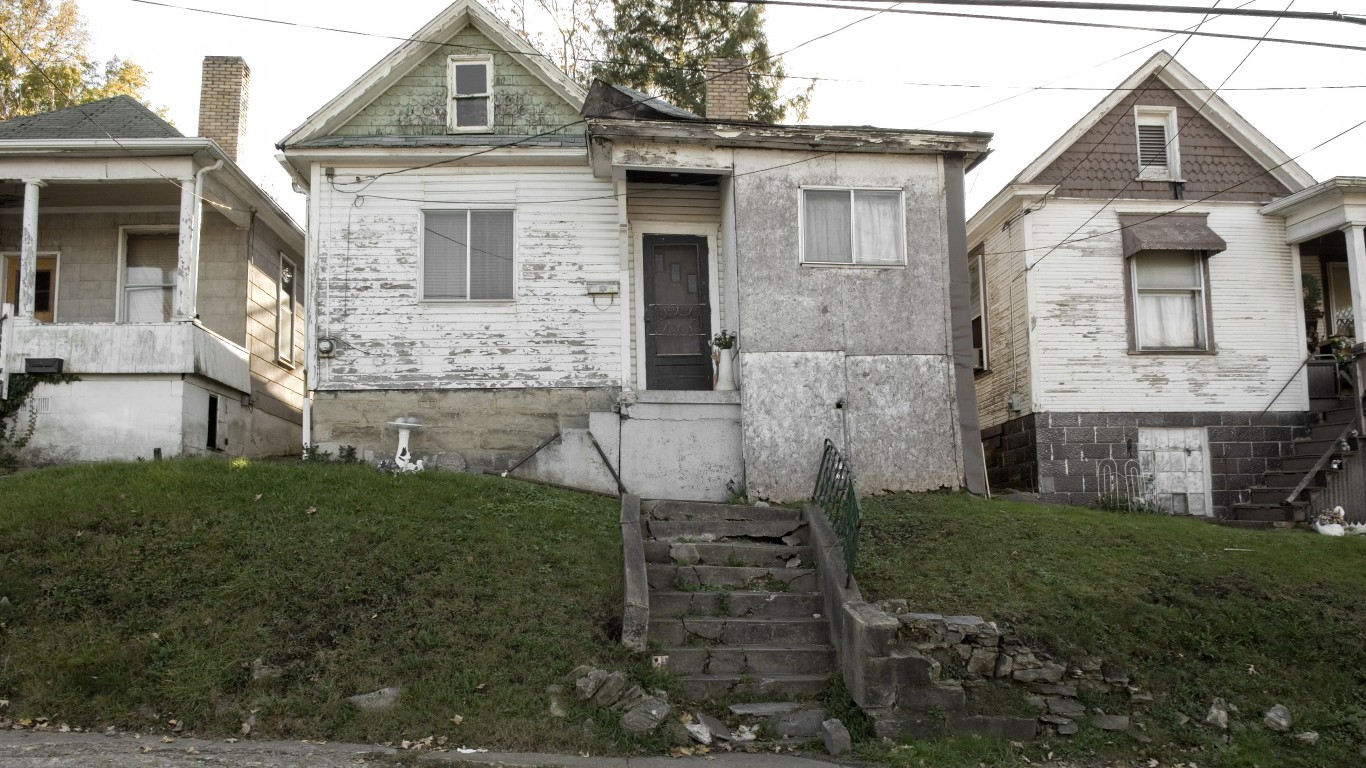
2. West Virginia
> Affordability of a Big Mac: 21.8% less affordable than average
> Price of a Big Mac: 8.2% less than average price
> Disposable income: $43,537
> Population: 1,807,426
[in-text-ad]
1. Mississippi
> Affordability of a Big Mac: 24.7% less affordable than average
> Price of a Big Mac: 10.9% less than average price
> Disposable income: $41,916
> Population: 2,981,835