Not all places in the U.S. have enjoyed the tremendous spike in housing prices that much of the country has. Some have been negatively affected by the pandemic. T
Several factors have driven home prices higher. One is extremely low mortgage rates, though rates have begun to rise. Another is that middle- and upper-class incomes were not hurt much by the pandemic. Yet another is the new mobility of Americans, who want to move from expensive coastal cities to others with lower costs of living and a better quality of life. In fact, high cost of living, which includes housing costs, can increase the risk of a housing market. (These are the most expensive states to live in.)
Also, not all markets have seen large increases in home prices. Despite the strong real estate market, there are still many counties where the housing market is at increased risk from the impact of the pandemic, directly or indirectly.
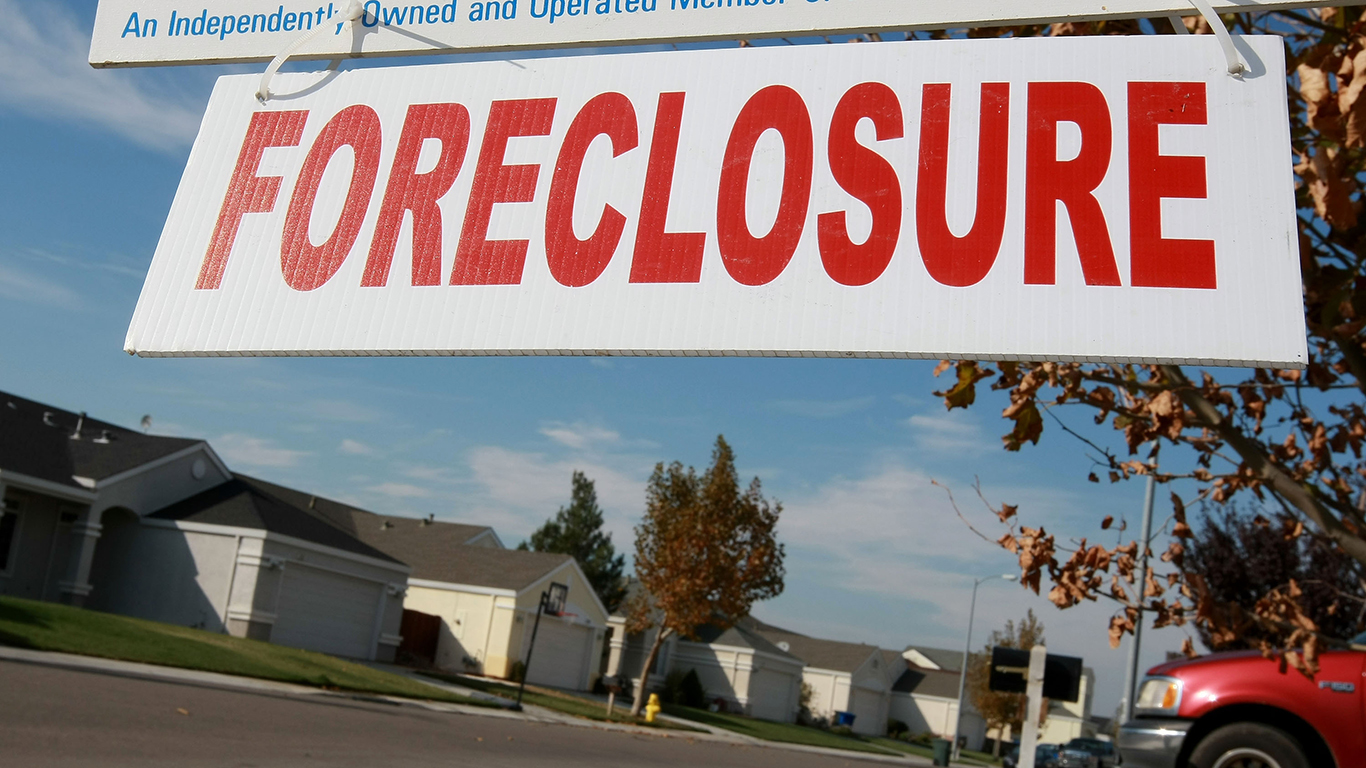
These areas have higher than average foreclosure rates and higher than average shares of homes with underwater mortgages, meaning the value of outstanding mortgage balances exceeds the total value of the property. Some of these markets are also far less affordable than average, with high homeownership costs relative to local incomes.
Based on an index of these three measures – foreclosure rates (out of all residential properties), share of underwater mortgages, and affordability (homeownership costs as a percentage of average local wages) – at the county level, 24/7 Wall St. identified the most at-risk housing market. All data came from real estate and property data company ATTOM Data Solutions’ Q1 2021 Special Coronavirus Report. Data used was as of the first quarter of 2021 except for estimated market values of homes which was as of the fourth quarter of 2020.
Many of the most at-risk counties are located in the eastern United States, spanning Florida up through the mid-Atlantic and New England. The pandemic has taken a greater than average economic and public health toll in some of these counties. (This is the most expensive city to buy a home in every state.)
In Sussex County, which is in the New York-Newark-Jersey City metro area, the typical homeownership costs as a share of median income is a whopping 40.6%, while there are 7,646 homes with underwater mortgages, or 18.3% of homes with loans.
Click here to see the most at-risk housing market in America

50. Harnett. Harnett, North Carolina
> Location: Dunn, NC metropolitan area
> Median home sale price: $212,500 ( +16.4 1-yr. increase)
> Typical homeownership costs as a share of median income: 28.1%
> Homes with underwater mortgages: 2,178 (12.9% of homes w/ loans)
> Homes with foreclosure filings: 21
[in-text-ad]
49. Saint Lucie. Saint Lucie, Florida
> Location: Port St. Lucie, FL metropolitan area
> Median home sale price: $255,000 ( +18.6 1-yr. increase)
> Typical homeownership costs as a share of median income: 32.2%
> Homes with underwater mortgages: 7,296 (9.8% of homes w/ loans)
> Homes with foreclosure filings: 67
[recirclink id=1048901]

48. Ascension. Ascension, Louisiana
> Location: Baton Rouge, LA metropolitan area
> Median home sale price: $220,000 ( +0.5 1-yr. increase)
> Typical homeownership costs as a share of median income: 19%
> Homes with underwater mortgages: 4,115 (19.1% of homes w/ loans)
> Homes with foreclosure filings: 28

47. Chesapeake City. Chesapeake City, Virginia
> Location: Virginia Beach-Norfolk-Newport News, VA-NC metropolitan area
> Median home sale price: $285,000 ( +16.3 1-yr. increase)
> Typical homeownership costs as a share of median income: 31%
> Homes with underwater mortgages: 10,626 (19% of homes w/ loans)
> Homes with foreclosure filings: 20
[in-text-ad-2]

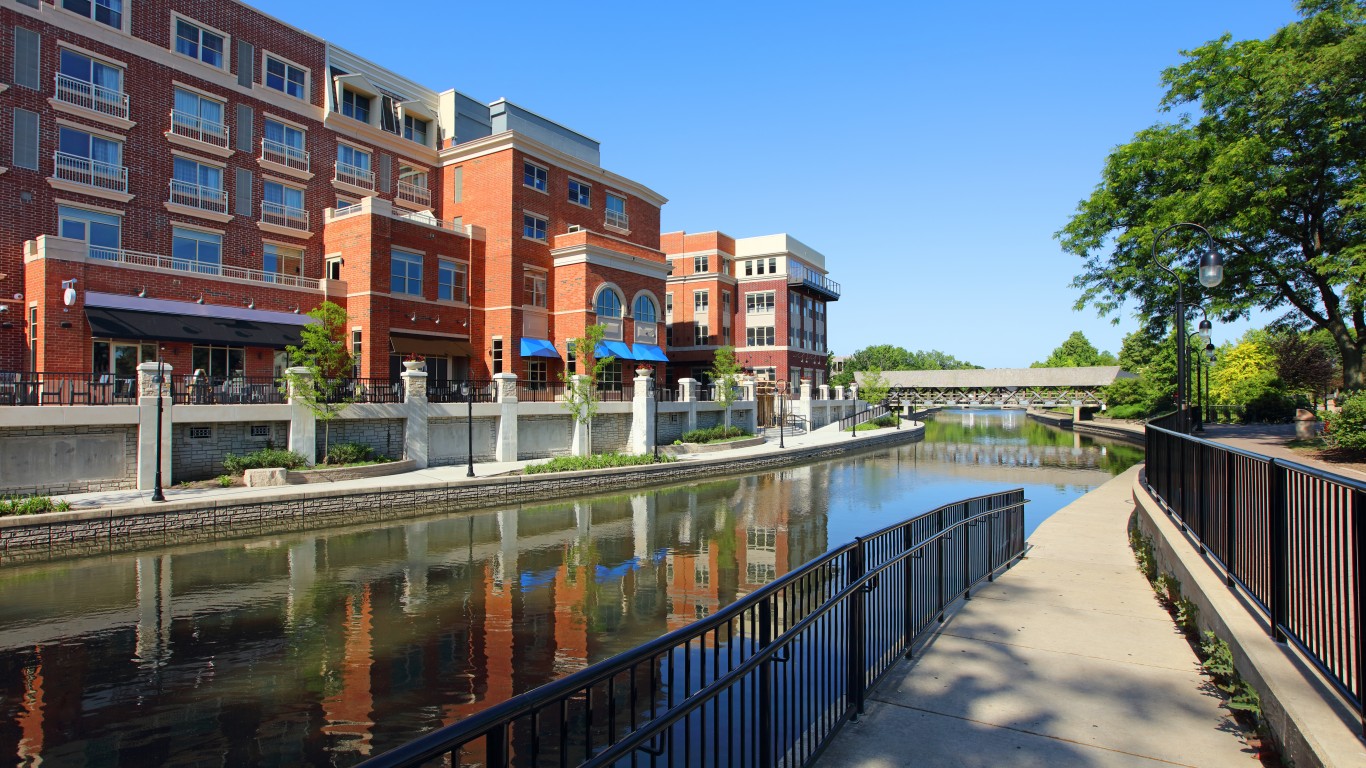
46. Kendall. Kendall, Illinois
> Location: Chicago-Naperville-Elgin, IL-IN-WI metropolitan area
> Median home sale price: $247,945 ( +30.5 1-yr. increase)
> Typical homeownership costs as a share of median income: 39.7%
> Homes with underwater mortgages: 4,117 (13.7% of homes w/ loans)
> Homes with foreclosure filings: 9
45. Du Page. Du Page, Illinois
> Location: Chicago-Naperville-Elgin, IL-IN-WI metropolitan area
> Median home sale price: $292,500 ( +7.1 1-yr. increase)
> Typical homeownership costs as a share of median income: 27.2%
> Homes with underwater mortgages: 43,372 (17.6% of homes w/ loans)
> Homes with foreclosure filings: 111
[in-text-ad]
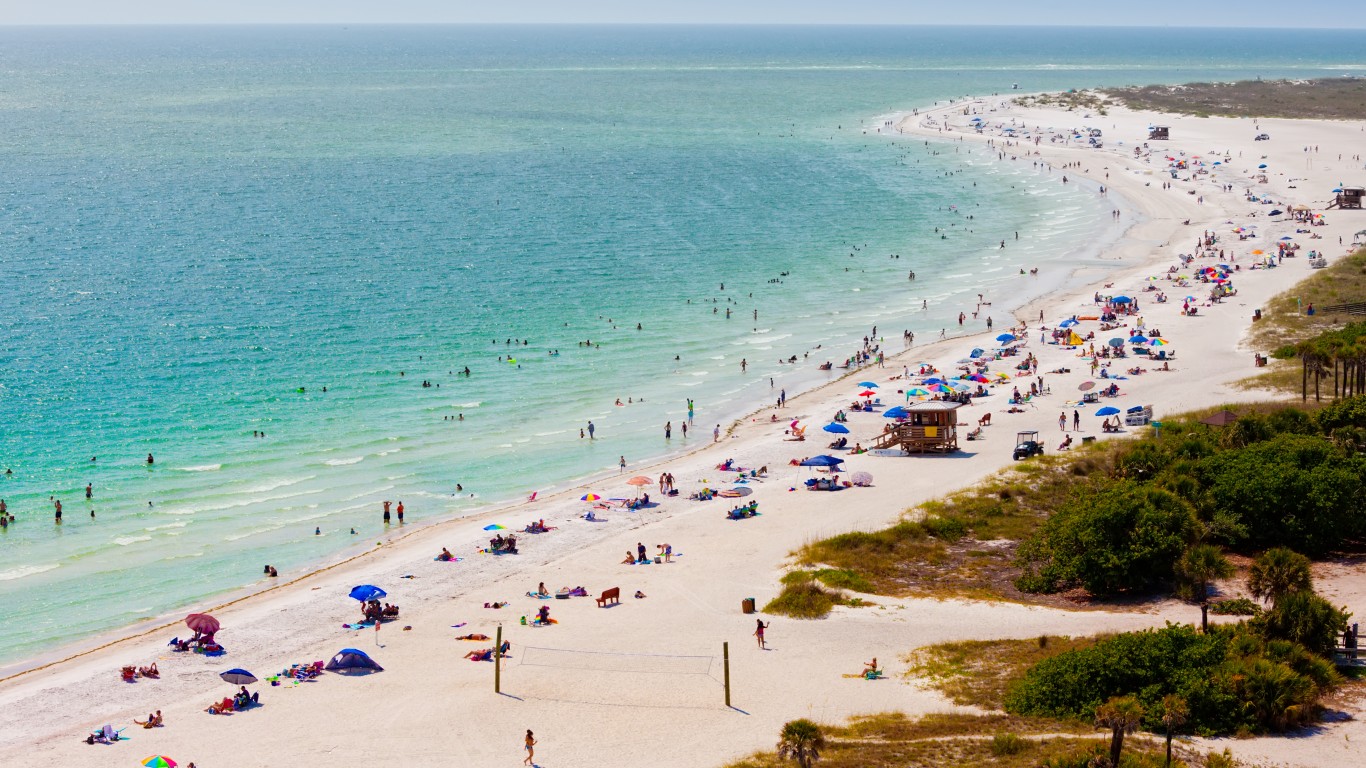
44. Manatee. Manatee, Florida
> Location: North Port-Sarasota-Bradenton, FL metropolitan area
> Median home sale price: $345,000 ( +27.8 1-yr. increase)
> Typical homeownership costs as a share of median income: 39.9%
> Homes with underwater mortgages: 9,021 (10.1% of homes w/ loans)
> Homes with foreclosure filings: 61
[recirclink id=1033291]

43. Middlesex. Middlesex, New Jersey
> Location: New York-Newark-Jersey City, NY-NJ-PA metropolitan area
> Median home sale price: $360,000 ( +16.1 1-yr. increase)
> Typical homeownership costs as a share of median income: 33.3%
> Homes with underwater mortgages: 17,466 (11.1% of homes w/ loans)
> Homes with foreclosure filings: 107

42. Berkshire. Berkshire, Massachusetts
> Location: Pittsfield, MA metropolitan area
> Median home sale price: $215,000 ( +2.4 1-yr. increase)
> Typical homeownership costs as a share of median income: 24.2%
> Homes with underwater mortgages: 5,541 (15% of homes w/ loans)
> Homes with foreclosure filings: 32
[in-text-ad-2]
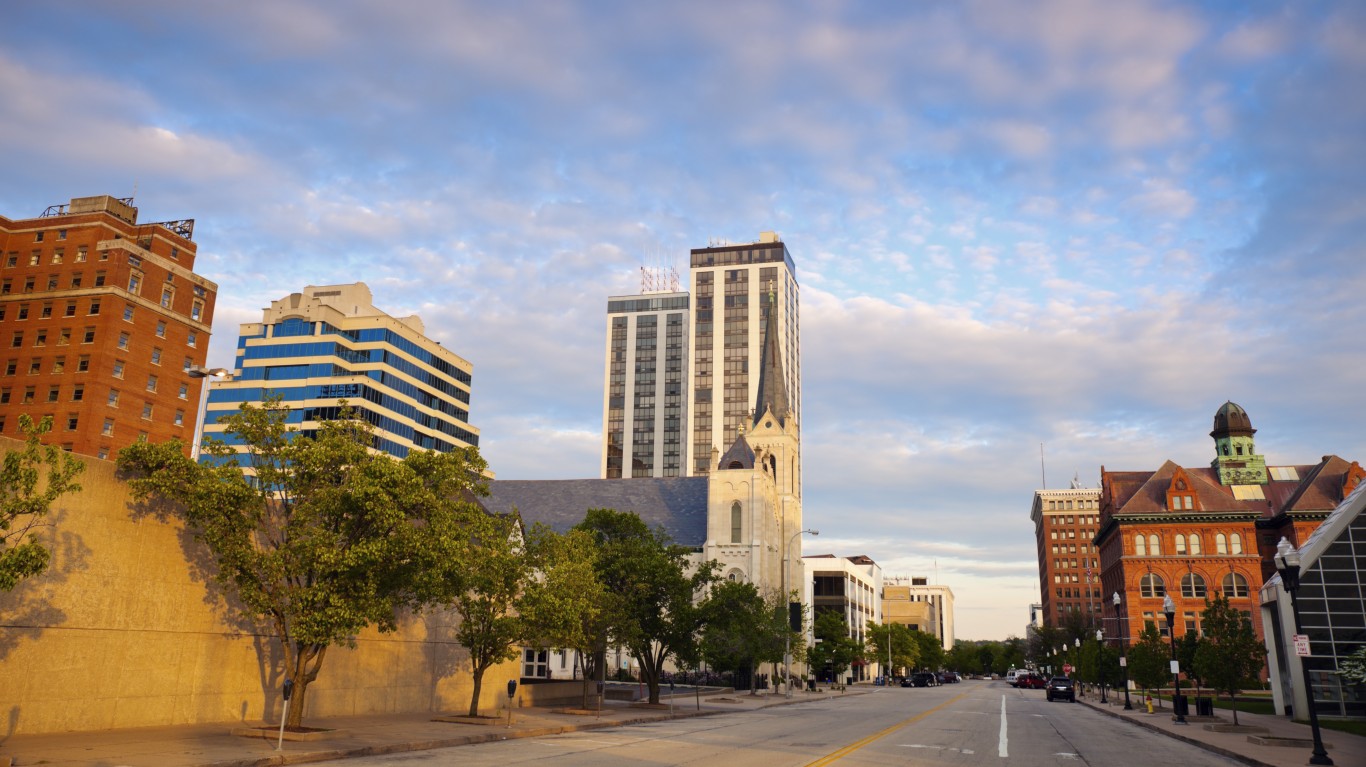
41. Tazewell. Tazewell, Illinois
> Location: Peoria, IL metropolitan area
> Median home sale price: $116,500 ( -2.9 1-yr. decrease)
> Typical homeownership costs as a share of median income: 16.7%
> Homes with underwater mortgages: 9,758 (27.5% of homes w/ loans)
> Homes with foreclosure filings: 38
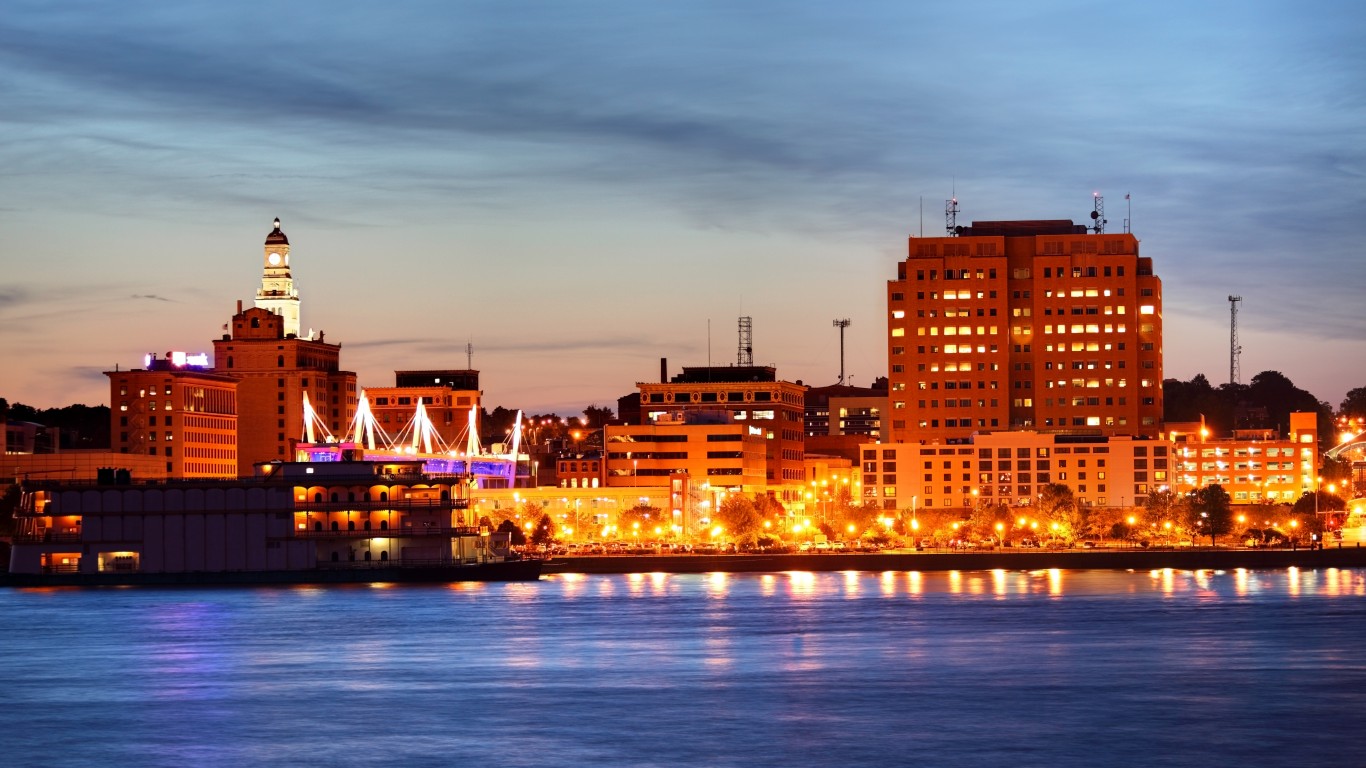
40. Scott. Scott, Iowa
> Location: Davenport-Moline-Rock Island, IA-IL metropolitan area
> Median home sale price: $175,000 ( +12.5 1-yr. increase)
> Typical homeownership costs as a share of median income: 21%
> Homes with underwater mortgages: 6,252 (17.9% of homes w/ loans)
> Homes with foreclosure filings: 38
[in-text-ad]

39. Middlesex. Middlesex, Connecticut
> Location: Hartford-West Hartford-East Hartford, CT metropolitan area
> Median home sale price: $281,847 ( +17.4 1-yr. increase)
> Typical homeownership costs as a share of median income: 29.3%
> Homes with underwater mortgages: 8,184 (17.4% of homes w/ loans)
> Homes with foreclosure filings: 21
[recirclink id=1011529]

38. Shasta. Shasta, California
> Location: Redding, CA metropolitan area
> Median home sale price: $303,000 ( +10.1 1-yr. increase)
> Typical homeownership costs as a share of median income: 31.5%
> Homes with underwater mortgages: 3,660 (10.3% of homes w/ loans)
> Homes with foreclosure filings: 39

37. Kent. Kent, Delaware
> Location: Dover, DE metropolitan area
> Median home sale price: $200,250 ( +4.4 1-yr. increase)
> Typical homeownership costs as a share of median income: 19.7%
> Homes with underwater mortgages: 3,337 (17.6% of homes w/ loans)
> Homes with foreclosure filings: 56
[in-text-ad-2]

36. Saint Tammany. Saint Tammany, Louisiana
> Location: New Orleans-Metairie, LA metropolitan area
> Median home sale price: $222,750 ( +4.3 1-yr. increase)
> Typical homeownership costs as a share of median income: 23.2%
> Homes with underwater mortgages: 8,272 (19.8% of homes w/ loans)
> Homes with foreclosure filings: 42

35. Will. Will, Illinois
> Location: Chicago-Naperville-Elgin, IL-IN-WI metropolitan area
> Median home sale price: $232,000 ( +11.0 1-yr. increase)
> Typical homeownership costs as a share of median income: 30.3%
> Homes with underwater mortgages: 26,734 (15.3% of homes w/ loans)
> Homes with foreclosure filings: 73
[in-text-ad]
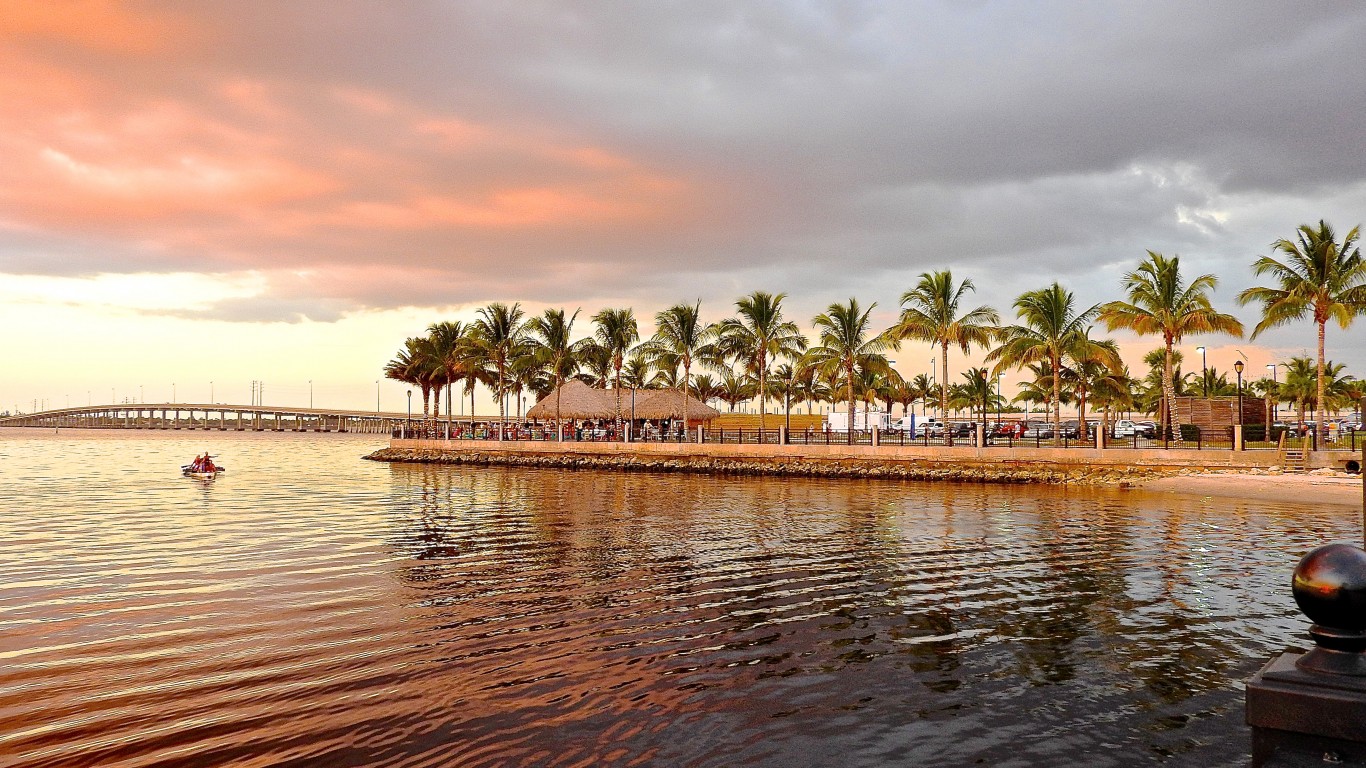
34. Charlotte. Charlotte, Florida
> Location: Punta Gorda, FL metropolitan area
> Median home sale price: $239,900 ( +9.0 1-yr. increase)
> Typical homeownership costs as a share of median income: 30.9%
> Homes with underwater mortgages: 5,081 (10.5% of homes w/ loans)
> Homes with foreclosure filings: 58
[recirclink id=1002439]
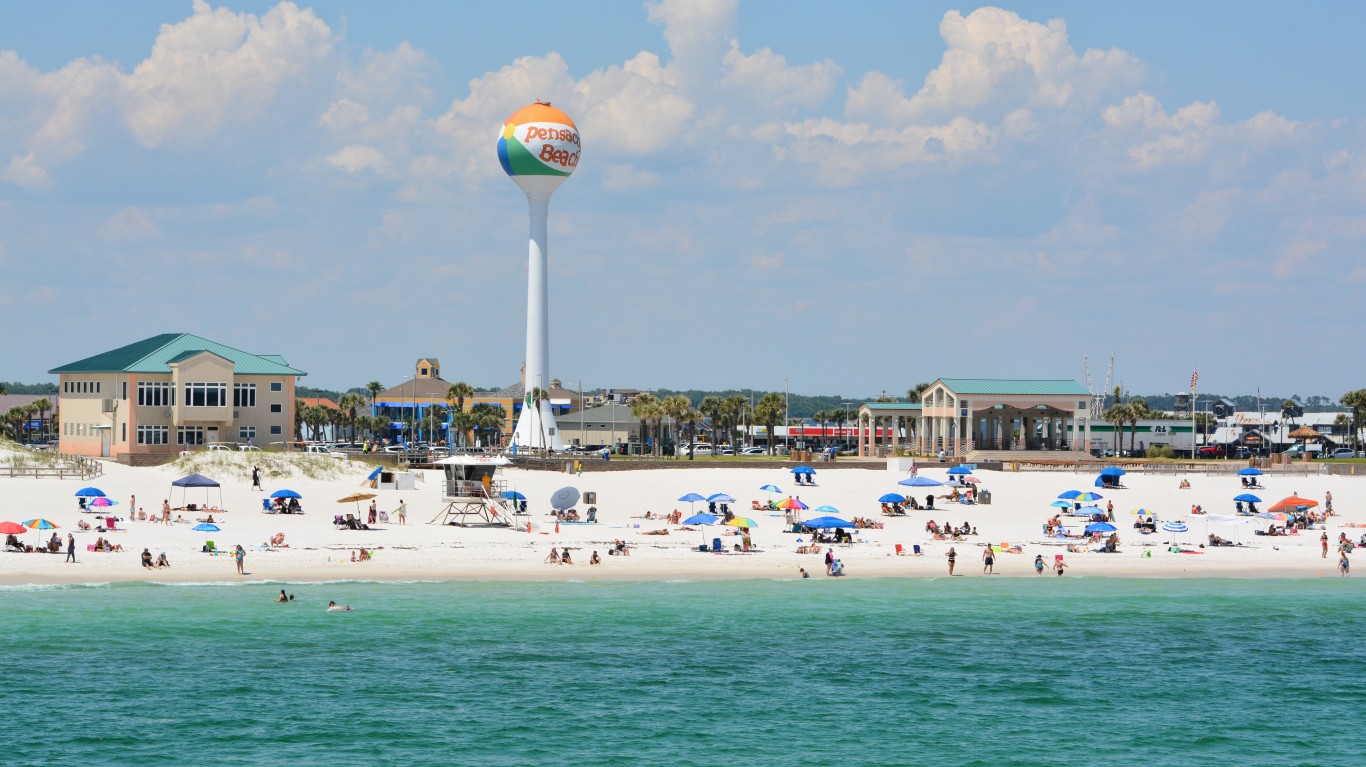
33. Escambia. Escambia, Florida
> Location: Pensacola-Ferry Pass-Brent, FL metropolitan area
> Median home sale price: $182,000 ( +10.3 1-yr. increase)
> Typical homeownership costs as a share of median income: 19.1%
> Homes with underwater mortgages: 20,922 (31% of homes w/ loans)
> Homes with foreclosure filings: 69

32. Osceola. Osceola, Florida
> Location: Orlando-Kissimmee-Sanford, FL metropolitan area
> Median home sale price: $255,000 ( +8.1 1-yr. increase)
> Typical homeownership costs as a share of median income: 33.5%
> Homes with underwater mortgages: 7,514 (10% of homes w/ loans)
> Homes with foreclosure filings: 78
[in-text-ad-2]
31. Essex. Essex, New Jersey
> Location: New York-Newark-Jersey City, NY-NJ-PA metropolitan area
> Median home sale price: $430,000 ( +26.5 1-yr. increase)
> Typical homeownership costs as a share of median income: 37.7%
> Homes with underwater mortgages: 11,670 (10.8% of homes w/ loans)
> Homes with foreclosure filings: 116

30. Walworth. Walworth, Wisconsin
> Location: Whitewater-Elkhorn, WI metropolitan area
> Median home sale price: $229,450 ( +0.7 1-yr. increase)
> Typical homeownership costs as a share of median income: 30.6%
> Homes with underwater mortgages: 3,183 (14% of homes w/ loans)
> Homes with foreclosure filings: 19
[in-text-ad]
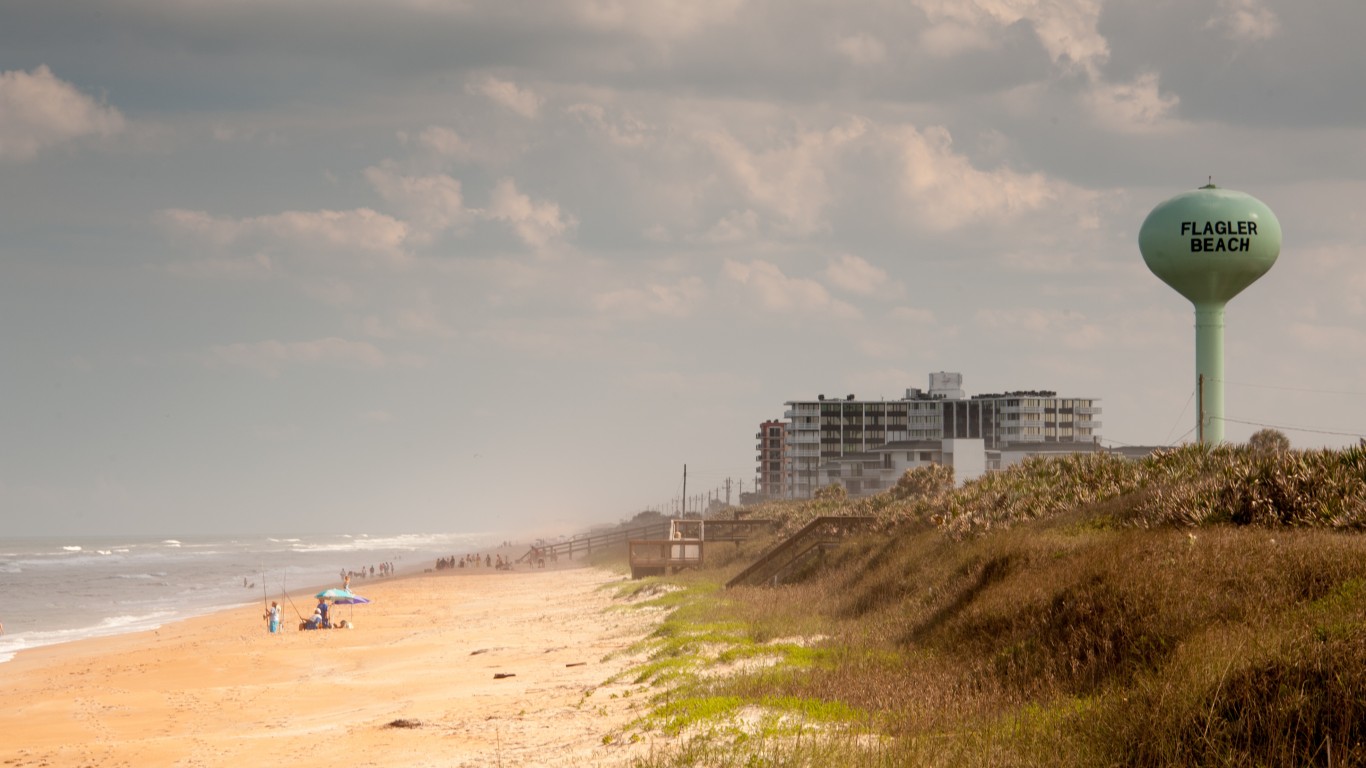
29. Flagler. Flagler, Florida
> Location: Deltona-Daytona Beach-Ormond Beach, FL metropolitan area
> Median home sale price: $268,000 ( +19.1 1-yr. increase)
> Typical homeownership costs as a share of median income: 37.6%
> Homes with underwater mortgages: 3,279 (10.4% of homes w/ loans)
> Homes with foreclosure filings: 21
[recirclink id=1053897]
28. Lake. Lake, Florida
> Location: Orlando-Kissimmee-Sanford, FL metropolitan area
> Median home sale price: $250,000 ( +9.0 1-yr. increase)
> Typical homeownership costs as a share of median income: 32%
> Homes with underwater mortgages: 8,548 (10.9% of homes w/ loans)
> Homes with foreclosure filings: 77
27. Humboldt. Humboldt, California
> Location: Eureka-Arcata-Fortuna, CA metropolitan area
> Median home sale price: $345,000 ( +15.0 1-yr. increase)
> Typical homeownership costs as a share of median income: 37.9%
> Homes with underwater mortgages: 2,296 (10.3% of homes w/ loans)
> Homes with foreclosure filings: 28
[in-text-ad-2]
26. Onslow. Onslow, North Carolina
> Location: Jacksonville, NC metropolitan area
> Median home sale price: $175,000 ( +5.9 1-yr. increase)
> Typical homeownership costs as a share of median income: 22.6%
> Homes with underwater mortgages: 6,980 (16.9% of homes w/ loans)
> Homes with foreclosure filings: 56

25. Kane. Kane, Illinois
> Location: Chicago-Naperville-Elgin, IL-IN-WI metropolitan area
> Median home sale price: $225,000 ( +3.2 1-yr. increase)
> Typical homeownership costs as a share of median income: 28.6%
> Homes with underwater mortgages: 21,450 (17.8% of homes w/ loans)
> Homes with foreclosure filings: 70
[in-text-ad]

24. Tolland. Tolland, Connecticut
> Location: Hartford-West Hartford-East Hartford, CT metropolitan area
> Median home sale price: $255,000 ( +21.4 1-yr. increase)
> Typical homeownership costs as a share of median income: 30.7%
> Homes with underwater mortgages: 6,889 (18.4% of homes w/ loans)
> Homes with foreclosure filings: 18
[recirclink id=1048901]

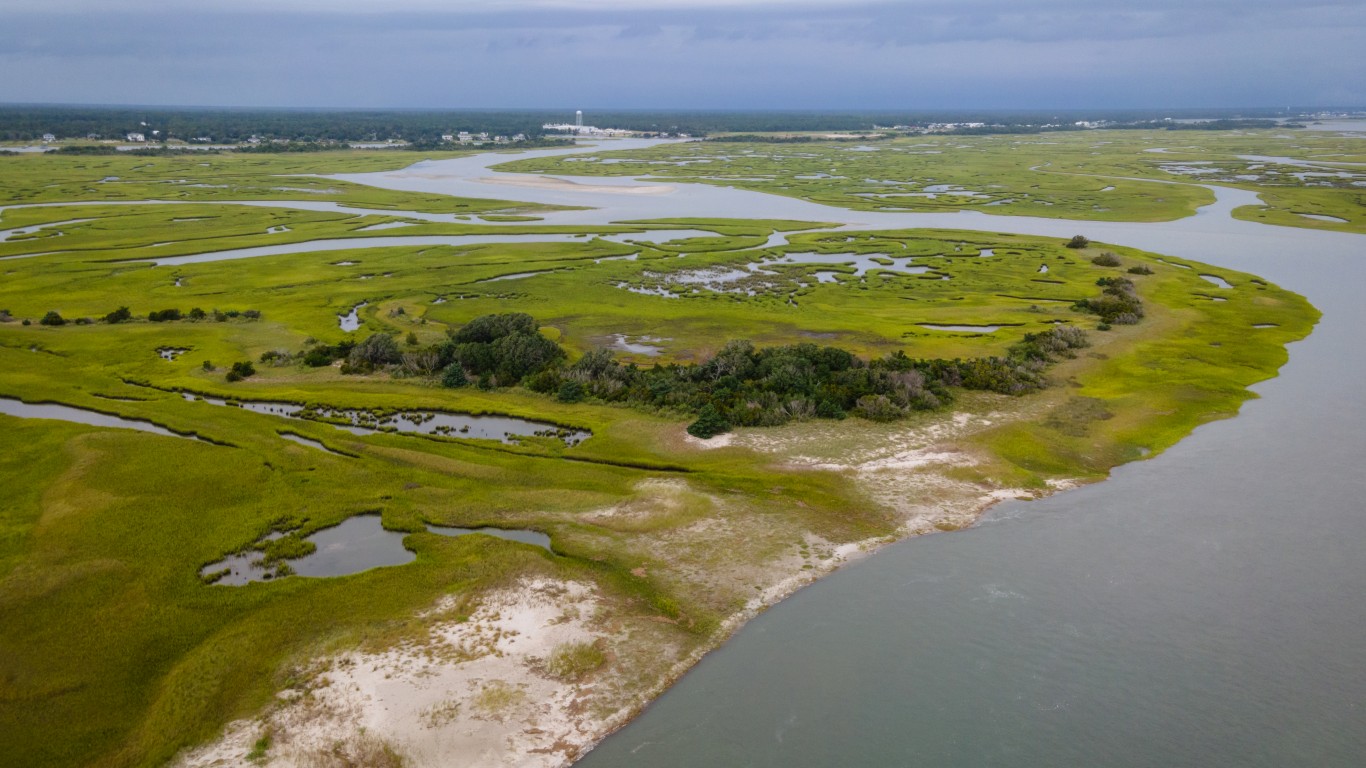
23. Beaufort. Beaufort, South Carolina
> Location: Hilton Head Island-Bluffton-Beaufort, SC metropolitan area
> Median home sale price: $372,500 ( +22.1 1-yr. increase)
> Typical homeownership costs as a share of median income: 43.6%
> Homes with underwater mortgages: 7,107 (13.8% of homes w/ loans)
> Homes with foreclosure filings: 27
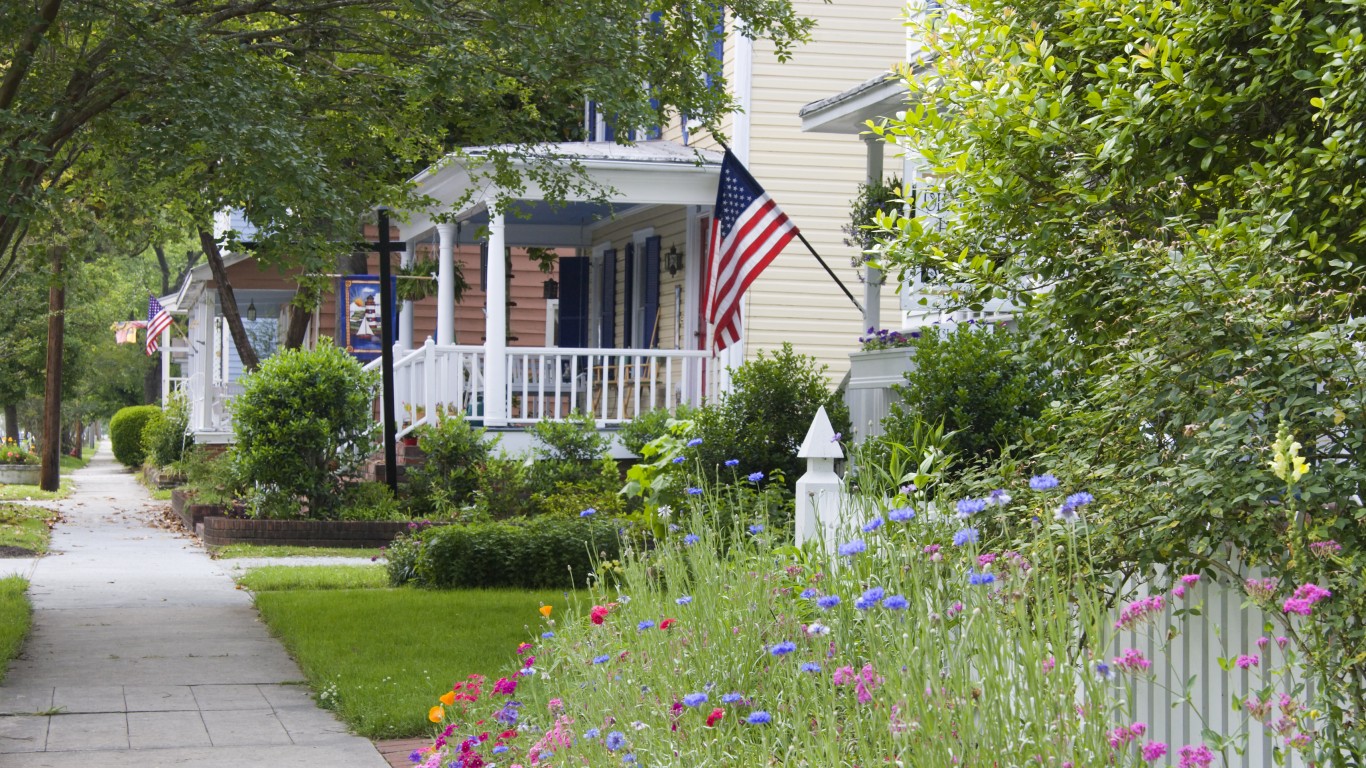
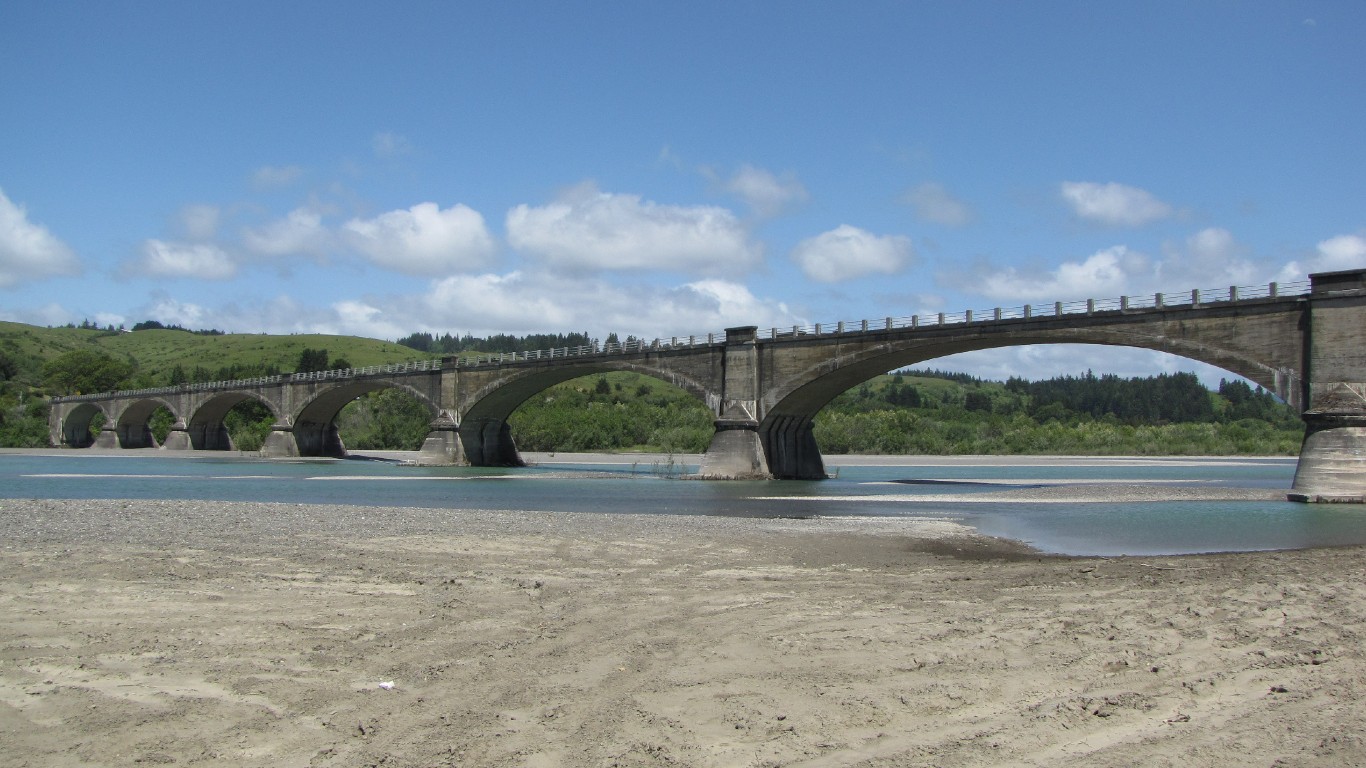
22. Craven. Craven, North Carolina
> Location: New Bern, NC metropolitan area
> Median home sale price: $195,000 ( +16.1 1-yr. increase)
> Typical homeownership costs as a share of median income: 20.7%
> Homes with underwater mortgages: 4,007 (23.3% of homes w/ loans)
> Homes with foreclosure filings: 31
[in-text-ad-2]

21. Caddo. Caddo, Louisiana
> Location: Shreveport-Bossier City, LA metropolitan area
> Median home sale price: $166,000 ( +27.7 1-yr. increase)
> Typical homeownership costs as a share of median income: 19.2%
> Homes with underwater mortgages: 9,011 (27.7% of homes w/ loans)
> Homes with foreclosure filings: 112

20. Cumberland. Cumberland, New Jersey
> Location: Vineland-Bridgeton, NJ metropolitan area
> Median home sale price: $167,900 ( +34.3 1-yr. increase)
> Typical homeownership costs as a share of median income: 24.5%
> Homes with underwater mortgages: 6,725 (24.2% of homes w/ loans)
> Homes with foreclosure filings: 25
[in-text-ad]
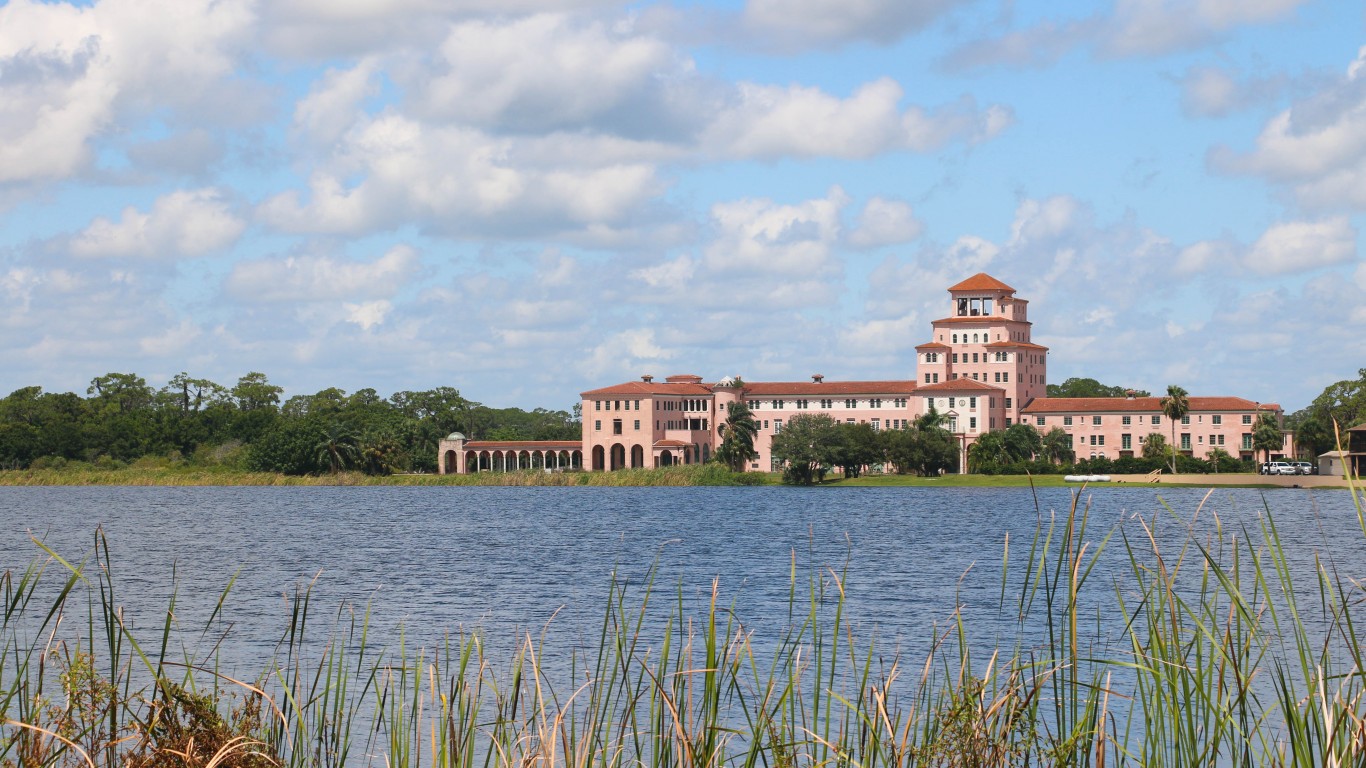
19. Highlands. Highlands, Florida
> Location: Sebring, FL metropolitan area
> Median home sale price: $175,000 ( +22.8 1-yr. increase)
> Typical homeownership costs as a share of median income: 24.1%
> Homes with underwater mortgages: 3,181 (16.8% of homes w/ loans)
> Homes with foreclosure filings: 198
[recirclink id=1033291]
18. Ocean. Ocean, New Jersey
> Location: New York-Newark-Jersey City, NY-NJ-PA metropolitan area
> Median home sale price: $324,900 ( +29.7 1-yr. increase)
> Typical homeownership costs as a share of median income: 39.6%
> Homes with underwater mortgages: 18,659 (10.8% of homes w/ loans)
> Homes with foreclosure filings: 130

17. De Kalb. De Kalb, Illinois
> Location: Chicago-Naperville-Elgin, IL-IN-WI metropolitan area
> Median home sale price: $223,875 ( +42.6 1-yr. increase)
> Typical homeownership costs as a share of median income: 32.4%
> Homes with underwater mortgages: 3,183 (15.1% of homes w/ loans)
> Homes with foreclosure filings: 16
[in-text-ad-2]

16. Sussex. Sussex, Delaware
> Location: Salisbury, MD-DE metropolitan area
> Median home sale price: $312,950 ( +16.3 1-yr. increase)
> Typical homeownership costs as a share of median income: 31.4%
> Homes with underwater mortgages: 9,496 (13.8% of homes w/ loans)
> Homes with foreclosure filings: 66

15. Tangipahoa. Tangipahoa, Louisiana
> Location: Hammond, LA metropolitan area
> Median home sale price: $174,250 ( +9.6 1-yr. increase)
> Typical homeownership costs as a share of median income: 21.5%
> Homes with underwater mortgages: 5,039 (25.6% of homes w/ loans)
> Homes with foreclosure filings: 37
[in-text-ad]
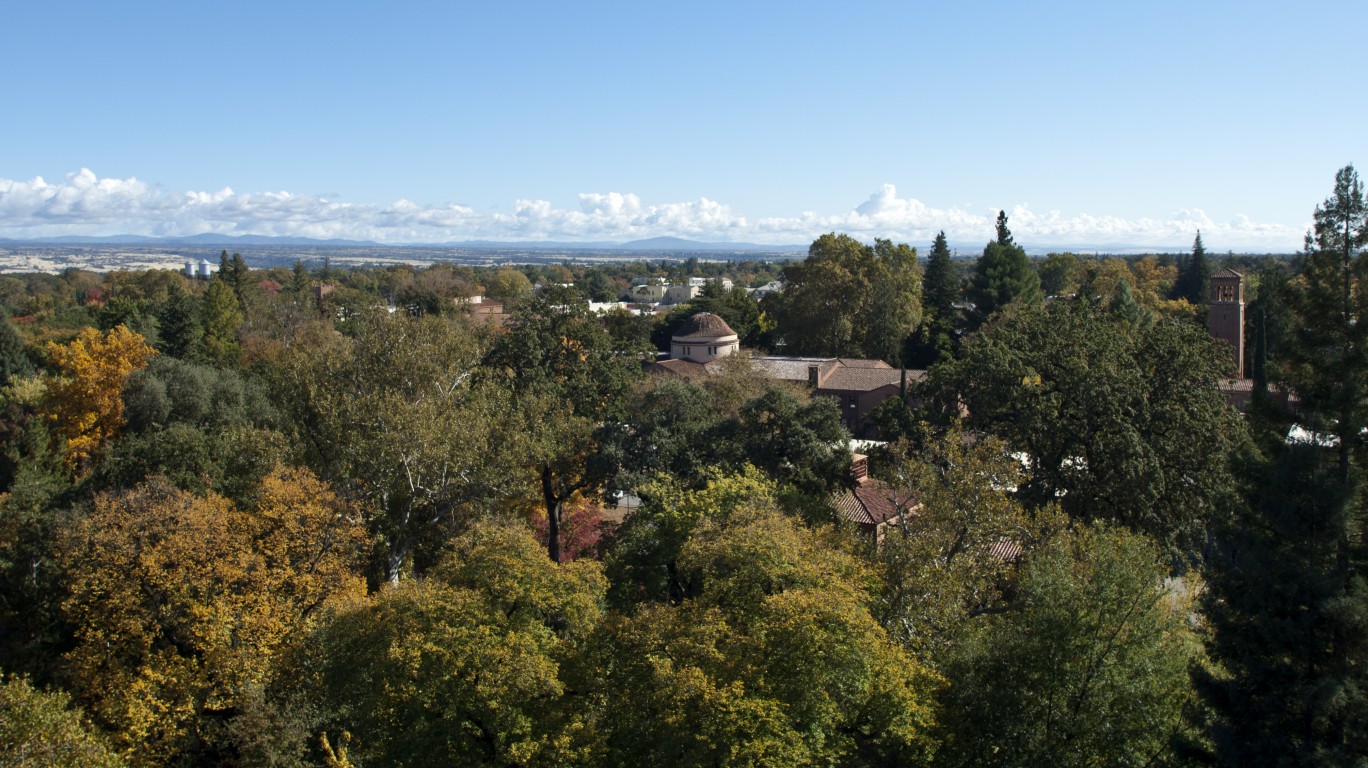
14. Butte. Butte, California
> Location: Chico, CA metropolitan area
> Median home sale price: $264,000 ( +1.5 1-yr. increase)
> Typical homeownership costs as a share of median income: 27.8%
> Homes with underwater mortgages: 8,240 (19.6% of homes w/ loans)
> Homes with foreclosure filings: 44
[recirclink id=1011529]

13. Charles. Charles, Maryland
> Location: Washington-Arlington-Alexandria, DC-VA-MD-WV metropolitan area
> Median home sale price: $330,000 ( +14.8 1-yr. increase)
> Typical homeownership costs as a share of median income: 35.1%
> Homes with underwater mortgages: 6,325 (13.9% of homes w/ loans)
> Homes with foreclosure filings: 23

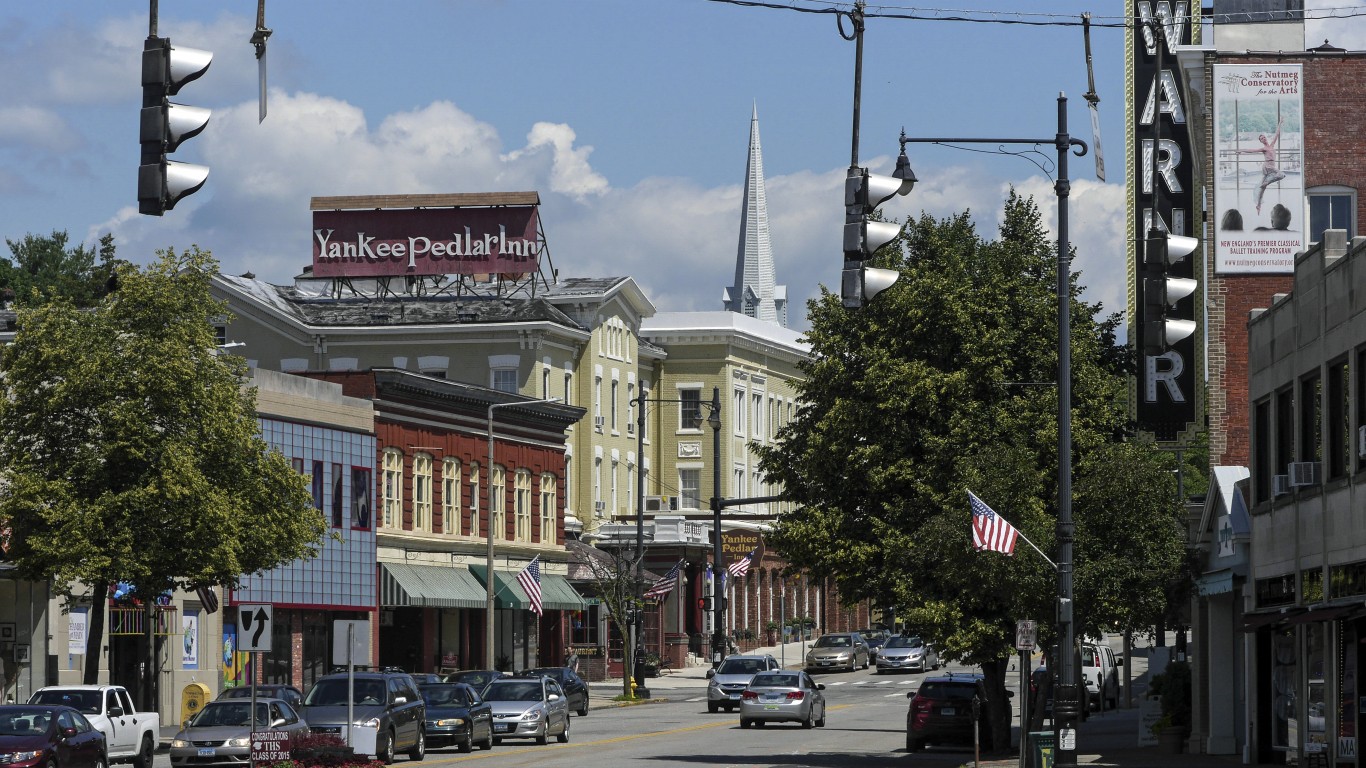
12. Windham. Windham, Connecticut
> Location: Worcester, MA-CT metropolitan area
> Median home sale price: $235,000 ( +18.1 1-yr. increase)
> Typical homeownership costs as a share of median income: 29.1%
> Homes with underwater mortgages: 4,015 (14.3% of homes w/ loans)
> Homes with foreclosure filings: 29
[in-text-ad-2]
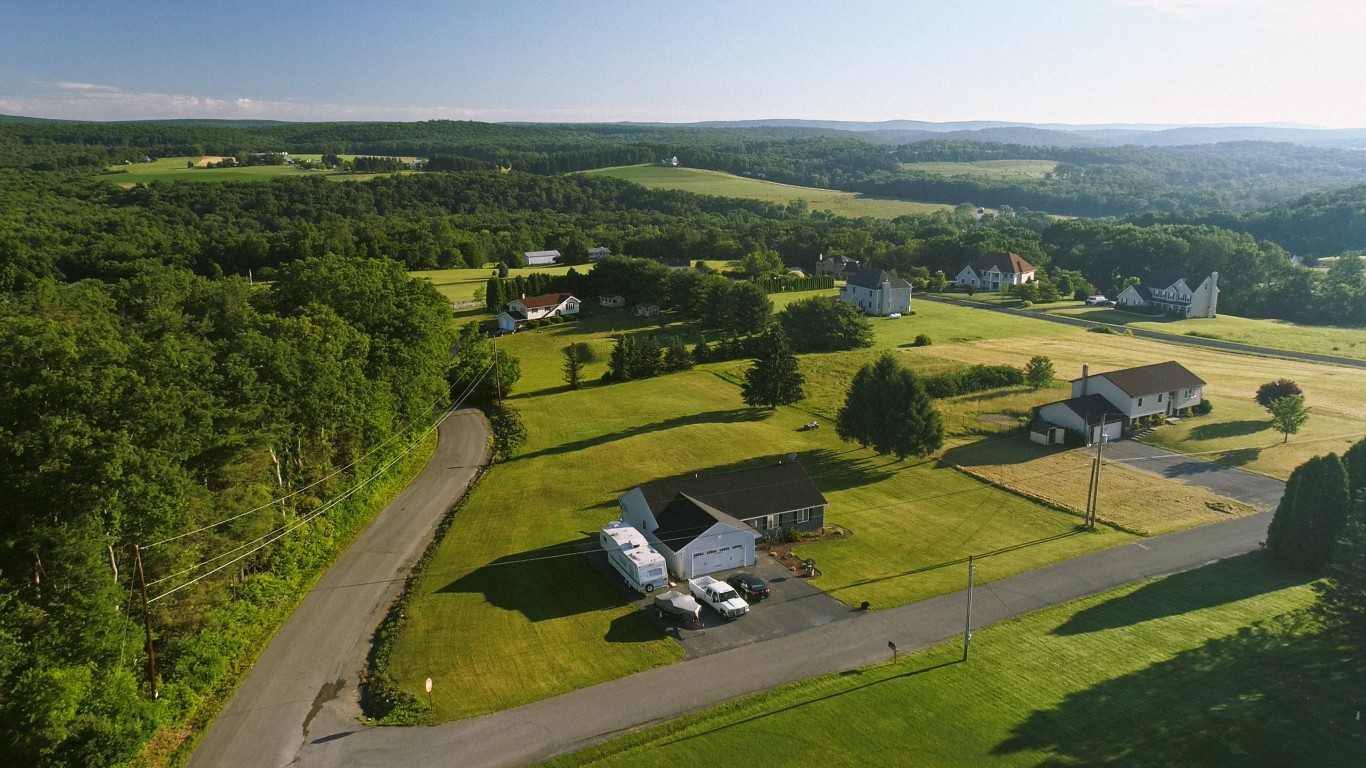
11. Monroe. Monroe, Pennsylvania
> Location: East Stroudsburg, PA metropolitan area
> Median home sale price: $190,000 ( +31.0 1-yr. increase)
> Typical homeownership costs as a share of median income: 27.9%
> Homes with underwater mortgages: 7,656 (18.3% of homes w/ loans)
> Homes with foreclosure filings: 41
10. Litchfield. Litchfield, Connecticut
> Location: Torrington, CT metropolitan area
> Median home sale price: $257,500 ( +28.8 1-yr. increase)
> Typical homeownership costs as a share of median income: 30.6%
> Homes with underwater mortgages: 9,643 (18.2% of homes w/ loans)
> Homes with foreclosure filings: 37
[in-text-ad]

9. Livingston. Livingston, Louisiana
> Location: Baton Rouge, LA metropolitan area
> Median home sale price: $197,000 ( +15.1 1-yr. increase)
> Typical homeownership costs as a share of median income: 24.9%
> Homes with underwater mortgages: 5,810 (25% of homes w/ loans)
> Homes with foreclosure filings: 29
[recirclink id=1002439]
 by Organizedchaos02")
8. Indian River. Indian River, Florida
> Location: Sebastian-Vero Beach, FL metropolitan area
> Median home sale price: $235,000 ( +4.4 1-yr. increase)
> Typical homeownership costs as a share of median income: 26.6%
> Homes with underwater mortgages: 6,560 (17.3% of homes w/ loans)
> Homes with foreclosure filings: 77
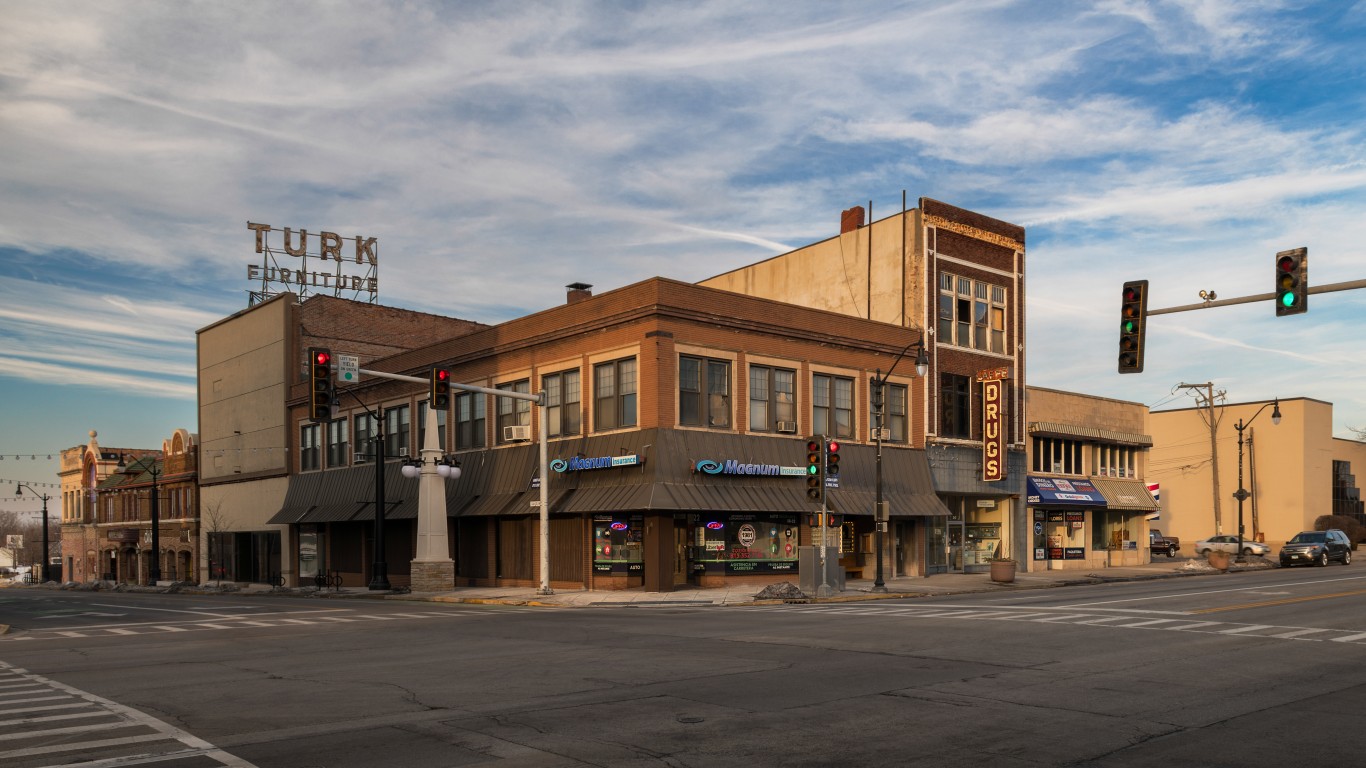
7. Kankakee. Kankakee, Illinois
> Location: Kankakee, IL metropolitan area
> Median home sale price: $147,300 ( +13.5 1-yr. increase)
> Typical homeownership costs as a share of median income: 21.5%
> Homes with underwater mortgages: 7,004 (38.4% of homes w/ loans)
> Homes with foreclosure filings: 147
[in-text-ad-2]
6. Lake. Lake, Illinois
> Location: Chicago-Naperville-Elgin, IL-IN-WI metropolitan area
> Median home sale price: $290,000 ( +25.0 1-yr. increase)
> Typical homeownership costs as a share of median income: 25.3%
> Homes with underwater mortgages: 44,032 (24.7% of homes w/ loans)
> Homes with foreclosure filings: 169

5. Clay. Clay, Florida
> Location: Jacksonville, FL metropolitan area
> Median home sale price: $250,000 ( +18.5 1-yr. increase)
> Typical homeownership costs as a share of median income: 31%
> Homes with underwater mortgages: 7,997 (16.6% of homes w/ loans)
> Homes with foreclosure filings: 57
[in-text-ad]
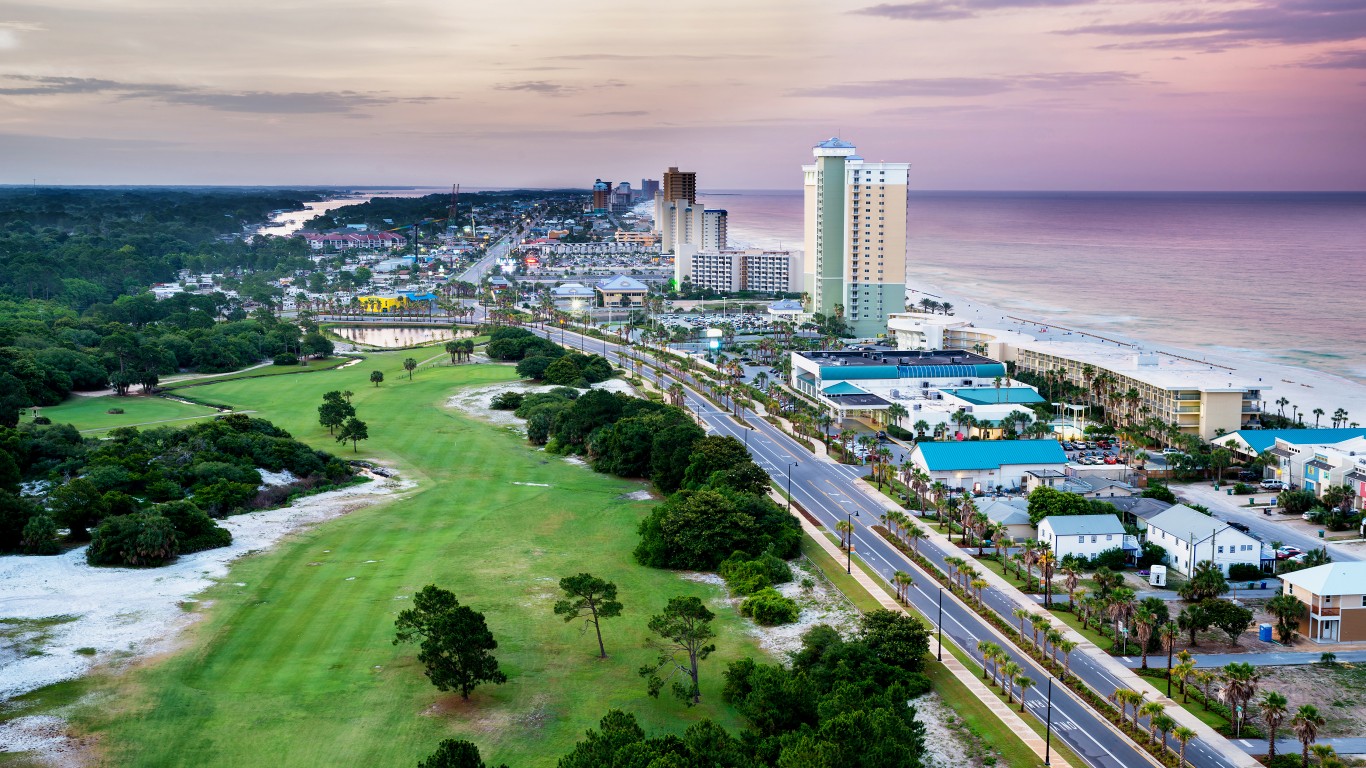
4. Bay. Bay, Florida
> Location: Panama City, FL metropolitan area
> Median home sale price: $262,213 ( +14.0 1-yr. increase)
> Typical homeownership costs as a share of median income: 28.9%
> Homes with underwater mortgages: 10,407 (22.9% of homes w/ loans)
> Homes with foreclosure filings: 55
[recirclink id=1053897]

3. Mchenry. Mchenry, Illinois
> Location: Chicago-Naperville-Elgin, IL-IN-WI metropolitan area
> Median home sale price: $235,506 ( +9.8 1-yr. increase)
> Typical homeownership costs as a share of median income: 33.7%
> Homes with underwater mortgages: 16,493 (18.6% of homes w/ loans)
> Homes with foreclosure filings: 70

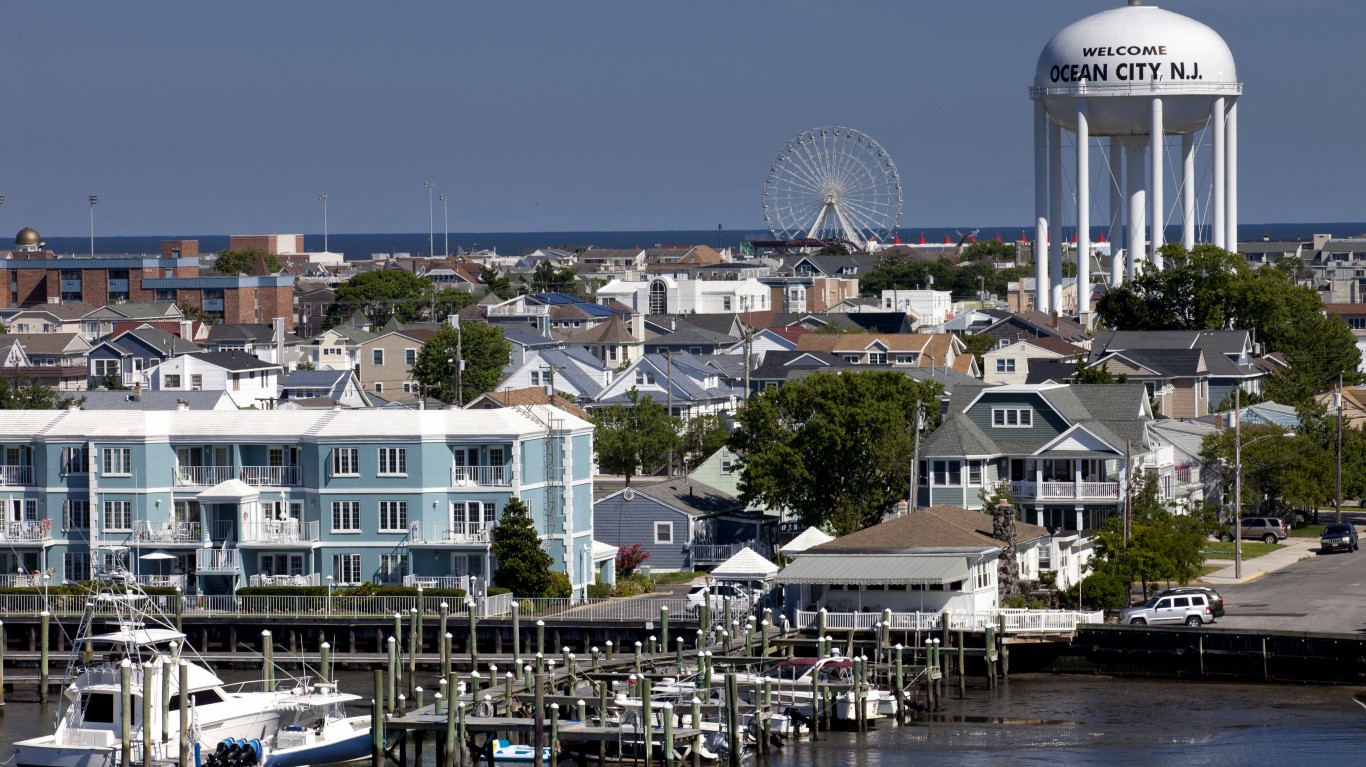
2. Atlantic. Atlantic, New Jersey
> Location: Atlantic City-Hammonton, NJ metropolitan area
> Median home sale price: $244,500 ( +40.5 1-yr. increase)
> Typical homeownership costs as a share of median income: 31.7%
> Homes with underwater mortgages: 17,354 (24.4% of homes w/ loans)
> Homes with foreclosure filings: 89
[in-text-ad-2]

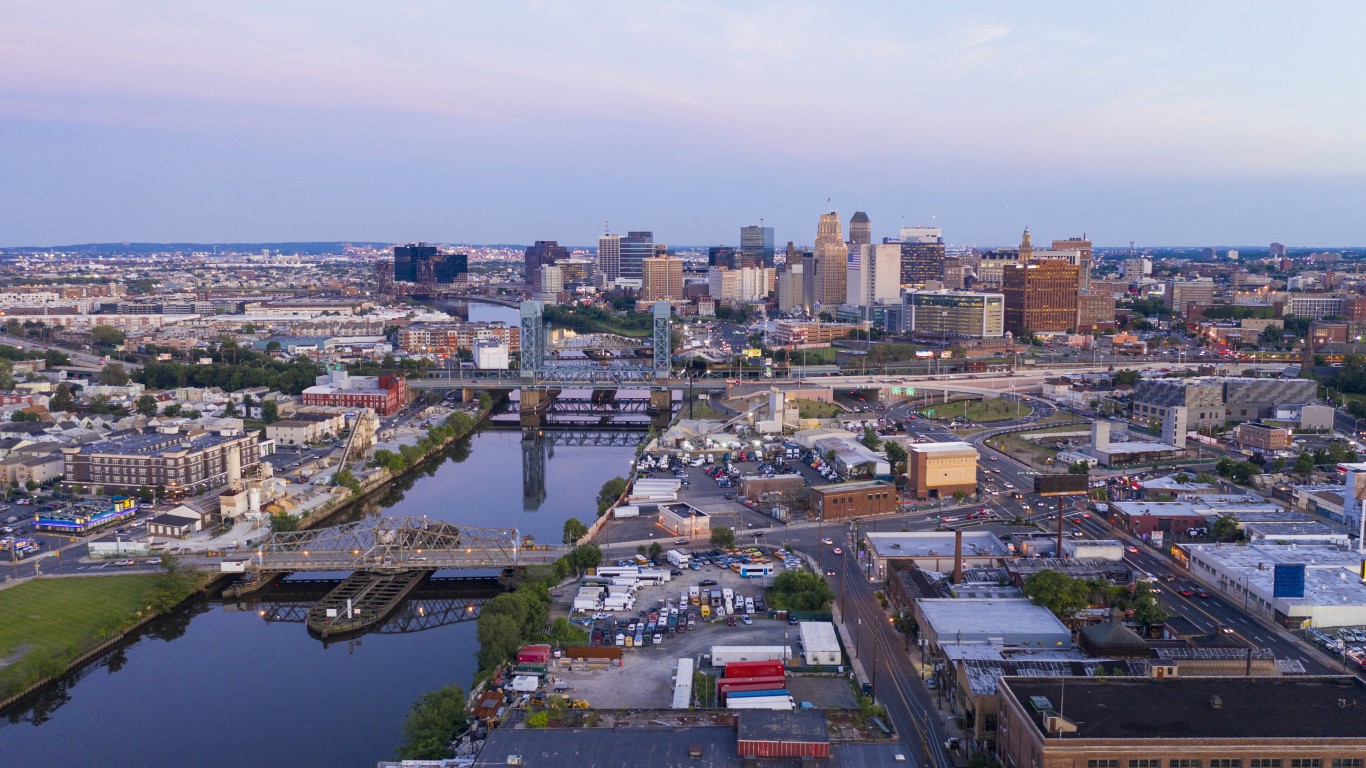
1. Sussex. Sussex, New Jersey
> Location: New York-Newark-Jersey City, NY-NJ-PA metropolitan area
> Median home sale price: $293,545 ( +30.5 1-yr. increase)
> Typical homeownership costs as a share of median income: 40.6%
> Homes with underwater mortgages: 7,646 (18.3% of homes w/ loans)
> Homes with foreclosure filings: 45