
The recent headline job numbers would appear to be positive. The economy added 253,000 jobs in April, and the unemployment rate fell from 3.5% in March to 3.4% – same as the 53-year low hit in January. The longer-term outlook, however, tells a gloomier story. Globalization and technological advancements such as artificial intelligence continue to disrupt the workplace, causing what some economists like to call a creative destruction of some jobs.
To determine America’s 25 dying industries, 24/7 Wall St. reviewed employment data from the Bureau of Labor Statistics’ Occupational Employment and Wage Statistics program. Detailed industries – at the 6-digit level of North American Industry Classification System aggregation – were ranked based on percentage change in employment from 2011 to 2021. Supplemental data on average annual wages also came from the BLS.
Every industry on our list has experienced a drop in employment from 2011 to 2021 of more than 51%. Two sectors in the crosshairs of change stand out – energy and publishing. (Also see, jobs that used to be common but no longer exist.)
In five energy categories, employment declined by at least 57% from 2011 to 2021. These are bituminous coal underground mining; drilling oil and gas wells; bituminous coal and lignite surface mining; support activities for coal mining; and uranium-radium-vanadium ore mining. Workers in these sectors are also relatively highly paid, earning more than $90,000 a year.
Among publishers, the hardest hit in terms of employment decline were newspaper publishers; newsprint mills; directory and mailing list publishers; and greeting-card publishers. The latter group saw a drop of 12.2% in average annual wage from 2011 to 2021, the most of any industry.
The financial sector, with some of the highest-paying jobs on our list, has suffered some of the largest job reductions. (These are the industries laying off the most workers.)
Click here to see Americas 25 dying industries.
25. Tobacco farming
> Change in employment, 2011 to 2021: -51.2%
> Total employment, 2021: 1,977
> Change in avg. annual wage, 2011 to 2021: +55.9%
> Avg. annual wage, 2021: $34,051
[in-text-ad]

24. Diet and weight reducing centers
> Change in employment, 2011 to 2021: -54.0%
> Total employment, 2021: 14,648
> Change in avg. annual wage, 2011 to 2021: +89.1%
> Avg. annual wage, 2021: $36,364

23. Photofinishing laboratories, except one-hour
> Change in employment, 2011 to 2021: -55.6%
> Total employment, 2021: 5,650
> Change in avg. annual wage, 2011 to 2021: +27.0%
> Avg. annual wage, 2021: $59,918

22. Newspaper publishers
> Change in employment, 2011 to 2021: -57.2%
> Total employment, 2021: 102,521
> Change in avg. annual wage, 2011 to 2021: +45.2%
> Avg. annual wage, 2021: $63,720
[in-text-ad-2]

21. Junior colleges
> Change in employment, 2011 to 2021: -57.3%
> Total employment, 2021: 21,772
> Change in avg. annual wage, 2011 to 2021: +25.7%
> Avg. annual wage, 2021: $48,737
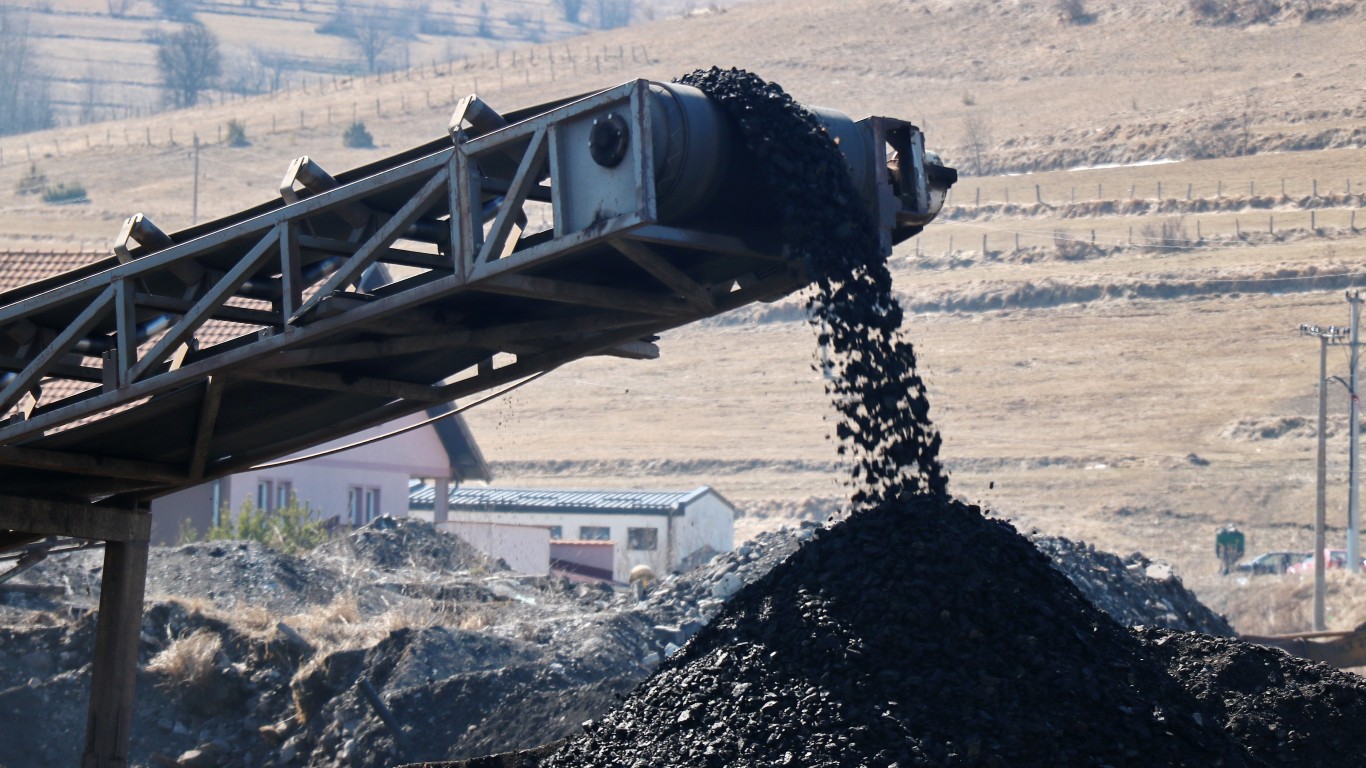
20. Bituminous coal underground mining
> Change in employment, 2011 to 2021: -57.4%
> Total employment, 2021: 20,126
> Change in avg. annual wage, 2011 to 2021: +12.5%
> Avg. annual wage, 2021: $95,269
[in-text-ad]

19. Drilling oil and gas wells
> Change in employment, 2011 to 2021: -57.6%
> Total employment, 2021: 37,043
> Change in avg. annual wage, 2011 to 2021: +14.6%
> Avg. annual wage, 2021: $103,443
 24/7 Wall St.
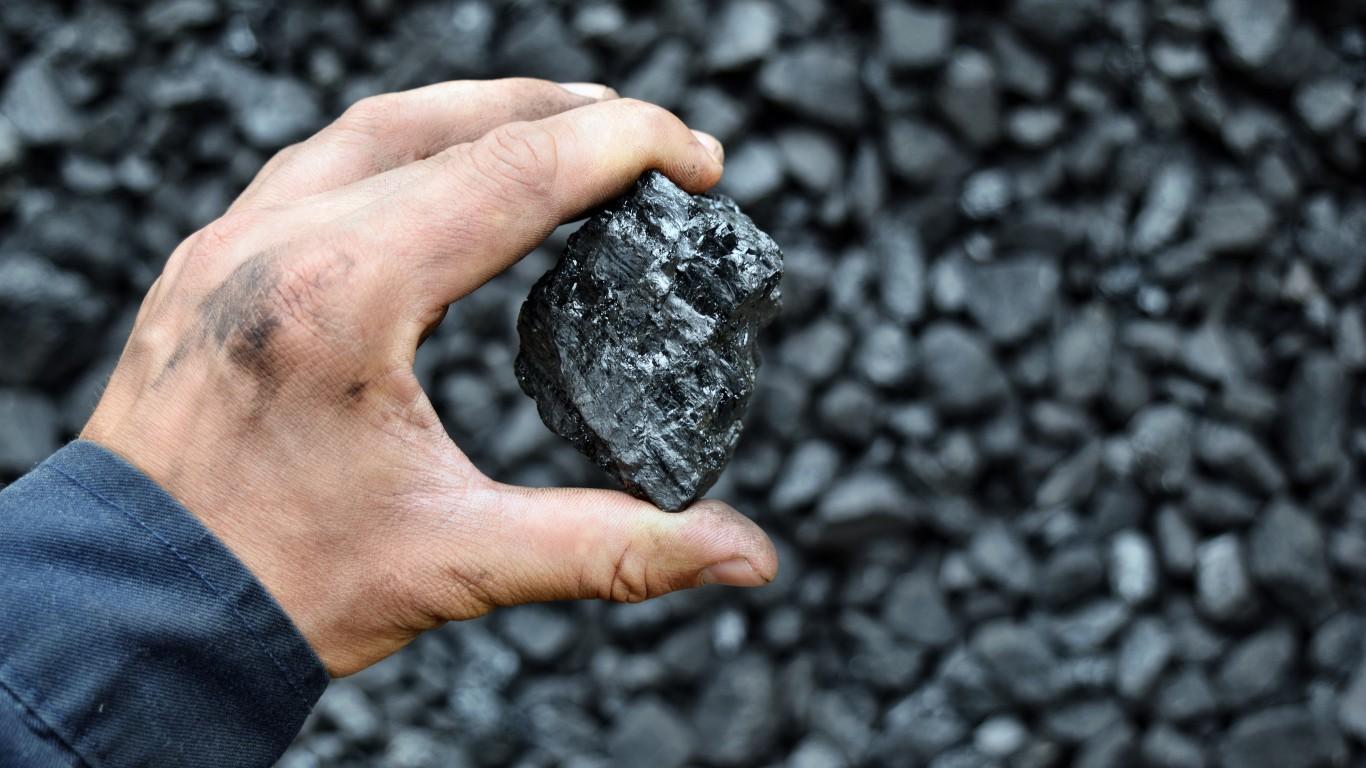
18. Bituminous coal and lignite surface mining
> Change in employment, 2011 to 2021: -57.9%
> Total employment, 2021: 16,262
> Change in avg. annual wage, 2011 to 2021: +20.5%
> Avg. annual wage, 2021: $93,605

17. Photographic film and chemical manufacturing
> Change in employment, 2011 to 2021: -59.1%
> Total employment, 2021: 7,164
> Change in avg. annual wage, 2011 to 2021: +23.0%
> Avg. annual wage, 2021: $77,342
[in-text-ad-2]

16. Newsprint mills
> Change in employment, 2011 to 2021: -59.4%
> Total employment, 2021: 3,049
> Change in avg. annual wage, 2011 to 2021: +14.8%
> Avg. annual wage, 2021: $89,756

15. Children’s and infants’ clothing stores
> Change in employment, 2011 to 2021: -59.9%
> Total employment, 2021: 30,544
> Change in avg. annual wage, 2011 to 2021: +61.9%
> Avg. annual wage, 2021: $22,957
[in-text-ad]

14. Primary battery manufacturing
> Change in employment, 2011 to 2021: -60.0%
> Total employment, 2021: 4,818
> Change in avg. annual wage, 2011 to 2021: +44.6%
> Avg. annual wage, 2021: $79,520

13. Support activities for coal mining
> Change in employment, 2011 to 2021: -60.7%
> Total employment, 2021: 3,657
> Change in avg. annual wage, 2011 to 2021: +22.8%
> Avg. annual wage, 2021: $78,613

12. Directory and mailing list publishers
> Change in employment, 2011 to 2021: -61.1%
> Total employment, 2021: 12,394
> Change in avg. annual wage, 2011 to 2021: +27.2%
> Avg. annual wage, 2021: $87,586
[in-text-ad-2]

11. Trusts, estates, and agency accounts
> Change in employment, 2011 to 2021: -61.4%
> Total employment, 2021: 3,373
> Change in avg. annual wage, 2011 to 2021: +129.0%
> Avg. annual wage, 2021: $176,319

10. Greeting card publishers
> Change in employment, 2011 to 2021: -64.1%
> Total employment, 2021: 2,971
> Change in avg. annual wage, 2011 to 2021: -12.2%
> Avg. annual wage, 2021: $59,024
[in-text-ad]
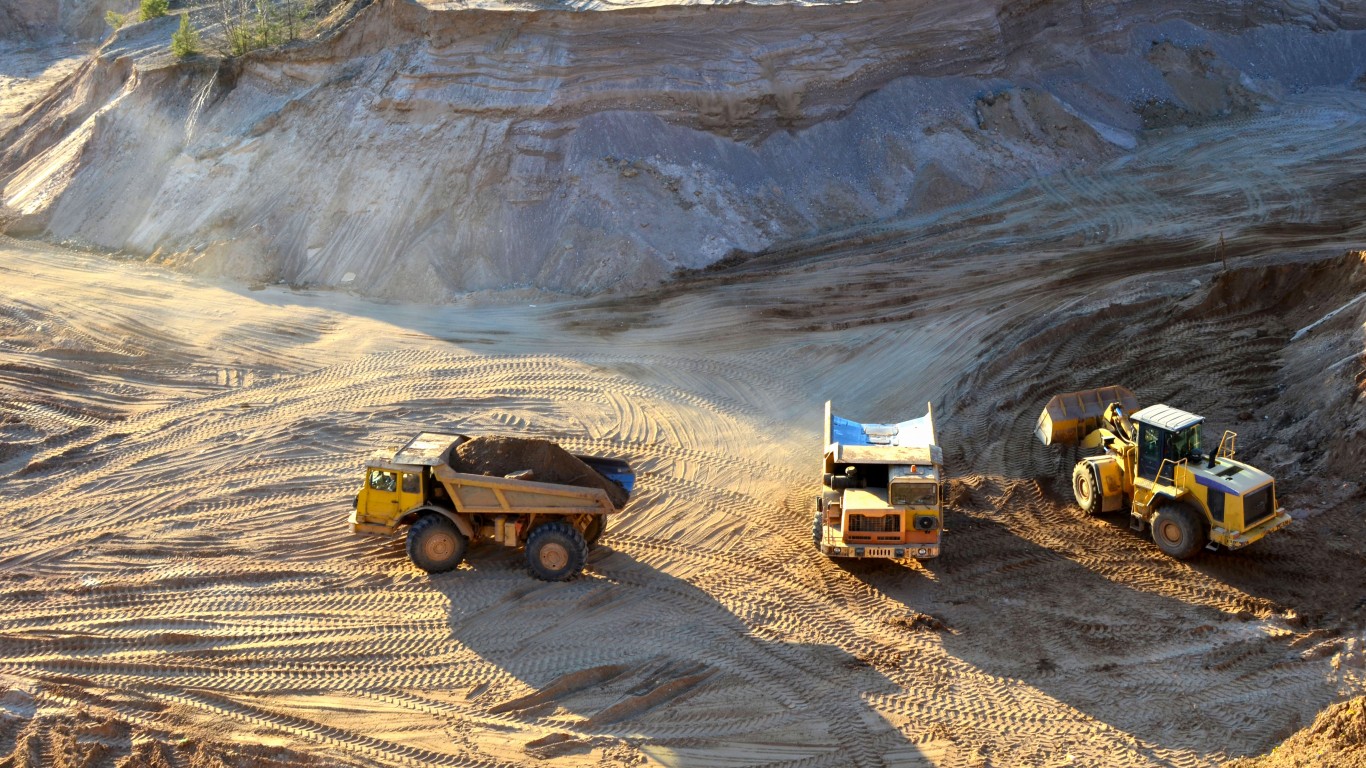
9. Uranium-radium-vanadium ore mining
> Change in employment, 2011 to 2021: -64.7%
> Total employment, 2021: 359
> Change in avg. annual wage, 2011 to 2021: +24.7%
> Avg. annual wage, 2021: $95,815
 24/7 Wall St.
8. Port and harbor operations
> Change in employment, 2011 to 2021: -65.0%
> Total employment, 2021: 6,383
> Change in avg. annual wage, 2011 to 2021: -3.1%
> Avg. annual wage, 2021: $80,004

7. Private households
> Change in employment, 2011 to 2021: -65.9%
> Total employment, 2021: 218,908
> Change in avg. annual wage, 2011 to 2021: +109.1%
> Avg. annual wage, 2021: $35,372
[in-text-ad-2]

6. Health and welfare funds
> Change in employment, 2011 to 2021: -68.2%
> Total employment, 2021: 3,387
> Change in avg. annual wage, 2011 to 2021: +53.5%
> Avg. annual wage, 2021: $86,935

5. Consumer electronics and appliances rental
> Change in employment, 2011 to 2021: -68.3%
> Total employment, 2021: 8,733
> Change in avg. annual wage, 2011 to 2021: +35.1%
> Avg. annual wage, 2021: $52,663
[in-text-ad]

4. One-hour photo finishing
> Change in employment, 2011 to 2021: -69.2%
> Total employment, 2021: 416
> Change in avg. annual wage, 2011 to 2021: +33.3%
> Avg. annual wage, 2021: $34,252

3. Business and secretarial schools
> Change in employment, 2011 to 2021: -78.8%
> Total employment, 2021: 3,511
> Change in avg. annual wage, 2011 to 2021: +37.7%
> Avg. annual wage, 2021: $50,576

2. Pension funds
> Change in employment, 2011 to 2021: -79.3%
> Total employment, 2021: 3,450
> Change in avg. annual wage, 2011 to 2021: -9.6%
> Avg. annual wage, 2021: $99,477
[in-text-ad-2]

1. Open-end investment funds
> Change in employment, 2011 to 2021: -89.4%
> Total employment, 2021: 2,280
> Change in avg. annual wage, 2011 to 2021: +77.3%
> Avg. annual wage, 2021: $251,087
Thank you for reading! Have some feedback for us?
Contact the 24/7 Wall St. editorial team.
Latest from 24/7


Our expert who first called NVIDIA in 2009 is predicting 2025 will see a historic AI breakthrough.
You can follow him investing $500,000 of his own money on our top AI stocks for free.