
Many Americans work in jobs with long hours, low pay, few benefits, clueless managers, or all of the above. Some types of jobs come with an exceptionally poor combination of low pay and higher incidences of injuries, from carpal tunnel syndrome to serious spinal injury. On top of that, many of these are declining in numbers, which adds to job insecurity.
To find the worst jobs in America, 24/7 Wall St. constructed an occupation index comprising three measures — projected employment growth, wages, and nonfatal injury and illness rate — using data from the U.S. Bureau of Labor Statistics. The three measures were weighted equally, resulting in an occupation index score between zero and 100. The lower the score, the worse the job based on these measures. A total of 495 occupations with data were considered.
Take, for instance, welders. People who weld, solder, or operate related machinery have the highest incidence of nonfatal workplace accidents, with 1,338 injuries per 10,000 workers, according to government figures. They earn a median annual wage of just $32,300 — well below the median of $45,760 for all workers. And on top of those issues, demand for these workers, currently numbered at about 32,000 nationwide, is projected to fall by nearly 8% by 2031, as robots continue to replace people in many manufacturing positions.
As the U.S. population ages, demand for nursing assistants and orderlies is growing, but the workers needed to fill these positions barely earn a median annual salary of $30,000 (less for orderlies). Their rate of musculoskeletal injuries is comparable to firefighters and is way higher than police officers, construction workers, and even registered nurses, thanks to repeatedly lifting patients without assistance or protective gear. (Also see the labor laws your boss doesn’t want you to know about.)
By 2031, the BLS estimates there will be 4.7% more jobs in these occupations than the 1.34 million nursing assistants and 46,000 orderlies in the workforce as of 2021. However, the projected growth for all jobs is even higher, at 5.3%
The largest number of workers in these 25 professions are nursing assistants, followed by licensed vocational nurses (entry-level health care providers), correctional officers, and paramedics. The fastest growing jobs with high nonfatal injury rates are athletes, occupational therapy aides, and psychiatric technicians (aides who work in mental health facilities). (While these are jobs with high nonfatal injury rates, here are the 23 deadliest jobs in America.)
All but four of these professions pay less than the $45,760 median wage for all workers, and all jobs except for athletes pay less than $49,000 annually at full time. Ambulance drivers earn the least among these occupations, at $29,120. Three other jobs earn less than $30,000: tire repairers, florists, and orderlies.
Here are the worst jobs in America.
Click here to see our detailed methodology.
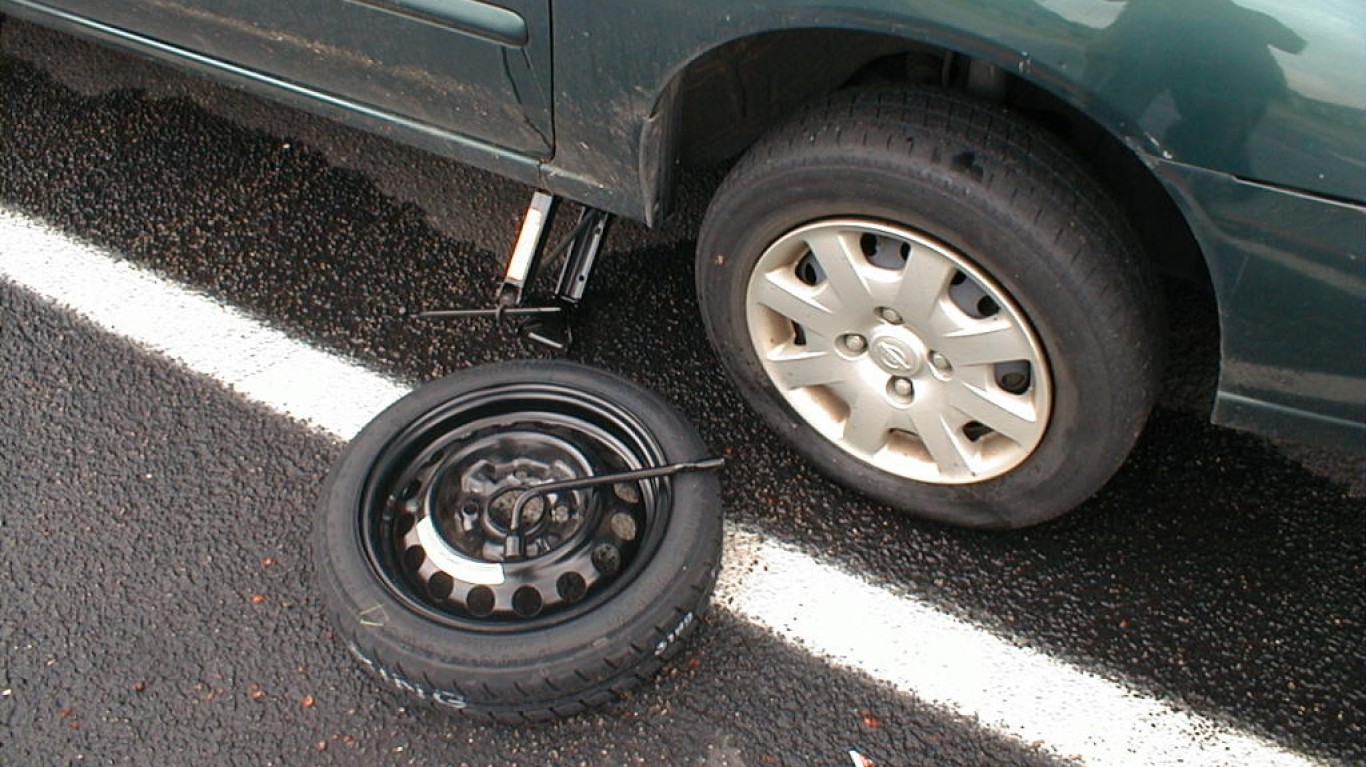
25. Tire repairers and changers
> Occupation index score: 41.6 out of 100
> Projected growth, 2021-2031: 3.1% – #199 smallest change of 495 occupations
> Median wage, 2021: $29,580 – #38 lowest of 495 occupations
> Injury and illness rate, 2020: 368.3 per 10,000 employees – #25 highest of 495 occupations
> Employment, 2021: 95,300
[in-text-ad]
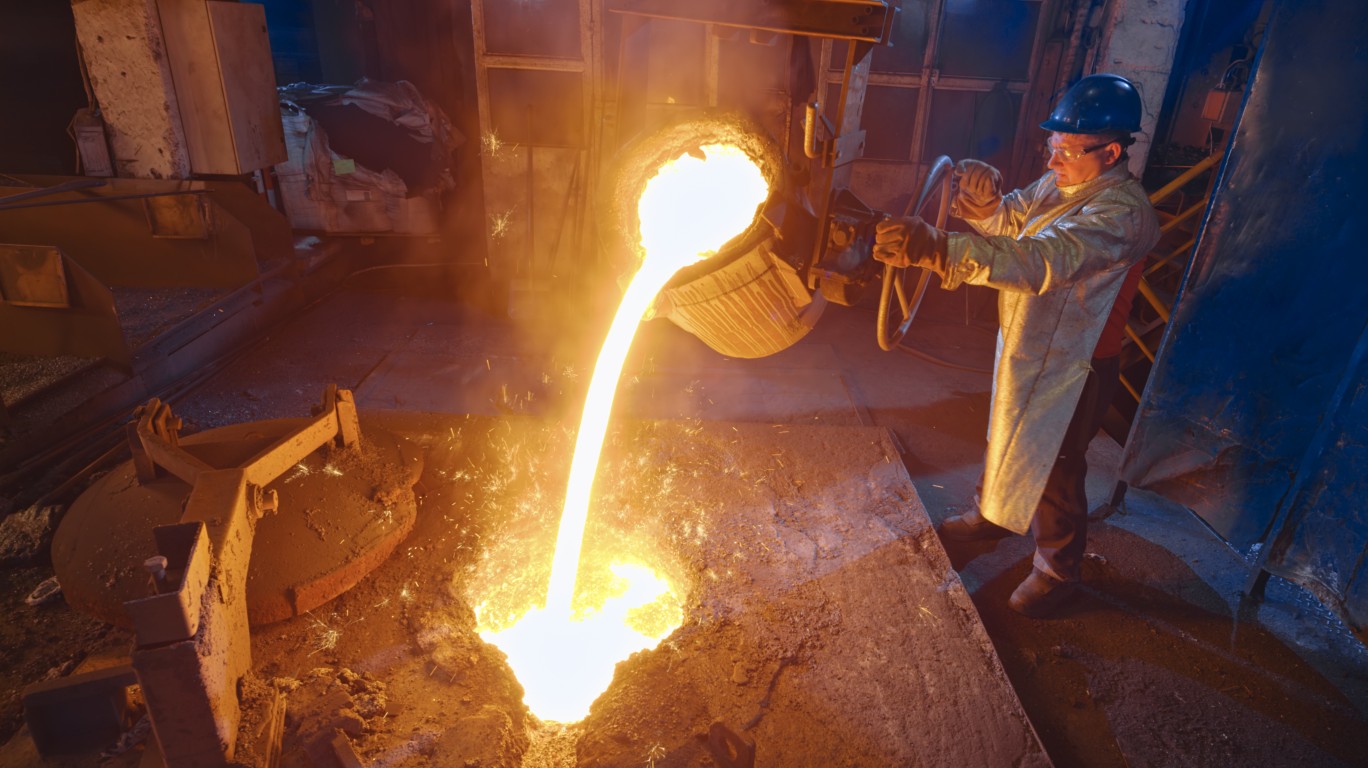
24. Pourers and casters, metal
> Occupation index score: 41.1 out of 100
> Projected growth, 2021-2031: -12.5% – #29 smallest change of 495 occupations
> Median wage, 2021: $45,850 – #216 lowest of 495 occupations
> Injury and illness rate, 2020: 261.8 per 10,000 employees – #54 highest of 495 occupations
> Employment, 2021: 6,700
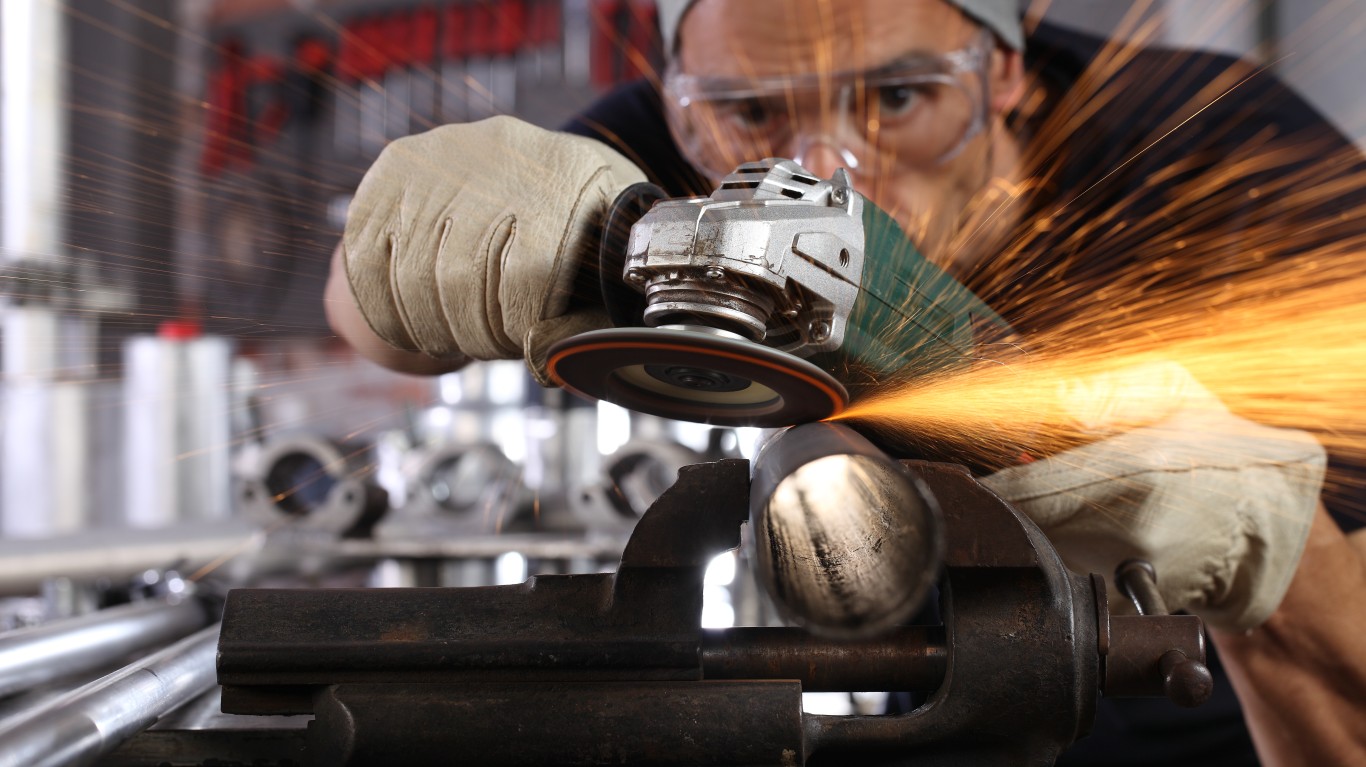
23. Grinding and polishing workers, hand
> Occupation index score: 41.0 out of 100
> Projected growth, 2021-2031: -18.7% – #13 smallest change of 495 occupations
> Median wage, 2021: $35,670 – #91 lowest of 495 occupations
> Injury and illness rate, 2020: 92.3 per 10,000 employees – #206 highest of 495 occupations
> Employment, 2021: 16,100

22. Ambulance drivers and attendants, except emergency medical technicians
> Occupation index score: 40.8 out of 100
> Projected growth, 2021-2031: -1.0% – #113 smallest change of 495 occupations
> Median wage, 2021: $29,120 – #24 lowest of 495 occupations
> Injury and illness rate, 2020: 333.2 per 10,000 employees – #34 highest of 495 occupations
> Employment, 2021: 11,900
[in-text-ad-2]

21. Athletes and sports competitors
> Occupation index score: 40.7 out of 100
> Projected growth, 2021-2031: 35.7% – #492 smallest change of 495 occupations
> Median wage, 2021: $77,300 – #411 lowest of 495 occupations
> Injury and illness rate, 2020: 1,280.5 per 10,000 employees – #2 highest of 495 occupations
> Employment, 2021: 15,800

20. Coil winders, tapers, and finishers
> Occupation index score: 40.6 out of 100
> Projected growth, 2021-2031: -17.9% – #17 smallest change of 495 occupations
> Median wage, 2021: $38,360 – #164 lowest of 495 occupations
> Injury and illness rate, 2020: 139.7 per 10,000 employees – #137 highest of 495 occupations
> Employment, 2021: 11,400
[in-text-ad]
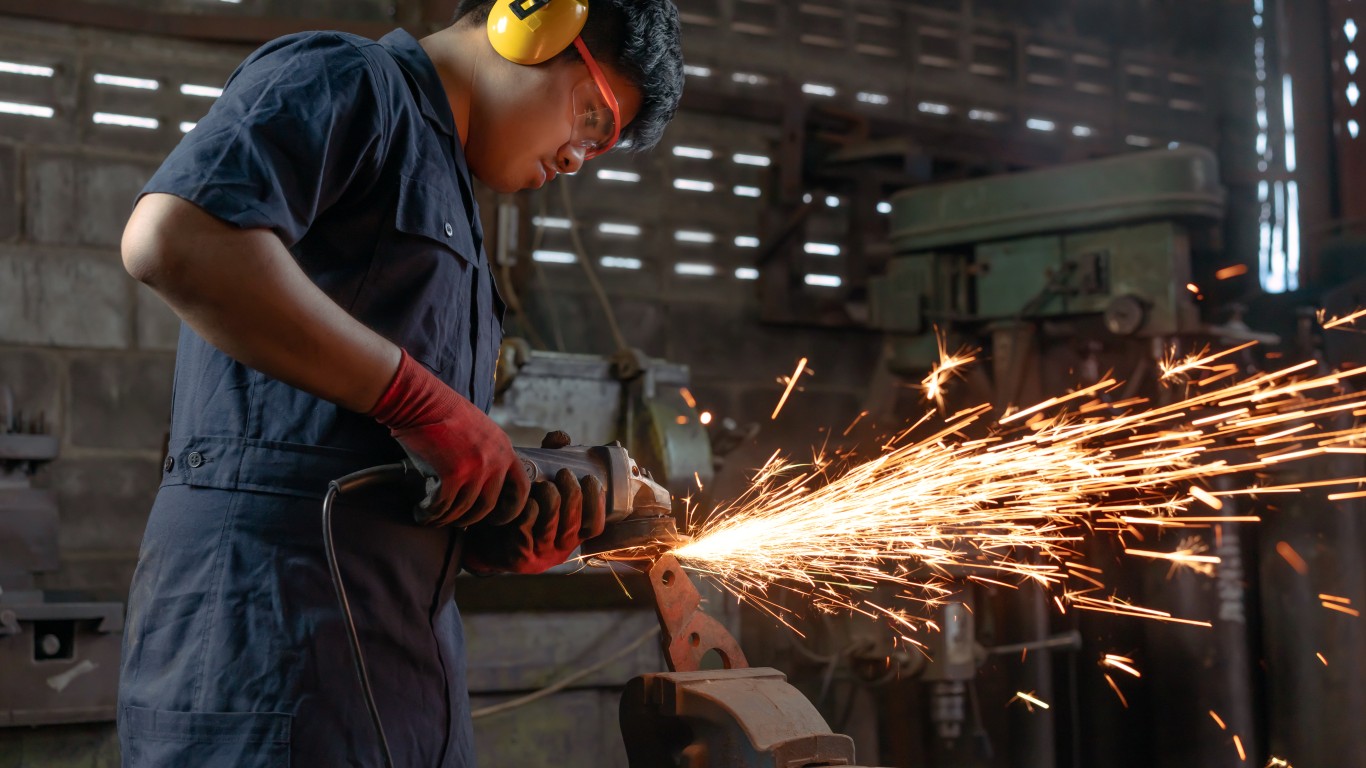
19. Tool grinders, filers, and sharpeners
> Occupation index score: 40.6 out of 100
> Projected growth, 2021-2031: -7.9% – #56 smallest change of 495 occupations
> Median wage, 2021: $38,430 – #167 lowest of 495 occupations
> Injury and illness rate, 2020: 300.8 per 10,000 employees – #42 highest of 495 occupations
> Employment, 2021: 6,300

18. Floral designers
> Occupation index score: 40.5 out of 100
> Projected growth, 2021-2031: -21.0% – #9 smallest change of 495 occupations
> Median wage, 2021: $29,880 – #49 lowest of 495 occupations
> Injury and illness rate, 2020: 28.7 per 10,000 employees – #363 highest of 495 occupations
> Employment, 2021: 44,400

17. Data entry keyers
> Occupation index score: 40.5 out of 100
> Projected growth, 2021-2031: -24.7% – #4 smallest change of 495 occupations
> Median wage, 2021: $35,630 – #90 lowest of 495 occupations
> Injury and illness rate, 2020: 13.1 per 10,000 employees – #430 highest of 495 occupations
> Employment, 2021: 155,900
[in-text-ad-2]

16. Licensed practical and licensed vocational nurses
> Occupation index score: 40.3 out of 100
> Projected growth, 2021-2031: 6.3% – #318 smallest change of 495 occupations
> Median wage, 2021: $48,070 – #268 lowest of 495 occupations
> Injury and illness rate, 2020: 608.4 per 10,000 employees – #9 highest of 495 occupations
> Employment, 2021: 657,200

15. Electronic equipment installers and repairers, motor vehicles
> Occupation index score: 40.0 out of 100
> Projected growth, 2021-2031: -23.4% – #7 smallest change of 495 occupations
> Median wage, 2021: $40,670 – #188 lowest of 495 occupations
> Injury and illness rate, 2020: 92.4 per 10,000 employees – #205 highest of 495 occupations
> Employment, 2021: 9,200
[in-text-ad]

14. Emergency medical technicians and paramedics
> Occupation index score: 39.8 out of 100
> Projected growth, 2021-2031: 6.9% – #336 smallest change of 495 occupations
> Median wage, 2021: $36,930 – #117 lowest of 495 occupations
> Injury and illness rate, 2020: 554.2 per 10,000 employees – #11 highest of 495 occupations
> Employment, 2021: 261,000

13. Switchboard operators, including answering service
> Occupation index score: 39.6 out of 100
> Projected growth, 2021-2031: -24.0% – #6 smallest change of 495 occupations
> Median wage, 2021: $30,150 – #64 lowest of 495 occupations
> Injury and illness rate, 2020: 21.3 per 10,000 employees – #394 highest of 495 occupations
> Employment, 2021: 49,000

12. Textile knitting and weaving machine setters, operators, and tenders
> Occupation index score: 38.7 out of 100
> Projected growth, 2021-2031: -15.1% – #24 smallest change of 495 occupations
> Median wage, 2021: $33,990 – #85 lowest of 495 occupations
> Injury and illness rate, 2020: 227.3 per 10,000 employees – #69 highest of 495 occupations
> Employment, 2021: 17,000
[in-text-ad-2]

11. Print binding and finishing workers
> Occupation index score: 38.7 out of 100
> Projected growth, 2021-2031: -24.8% – #3 smallest change of 495 occupations
> Median wage, 2021: $36,590 – #107 lowest of 495 occupations
> Injury and illness rate, 2020: 93.8 per 10,000 employees – #201 highest of 495 occupations
> Employment, 2021: 42,200

10. Cutters and trimmers, hand
> Occupation index score: 37.0 out of 100
> Projected growth, 2021-2031: -28.4% – #2 smallest change of 495 occupations
> Median wage, 2021: $30,230 – #66 lowest of 495 occupations
> Injury and illness rate, 2020: 56.7 per 10,000 employees – #281 highest of 495 occupations
> Employment, 2021: 8,200
[in-text-ad]

9. Word processors and typists
> Occupation index score: 36.1 out of 100
> Projected growth, 2021-2031: -38.2% – #1 smallest change of 495 occupations
> Median wage, 2021: $44,030 – #195 lowest of 495 occupations
> Injury and illness rate, 2020: 40.3 per 10,000 employees – #327 highest of 495 occupations
> Employment, 2021: 46,100

8. Telephone operators
> Occupation index score: 35.1 out of 100
> Projected growth, 2021-2031: -24.5% – #5 smallest change of 495 occupations
> Median wage, 2021: $37,630 – #139 lowest of 495 occupations
> Injury and illness rate, 2020: 249.8 per 10,000 employees – #61 highest of 495 occupations
> Employment, 2021: 4,000

7. Psychiatric aides
> Occupation index score: 32.3 out of 100
> Projected growth, 2021-2031: 4.6% – #266 smallest change of 495 occupations
> Median wage, 2021: $30,260 – #67 lowest of 495 occupations
> Injury and illness rate, 2020: 771.9 per 10,000 employees – #7 highest of 495 occupations
> Employment, 2021: 41,000
[in-text-ad-2]

6. Correctional officers and jailers
> Occupation index score: 31.7 out of 100
> Projected growth, 2021-2031: -10.3% – #39 smallest change of 495 occupations
> Median wage, 2021: $47,920 – #261 lowest of 495 occupations
> Injury and illness rate, 2020: 688.1 per 10,000 employees – #8 highest of 495 occupations
> Employment, 2021: 402,200

5. Psychiatric technicians
> Occupation index score: 31.7 out of 100
> Projected growth, 2021-2031: 10.9% – #407 smallest change of 495 occupations
> Median wage, 2021: $36,570 – #104 lowest of 495 occupations
> Injury and illness rate, 2020: 941.8 per 10,000 employees – #5 highest of 495 occupations
> Employment, 2021: 98,000
[in-text-ad]

4. Occupational therapy aides
> Occupation index score: 31.4 out of 100
> Projected growth, 2021-2031: 13.6% – #426 smallest change of 495 occupations
> Median wage, 2021: $33,560 – #84 lowest of 495 occupations
> Injury and illness rate, 2020: 975.0 per 10,000 employees – #4 highest of 495 occupations
> Employment, 2021: 3,500

3. Orderlies
> Occupation index score: 29.3 out of 100
> Projected growth, 2021-2031: 4.7% – #271 smallest change of 495 occupations
> Median wage, 2021: $29,990 – #58 lowest of 495 occupations
> Injury and illness rate, 2020: 887.8 per 10,000 employees – #6 highest of 495 occupations
> Employment, 2021: 46,200

2. Nursing assistants
> Occupation index score: 26.0 out of 100
> Projected growth, 2021-2031: 4.7% – #271 smallest change of 495 occupations
> Median wage, 2021: $30,310 – #68 lowest of 495 occupations
> Injury and illness rate, 2020: 1,023.8 per 10,000 employees – #3 highest of 495 occupations
> Employment, 2021: 1,343,700
[in-text-ad-2]
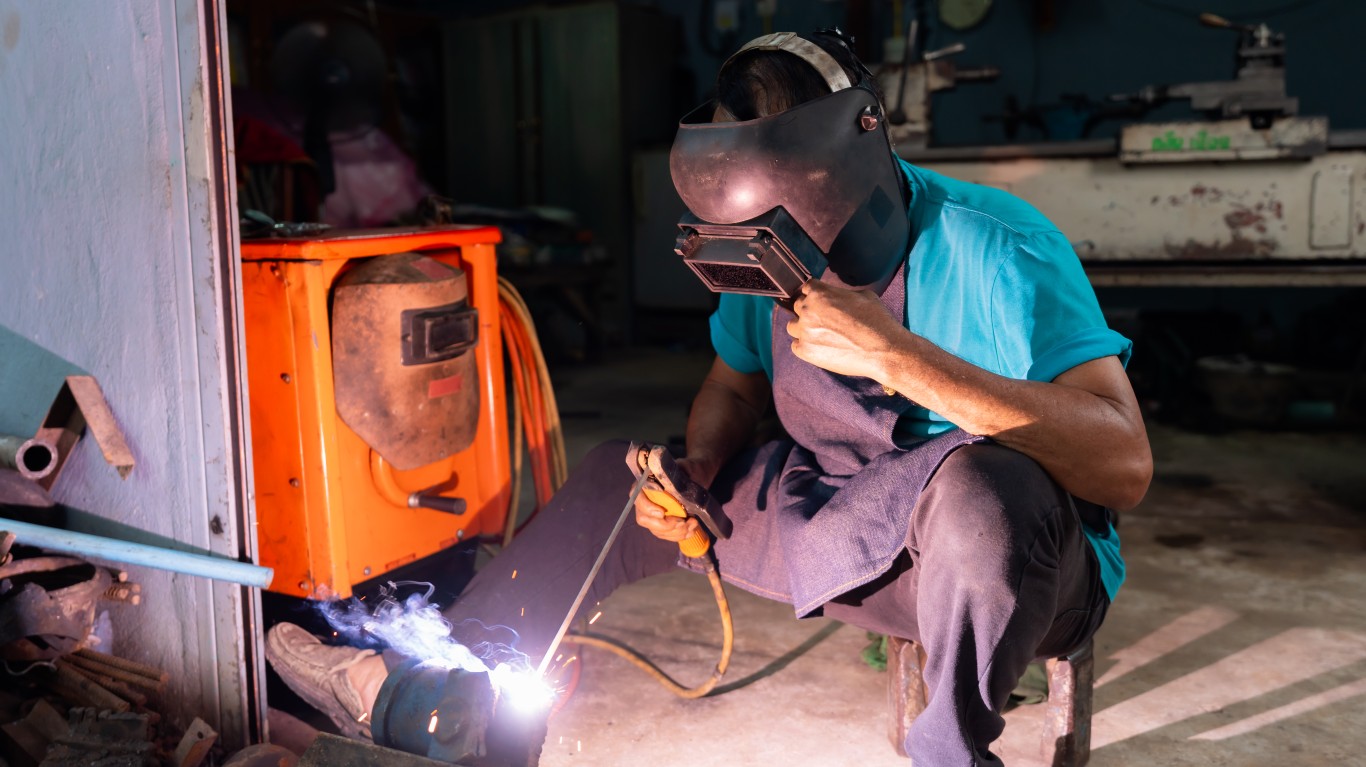
1. Welding, soldering, and brazing machine setters, operators, and tenders
> Occupation index score: 14.7 out of 100
> Projected growth, 2021-2031: -7.9% – #56 smallest change of 495 occupations
> Median wage, 2021: $38,580 – #171 lowest of 495 occupations
> Injury and illness rate, 2020: 1,337.6 per 10,000 employees – #1 highest of 495 occupations
> Employment, 2021: 32,300
Methodology
To find the worst jobs in America, 24/7 Wall St. constructed an occupation index comprising three measures — projected employment growth, wages, and nonfatal injury and illness rate — using data from the U.S. Bureau of Labor Statistics. Each measure was normalized and weighted equally in the index, resulting in an occupation index score between zero and 100. The lower the score, the worse the job based on these measures.
Projected employment growth from 2021 to 2031 came from the Bureau of Labor Statistics’ Employment Projections program. Median annual wage for 2021 is for non-farm wage and salary workers only and came from the same source, citing the Occupational Employment and Wage Statistics program of the BLS. Nonfatal occupational injuries and illnesses involving days away from work per 10,000 full-time workers in 2020 came from the BLS’ Survey of Occupational Injuries and Illnesses Data. A total of 495 occupations with data were considered.
It’s Your Money, Your Future—Own It (sponsor)
Retirement can be daunting, but it doesn’t need to be.
Imagine having an expert in your corner to help you with your financial goals. Someone to help you determine if you’re ahead, behind, or right on track. With SmartAsset, that’s not just a dream—it’s reality. This free tool connects you with pre-screened financial advisors who work in your best interests. It’s quick, it’s easy, so take the leap today and start planning smarter!
Don’t waste another minute; get started right here and help your retirement dreams become a retirement reality.
Thank you for reading! Have some feedback for us?
Contact the 24/7 Wall St. editorial team.
 24/7 Wall St.
 24/7 Wall St.
 24/7 Wall St.

