In 2019, one year before the onset of the COVID-19 pandemic, fewer than 9 million Americans worked from home, according to the U.S. Census Bureau’s American Community Survey. By 2021, the first full year COVID, that number more than tripled, to 27.6 million.
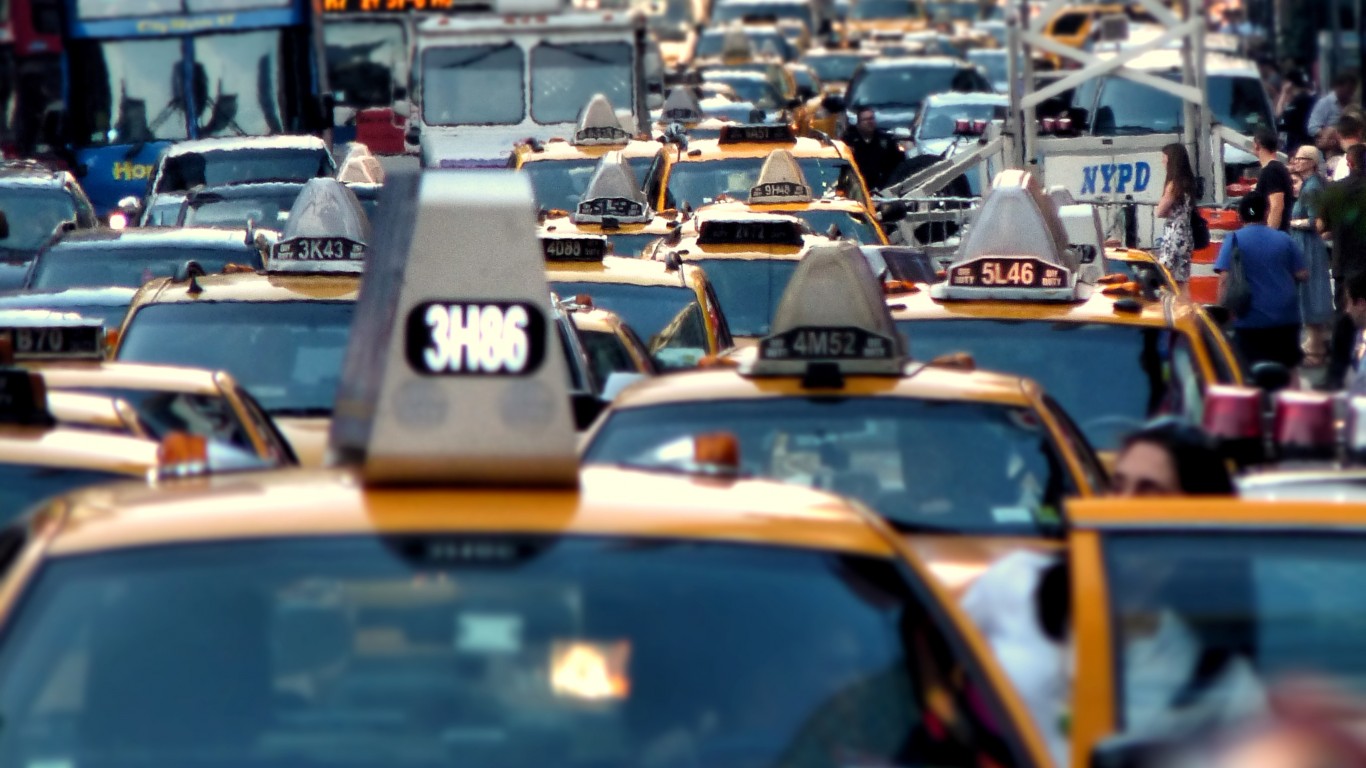
But now, as pandemic-era restrictions have been lifted, more workers are returning to the office – and traffic congestion is returning to American roadways. Not only frustrating, traffic delays are costly, resulting in an estimated $100 billion per year in wasted fuel and lost time, according to Texas A&M University. Each year, in cities across the United States, the typical commuter spends hours sitting in traffic – and in some cities, the problem is far worse than in others.
Using traffic data for 292 U.S. cities from INRIX, a traffic data and analytics company, 24/7 Wall St. identified the American cities with the worst traffic. Cities are ranked by the average number of hours the typical commuter lost to traffic in 2022. In the case of a tie, the city with the longer average commute time ranks lower. In the 32 cities on this list, the average commuter lost 30 hours or to traffic in 2022.
California is home to five cities on this list, more than any other state, followed by Texas, with four of the cities with the worst traffic. In every city on this list, traffic delays increased by anywhere from 11% to 155% from 2021 to 2022.
Most of the cities on this list are densely-populated places where tens of thousands – if not hundreds of thousands – of people either drive or catch a ride to work. This list includes eight of the 10 largest U.S. cities by population – including New York, Los Angeles, Chicago, and Houston. (Here is a look at the 25 worst American cities to drive in.)
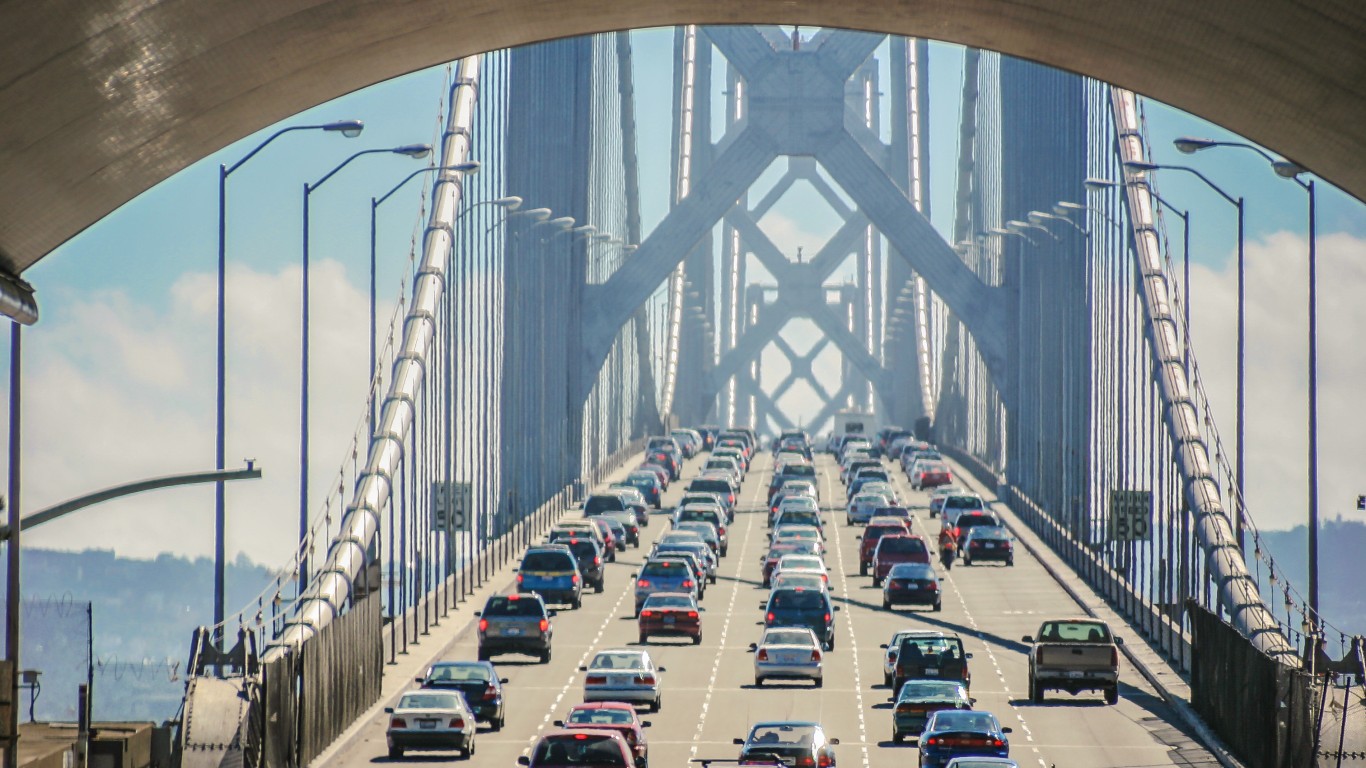
Notably, several cities on this list, like New York, San Francisco, and Washington, D.C., have reliable subway systems that most commuters use every day. Even though public transportation offsets roadway congestion, commuters who drive in these places still spent an average of more than 80 hours stuck in traffic in 2022. (Here is a look at the 10 cities around the world with the worst traffic.)
These are the U.S. cities with the worst traffic.
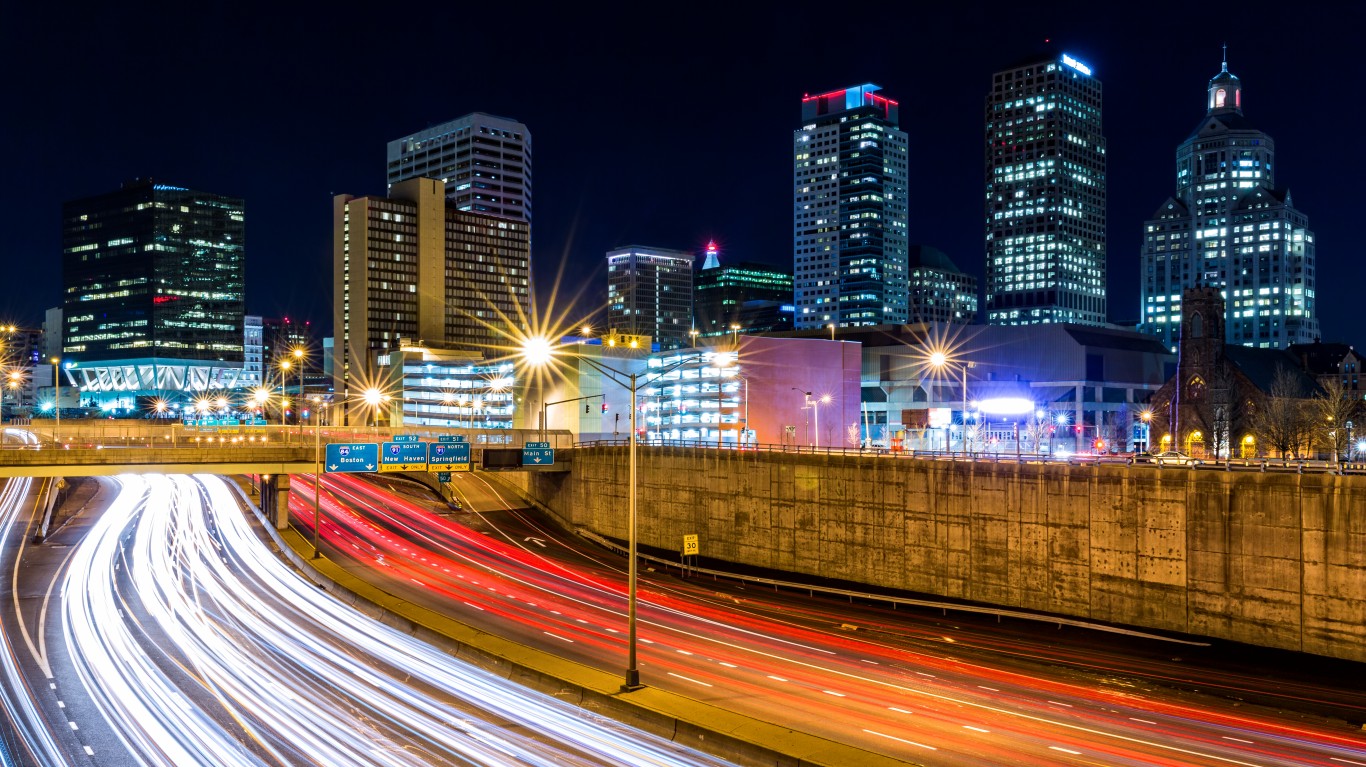
32. Hartford, CT
> Avg. commute time lost to traffic delays in 2022: 30 hours per driver
> Change in traffic delays from 2021: +43%
> Avg. commute time in city: 21.7 minutes
> Commuters who drive or carpool to work: 37,026; 78.7% of commuters
[in-text-ad]
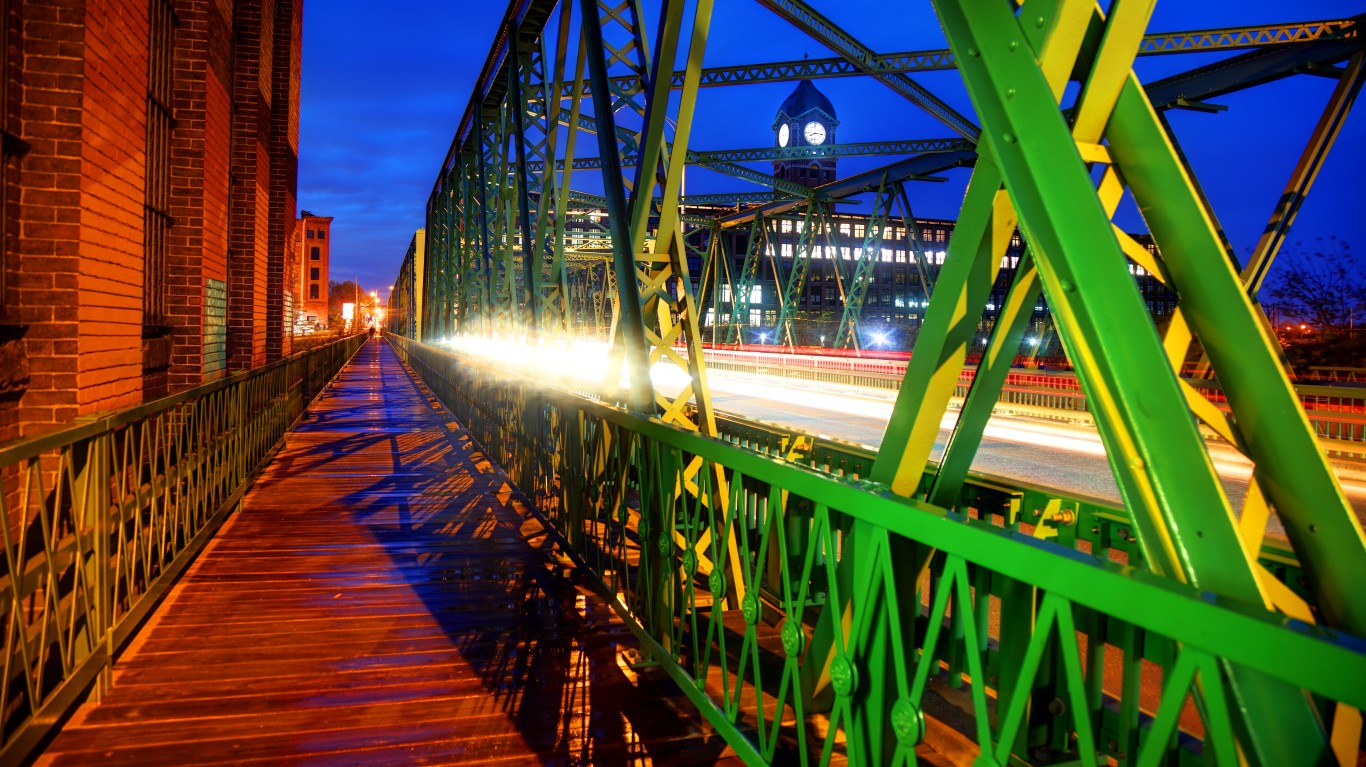
31. Lawrence, MA
> Avg. commute time lost to traffic delays in 2022: 30 hours per driver
> Change in traffic delays from 2021: +50%
> Avg. commute time in city: 22.3 minutes
> Commuters who drive or carpool to work: 33,511; 87.5% of commuters
[recirclink id=1198527]
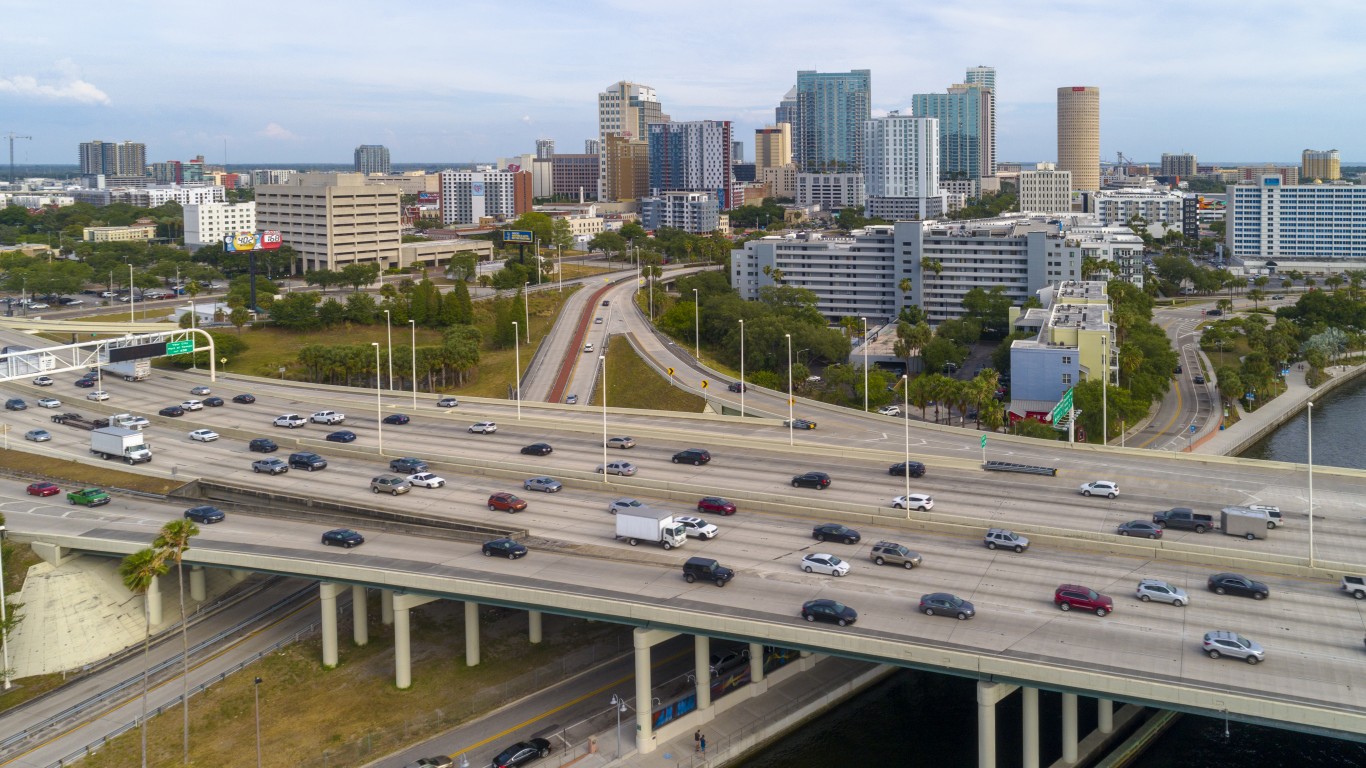
30. Tampa, FL
> Avg. commute time lost to traffic delays in 2022: 30 hours per driver
> Change in traffic delays from 2021: +43%
> Avg. commute time in city: 24.7 minutes
> Commuters who drive or carpool to work: 151,042; 92.3% of commuters
 E Wisconsin Av... by (vincent desjardins)")
29. Milwaukee, WI
> Avg. commute time lost to traffic delays in 2022: 32 hours per driver
> Change in traffic delays from 2021: +47%
> Avg. commute time in city: 22.3 minutes
> Commuters who drive or carpool to work: 210,005; 87.5% of commuters
[in-text-ad-2]
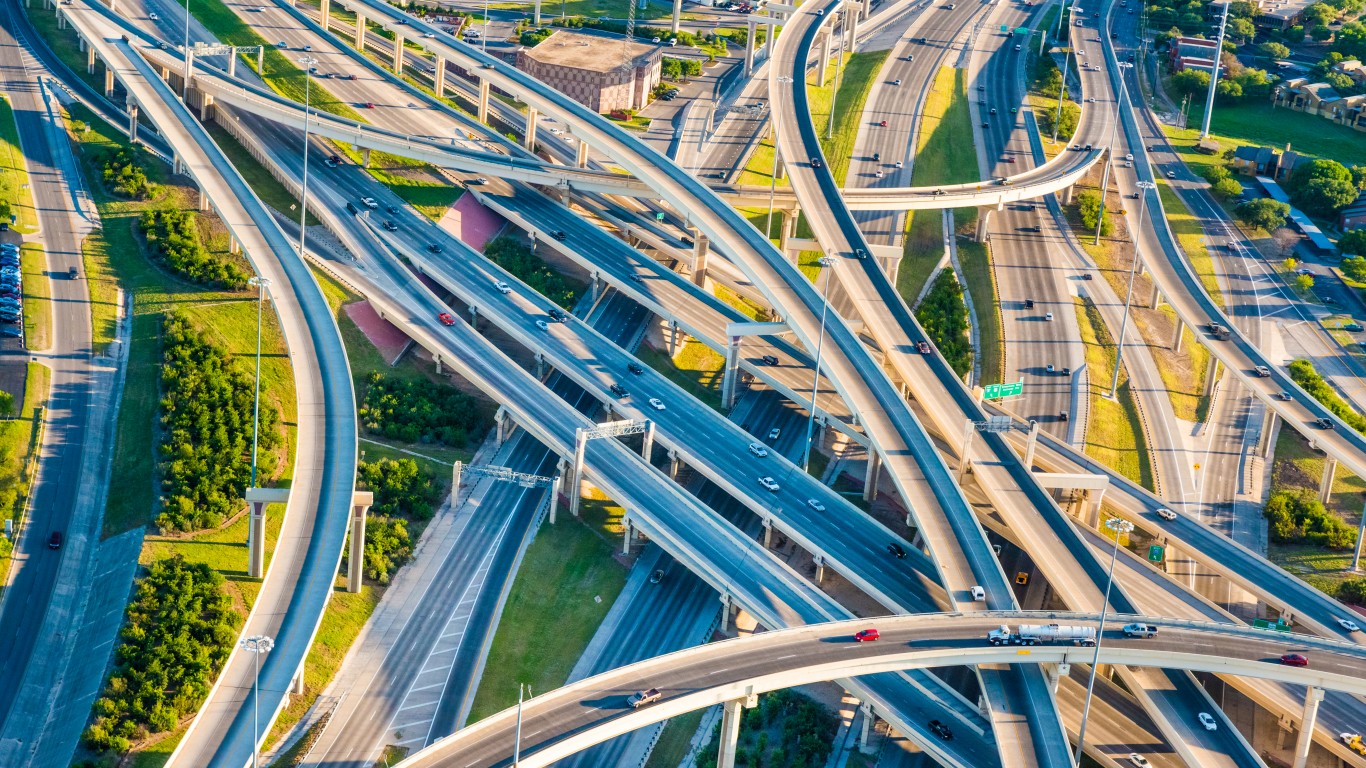
28. San Antonio, TX
> Avg. commute time lost to traffic delays in 2022: 32 hours per driver
> Change in traffic delays from 2021: +41%
> Avg. commute time in city: 24.3 minutes
> Commuters who drive or carpool to work: 585,727; 93.8% of commuters
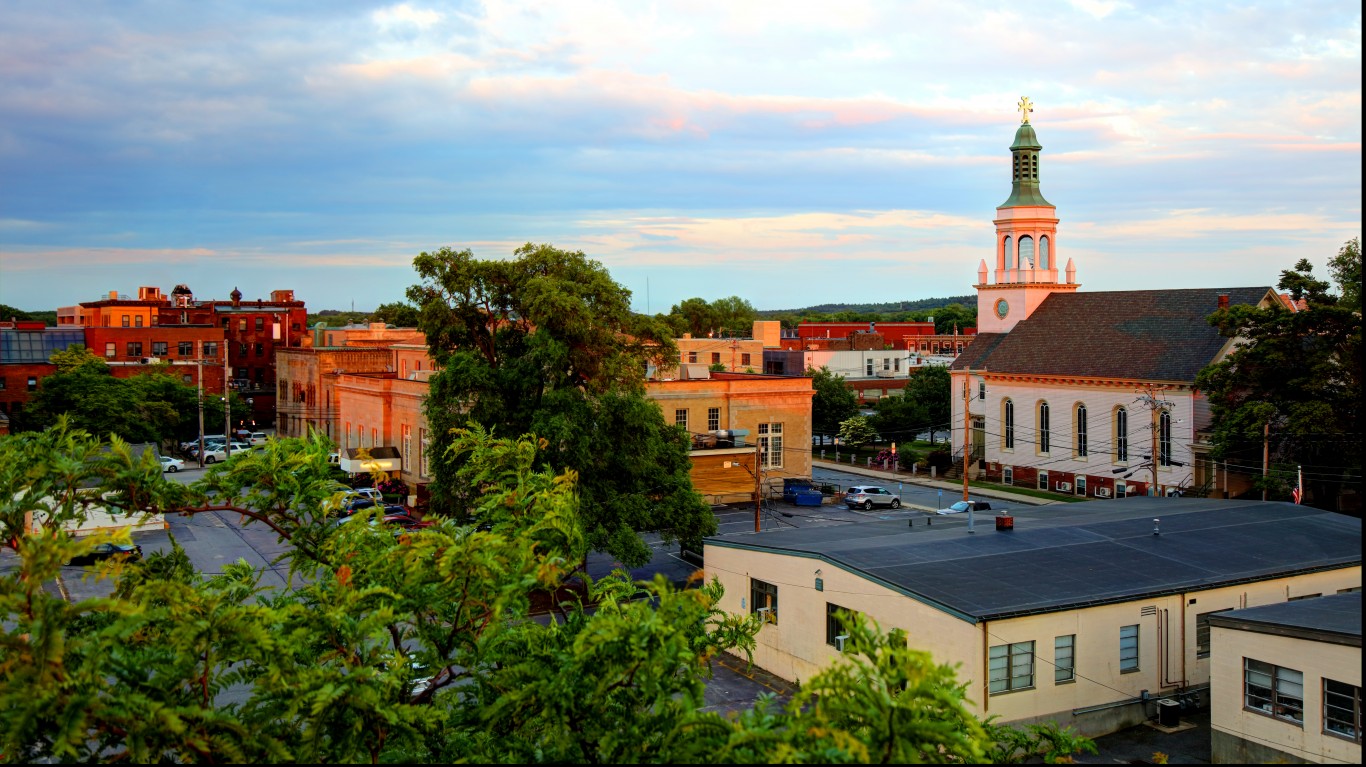
27. Framingham, MA
> Avg. commute time lost to traffic delays in 2022: 32 hours per driver
> Change in traffic delays from 2021: +25%
> Avg. commute time in city: 30.8 minutes
> Commuters who drive or carpool to work: 28,988; 86.4% of commuters
[in-text-ad]
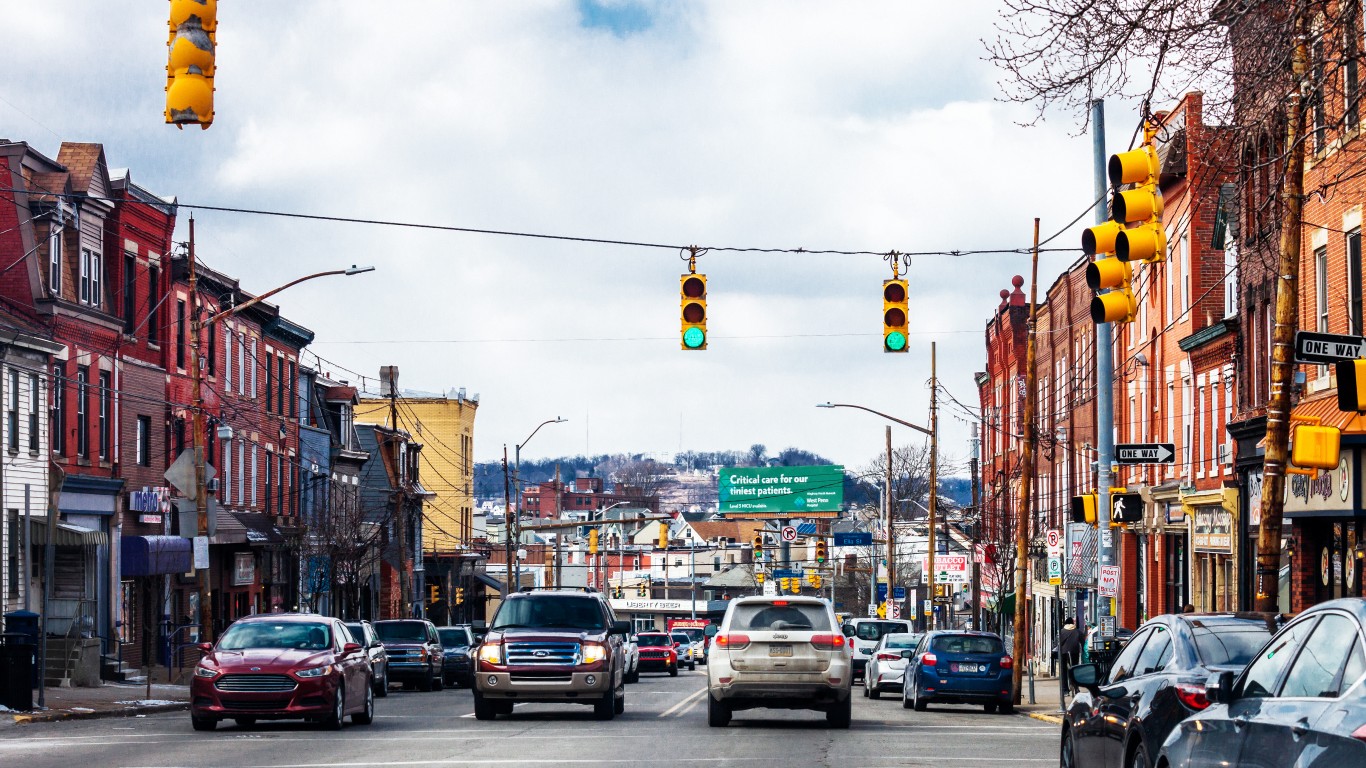
26. Pittsburgh, PA
> Avg. commute time lost to traffic delays in 2022: 34 hours per driver
> Change in traffic delays from 2021: +87%
> Avg. commute time in city: 23.9 minutes
> Commuters who drive or carpool to work: 90,784; 68.1% of commuters
[recirclink id=1202995]
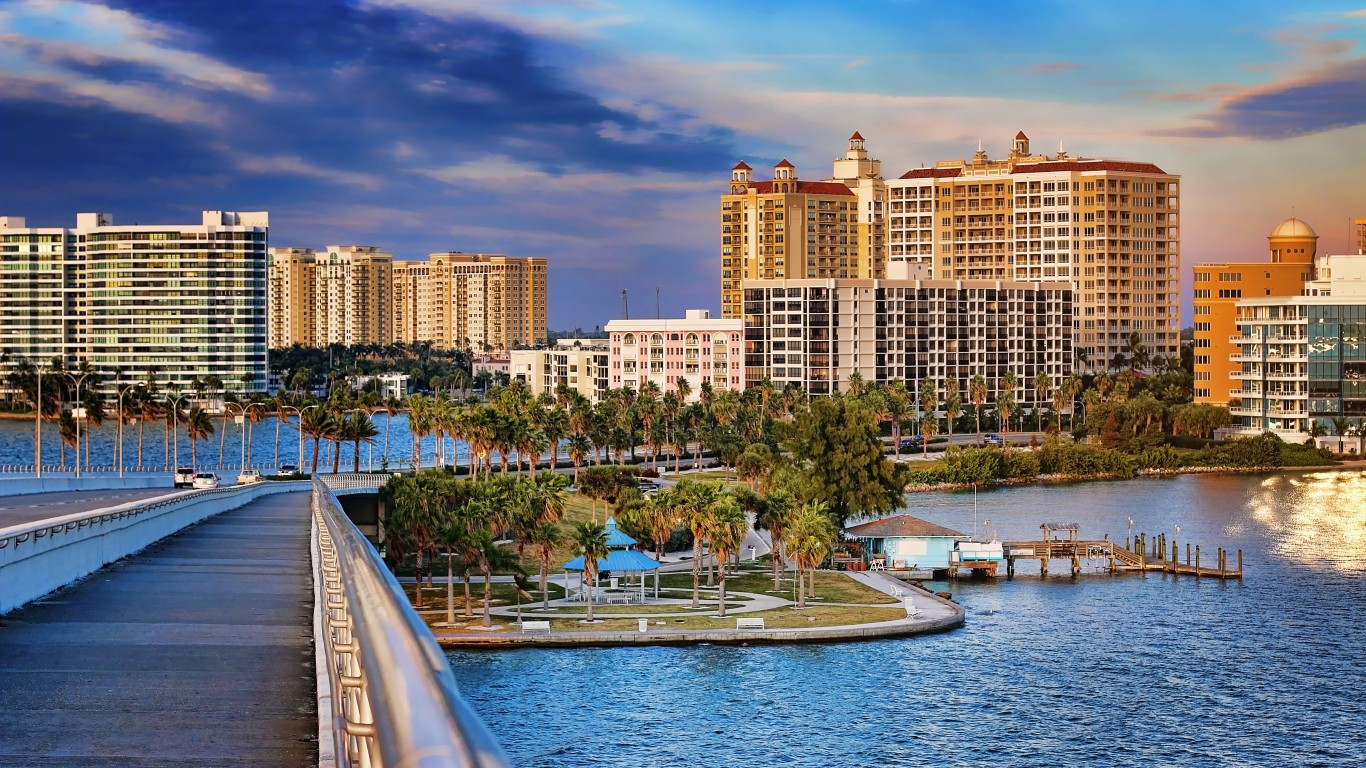
25. Sarasota-Bradenton, FL
> Avg. commute time lost to traffic delays in 2022: 36 hours per driver
> Change in traffic delays from 2021: +29%
> Avg. commute time in city: 22.3 minutes
> Commuters who drive or carpool to work: 19,751; 93.4% of commuters
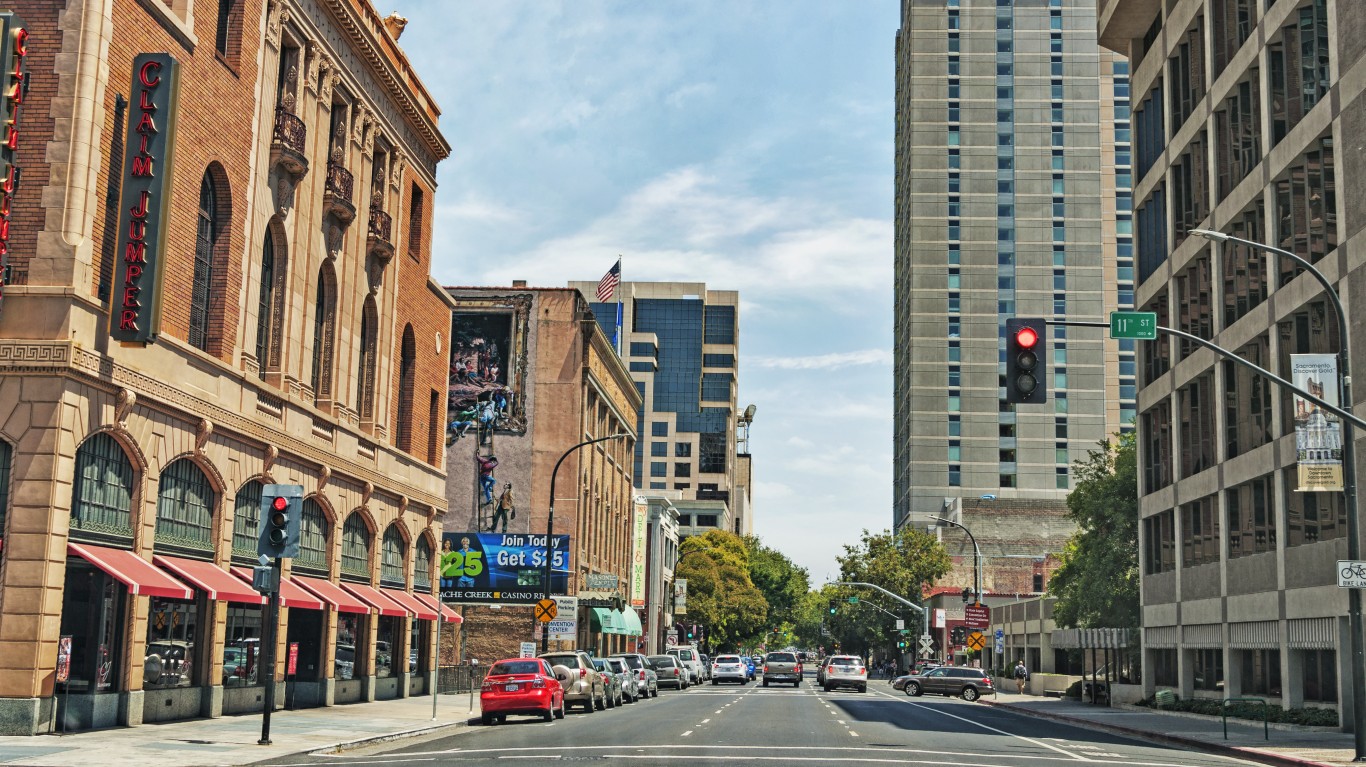
24. Sacramento, CA
> Avg. commute time lost to traffic delays in 2022: 36 hours per driver
> Change in traffic delays from 2021: +44%
> Avg. commute time in city: 26.1 minutes
> Commuters who drive or carpool to work: 190,752; 89.8% of commuters
[in-text-ad-2]
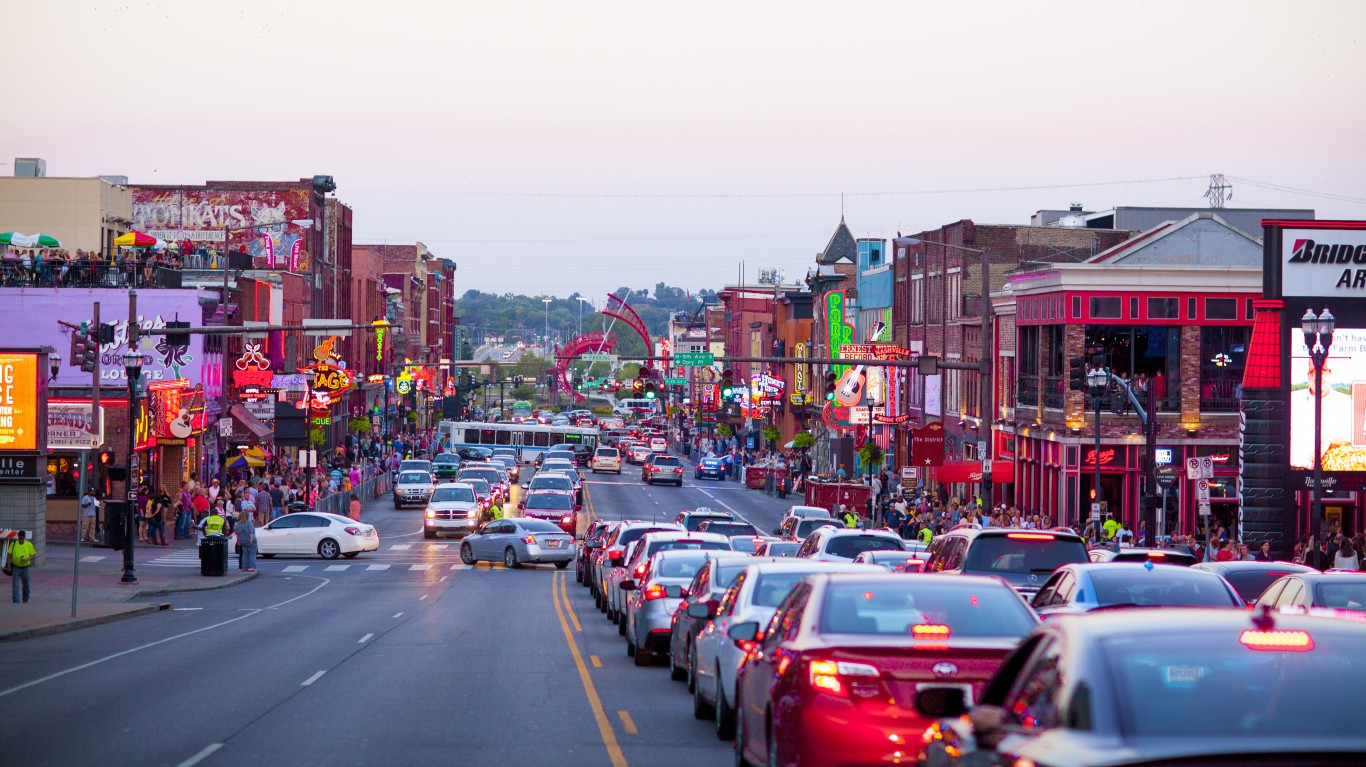
23. Nashville, TN
> Avg. commute time lost to traffic delays in 2022: 41 hours per driver
> Change in traffic delays from 2021: +155%
> Avg. commute time in city: 25.0 minutes
> Commuters who drive or carpool to work: 305,799; 93.8% of commuters
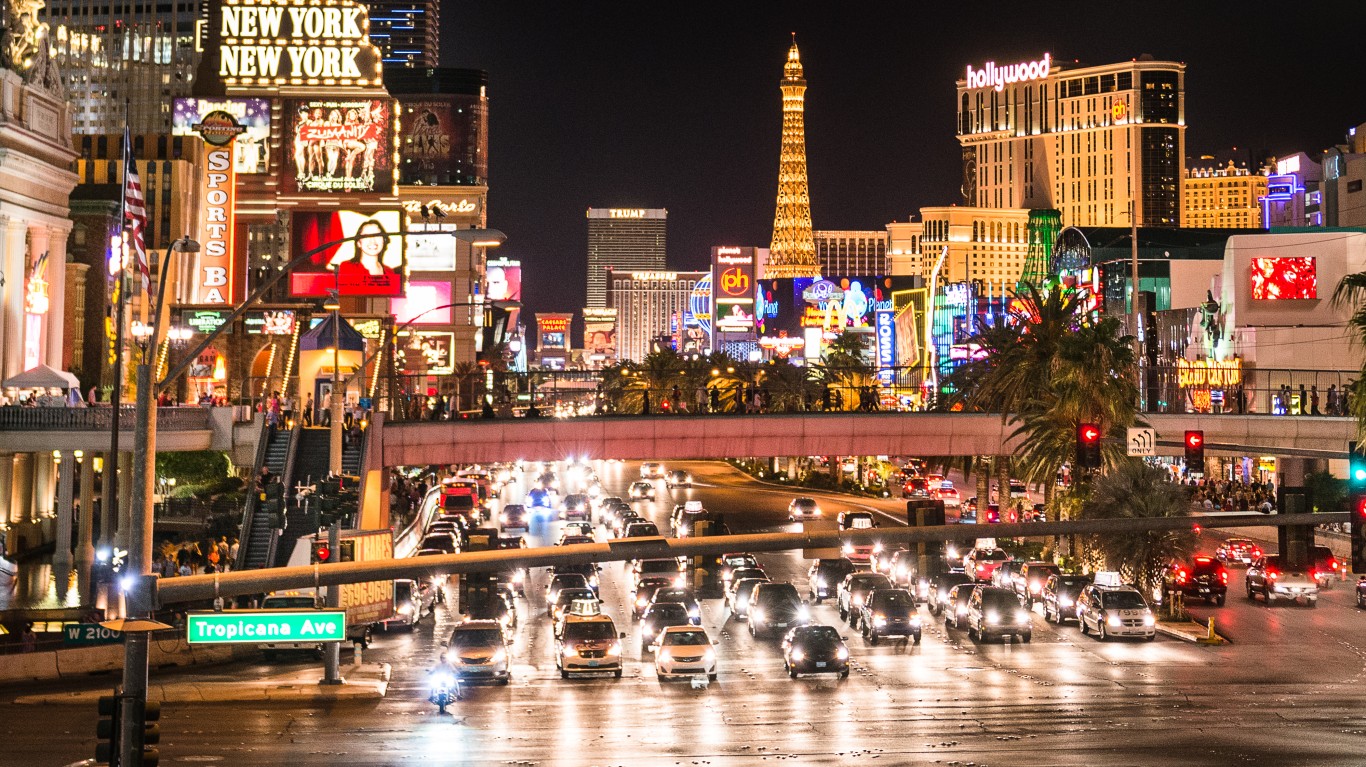
22. Las Vegas, NV
> Avg. commute time lost to traffic delays in 2022: 41 hours per driver
> Change in traffic delays from 2021: +46%
> Avg. commute time in city: 25.8 minutes
> Commuters who drive or carpool to work: 243,916; 92.2% of commuters
[in-text-ad]
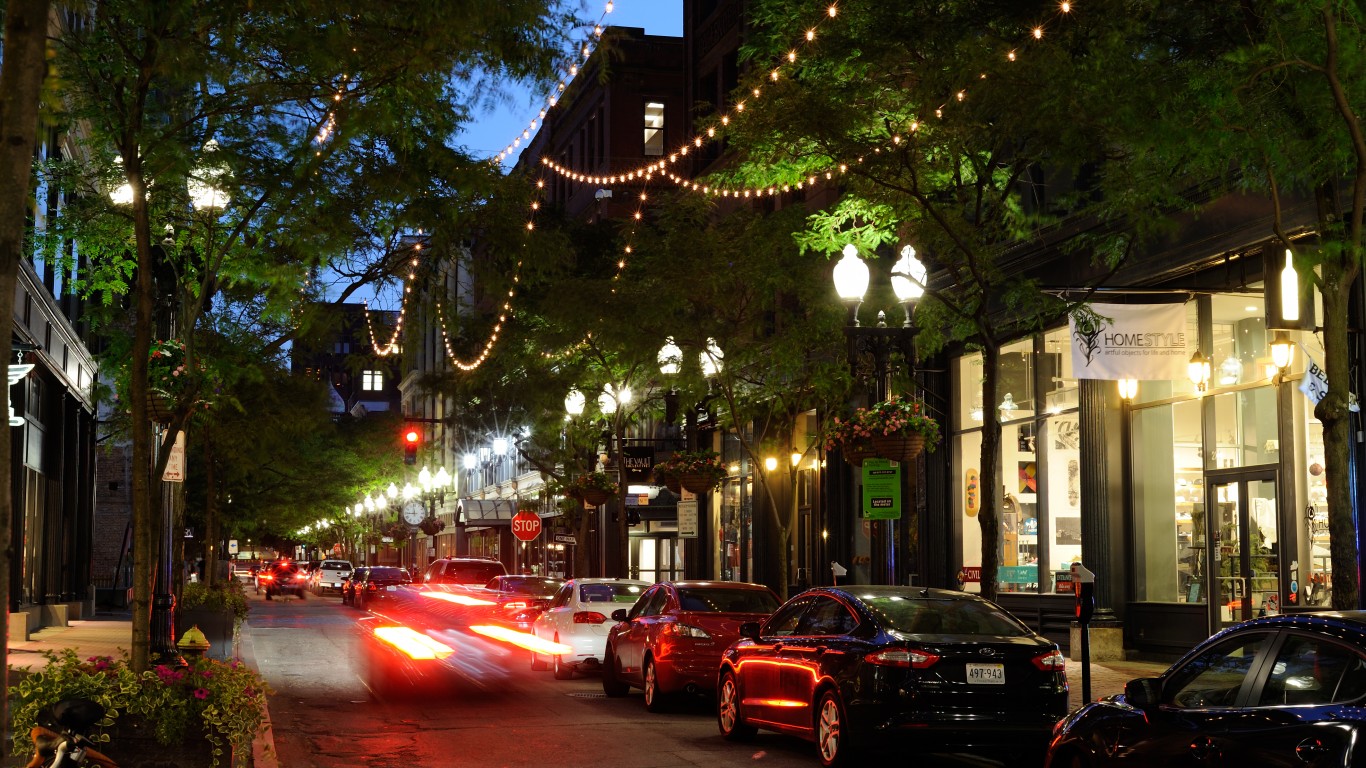
21. Providence, RI
> Avg. commute time lost to traffic delays in 2022: 42 hours per driver
> Change in traffic delays from 2021: +11%
> Avg. commute time in city: 24.2 minutes
> Commuters who drive or carpool to work: 65,447; 84.1% of commuters
[recirclink id=1196572]
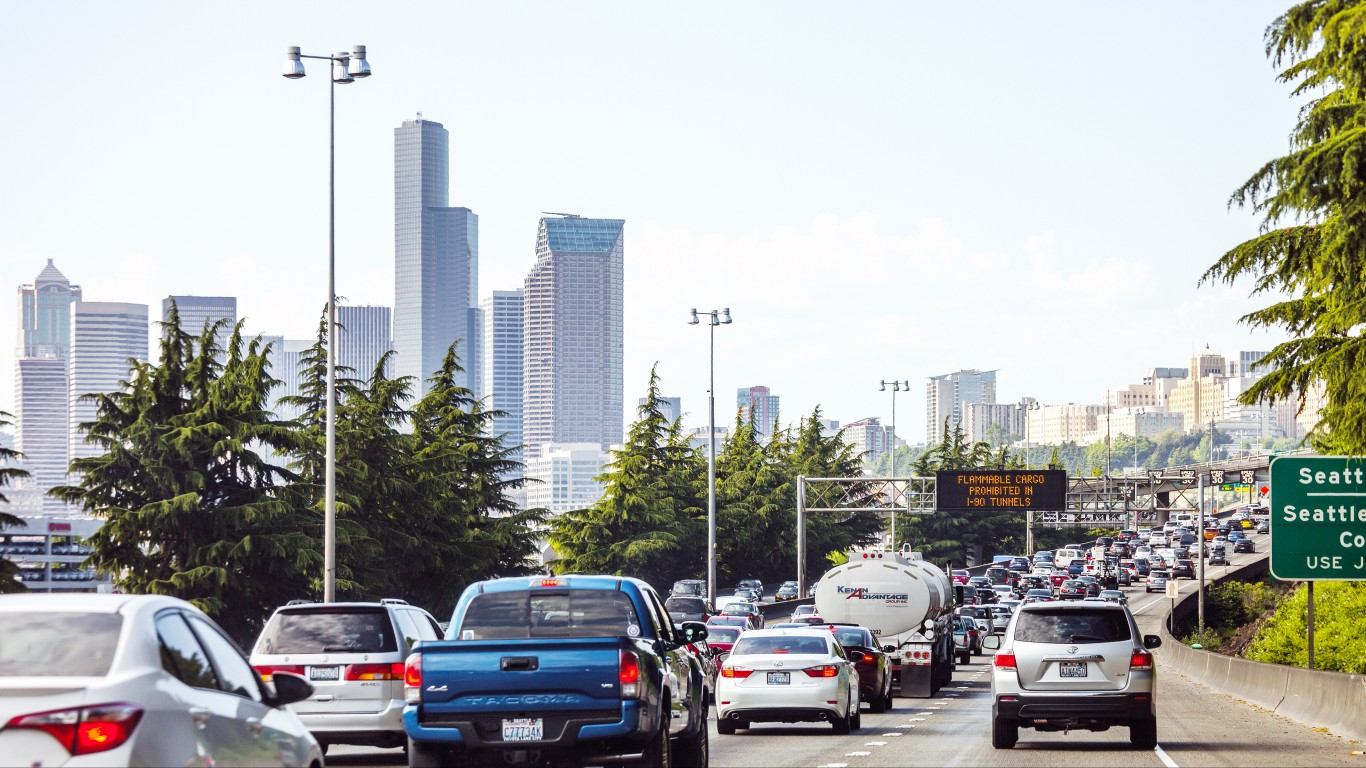
20. Seattle, WA
> Avg. commute time lost to traffic delays in 2022: 46 hours per driver
> Change in traffic delays from 2021: +52%
> Avg. commute time in city: 27.7 minutes
> Commuters who drive or carpool to work: 204,468; 59.4% of commuters
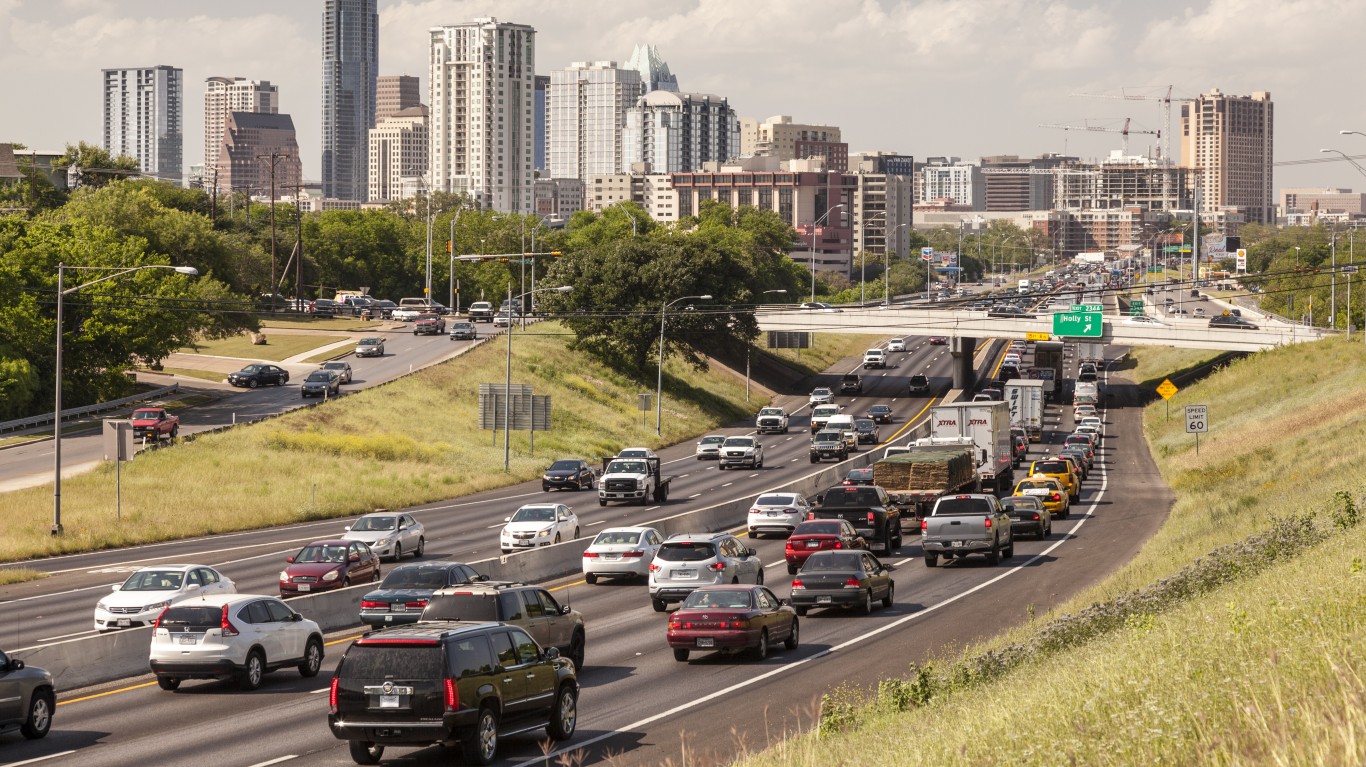
19. Austin, TX
> Avg. commute time lost to traffic delays in 2022: 53 hours per driver
> Change in traffic delays from 2021: +65%
> Avg. commute time in city: 24.5 minutes
> Commuters who drive or carpool to work: 404,386; 90.6% of commuters
[in-text-ad-2]
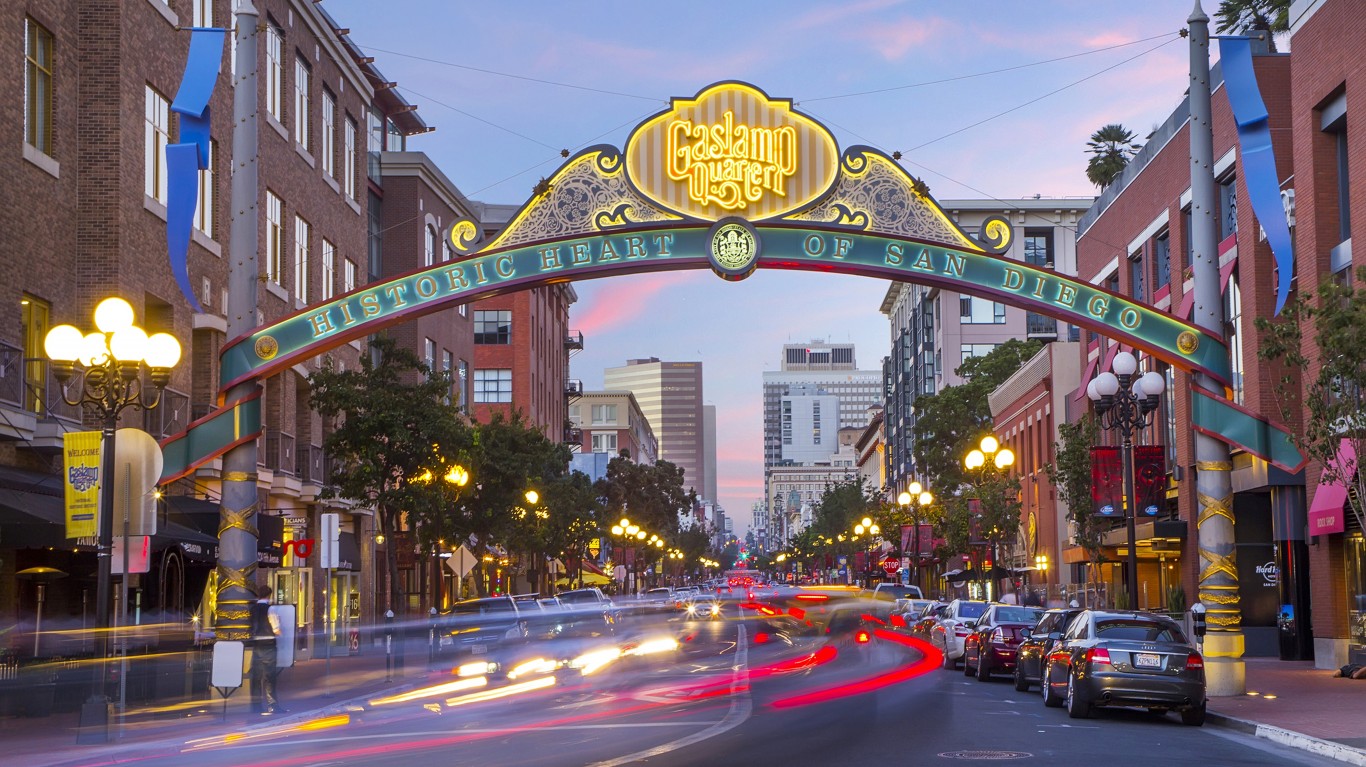
18. San Diego, CA
> Avg. commute time lost to traffic delays in 2022: 54 hours per driver
> Change in traffic delays from 2021: +69%
> Avg. commute time in city: 24.3 minutes
> Commuters who drive or carpool to work: 553,947; 89.6% of commuters
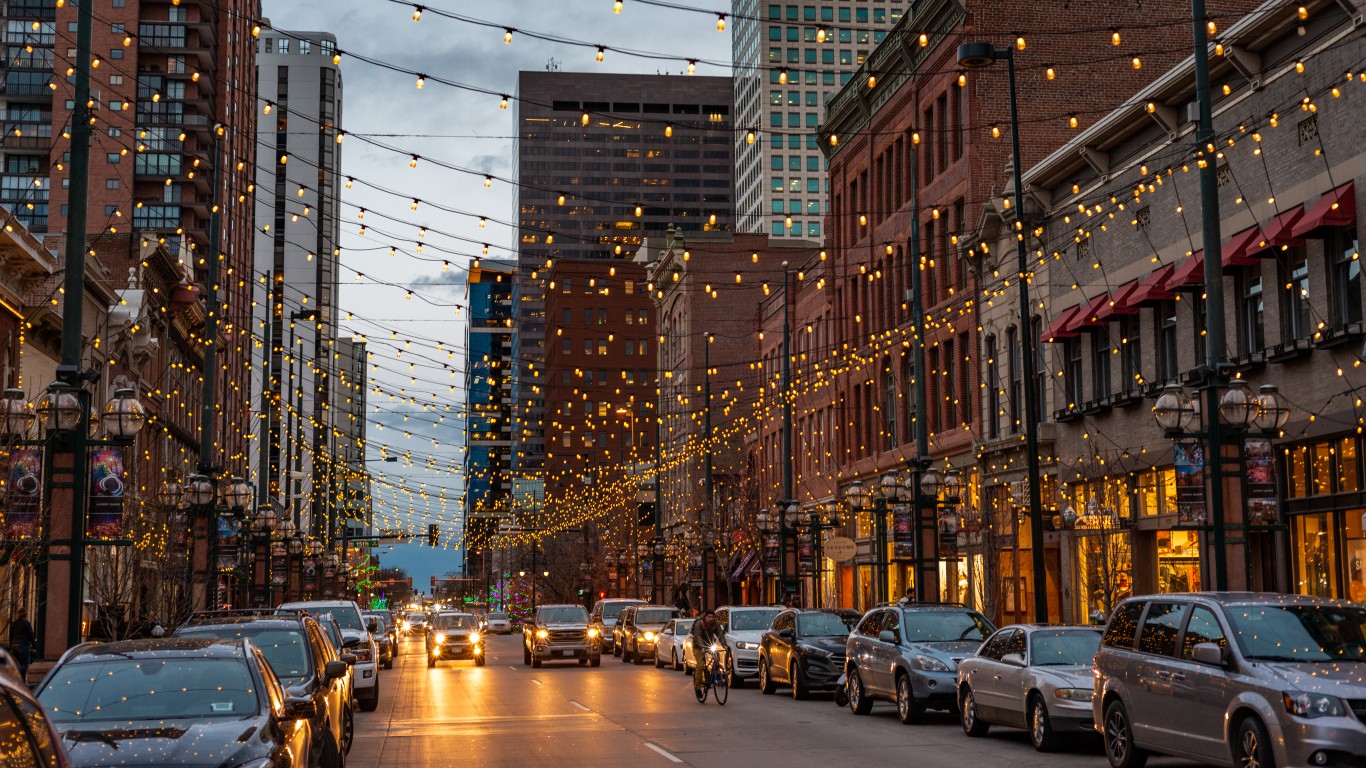
17. Denver, CO
> Avg. commute time lost to traffic delays in 2022: 54 hours per driver
> Change in traffic delays from 2021: +35%
> Avg. commute time in city: 25.5 minutes
> Commuters who drive or carpool to work: 280,340; 84.0% of commuters
[in-text-ad]
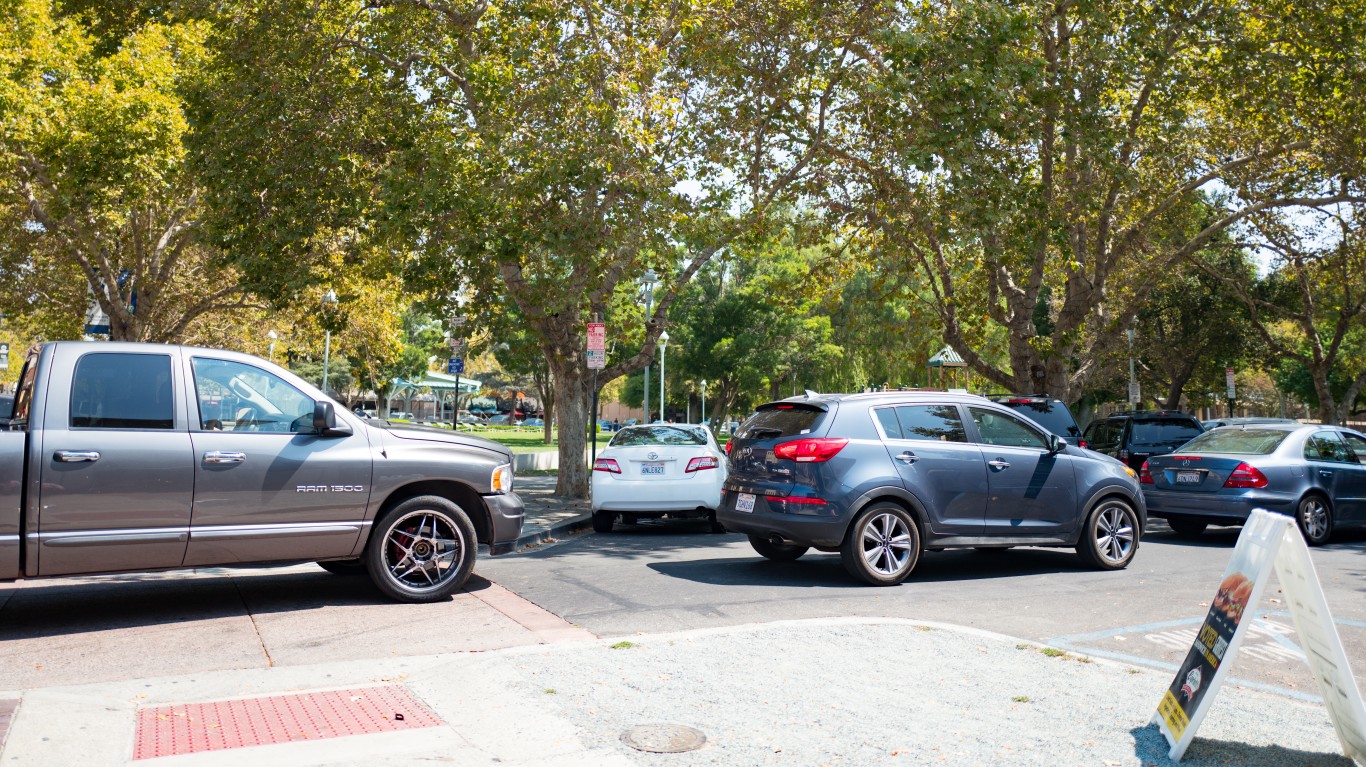
16. Concord, CA
> Avg. commute time lost to traffic delays in 2022: 54 hours per driver
> Change in traffic delays from 2021: +35%
> Avg. commute time in city: 33.9 minutes
> Commuters who drive or carpool to work: 46,887; 84.2% of commuters
[recirclink id=1184895]
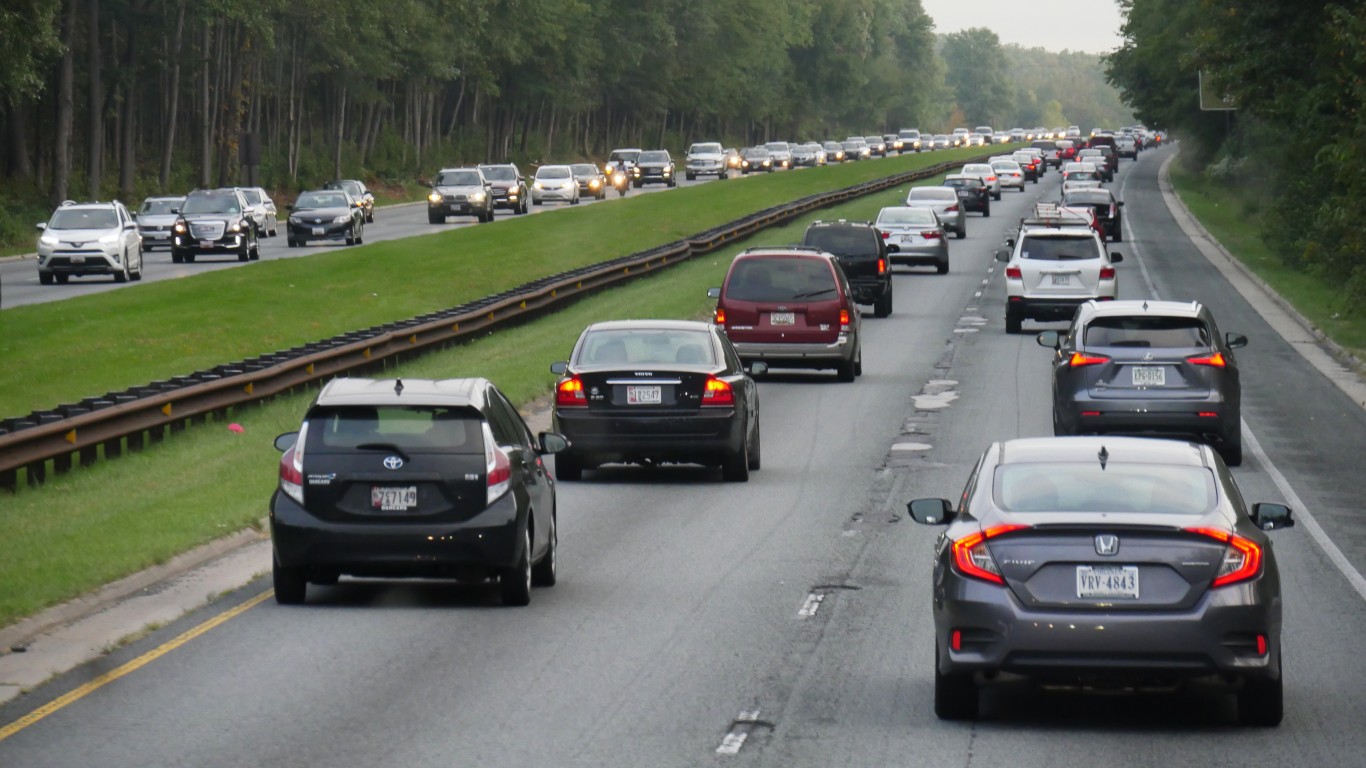
15. Baltimore, MD
> Avg. commute time lost to traffic delays in 2022: 55 hours per driver
> Change in traffic delays from 2021: +49%
> Avg. commute time in city: 30.7 minutes
> Commuters who drive or carpool to work: 179,149; 73.9% of commuters
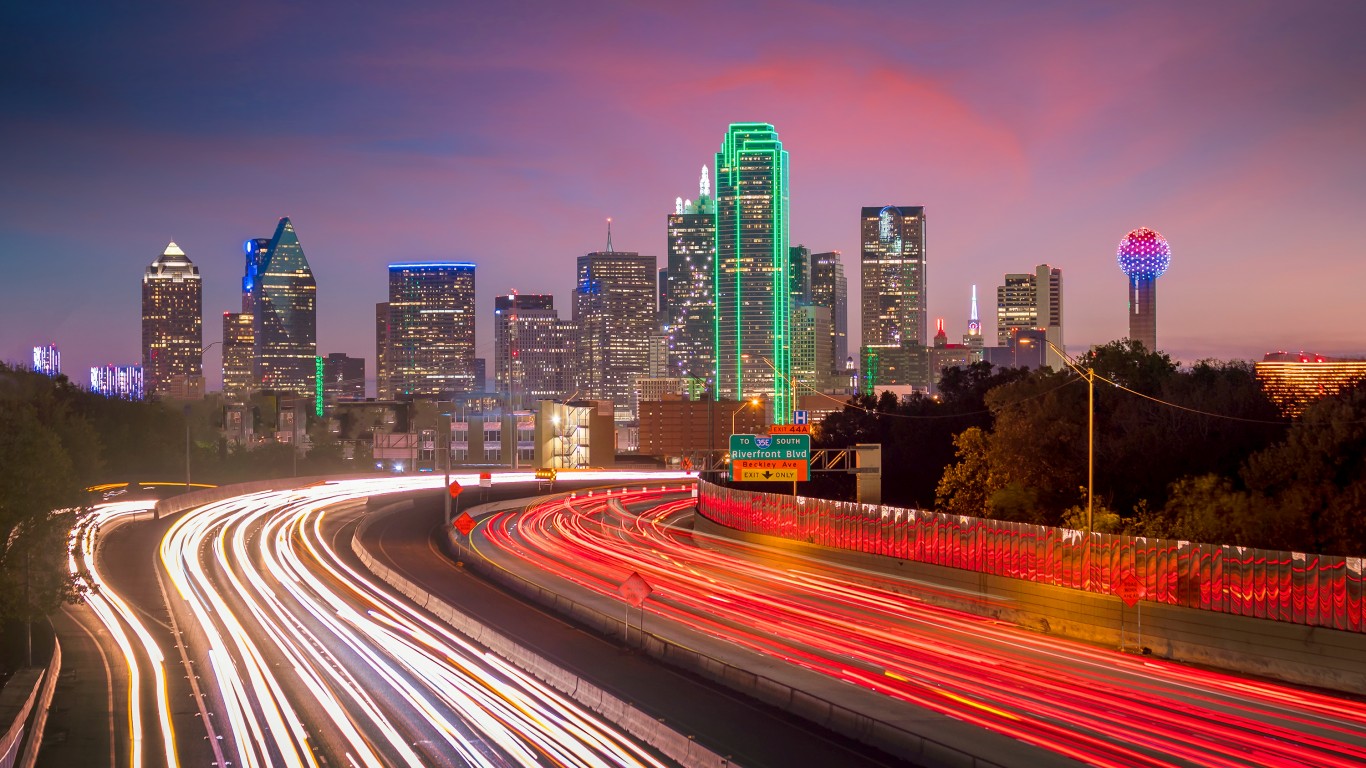
14. Dallas, TX
> Avg. commute time lost to traffic delays in 2022: 56 hours per driver
> Change in traffic delays from 2021: +28%
> Avg. commute time in city: 26.9 minutes
> Commuters who drive or carpool to work: 542,479; 92.5% of commuters
[in-text-ad-2]
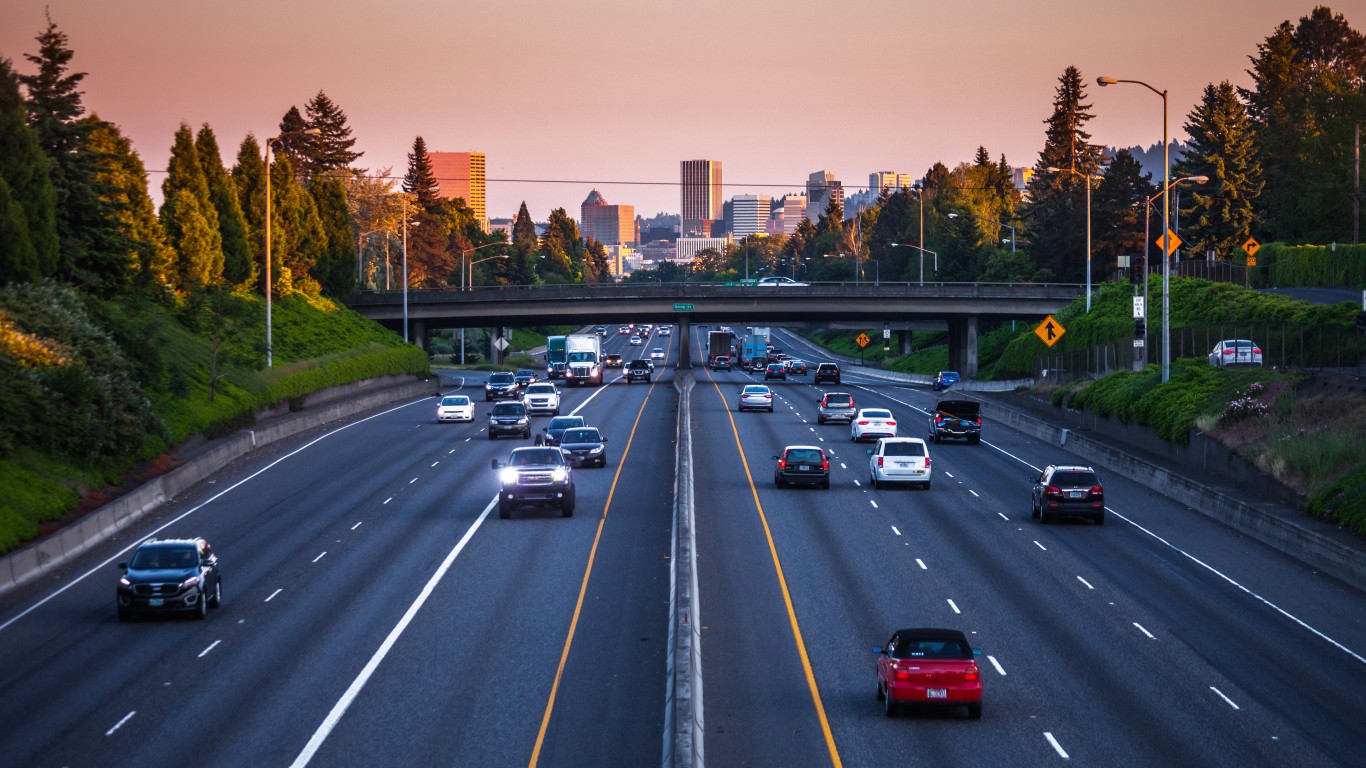
13. Portland, OR
> Avg. commute time lost to traffic delays in 2022: 72 hours per driver
> Change in traffic delays from 2021: +50%
> Avg. commute time in city: 25.5 minutes
> Commuters who drive or carpool to work: 220,404; 74.5% of commuters
12. Stamford, CT
> Avg. commute time lost to traffic delays in 2022: 73 hours per driver
> Change in traffic delays from 2021: +59%
> Avg. commute time in city: 28.4 minutes
> Commuters who drive or carpool to work: 52,207; 80.0% of commuters
[in-text-ad]
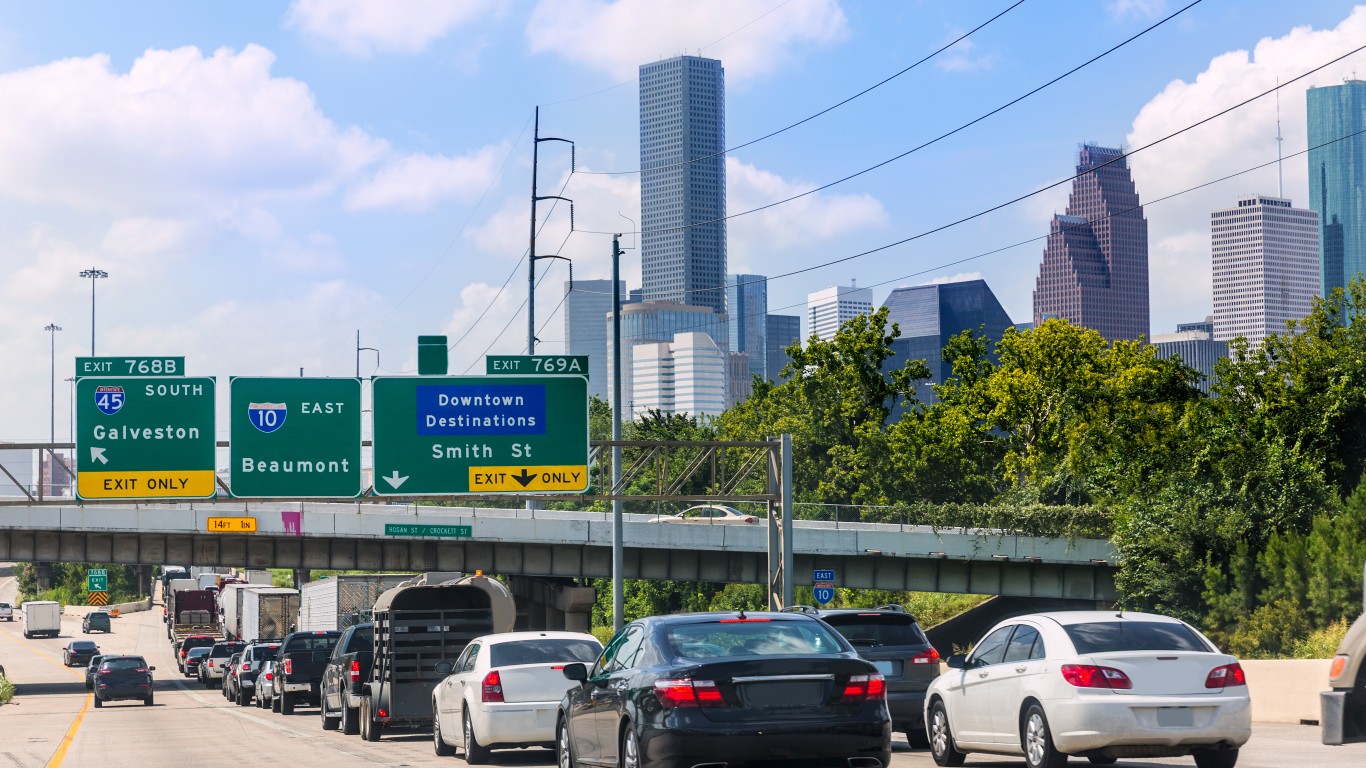
11. Houston, TX
> Avg. commute time lost to traffic delays in 2022: 74 hours per driver
> Change in traffic delays from 2021: +28%
> Avg. commute time in city: 27.5 minutes
> Commuters who drive or carpool to work: 912,664; 91.0% of commuters
[recirclink id=1204500]
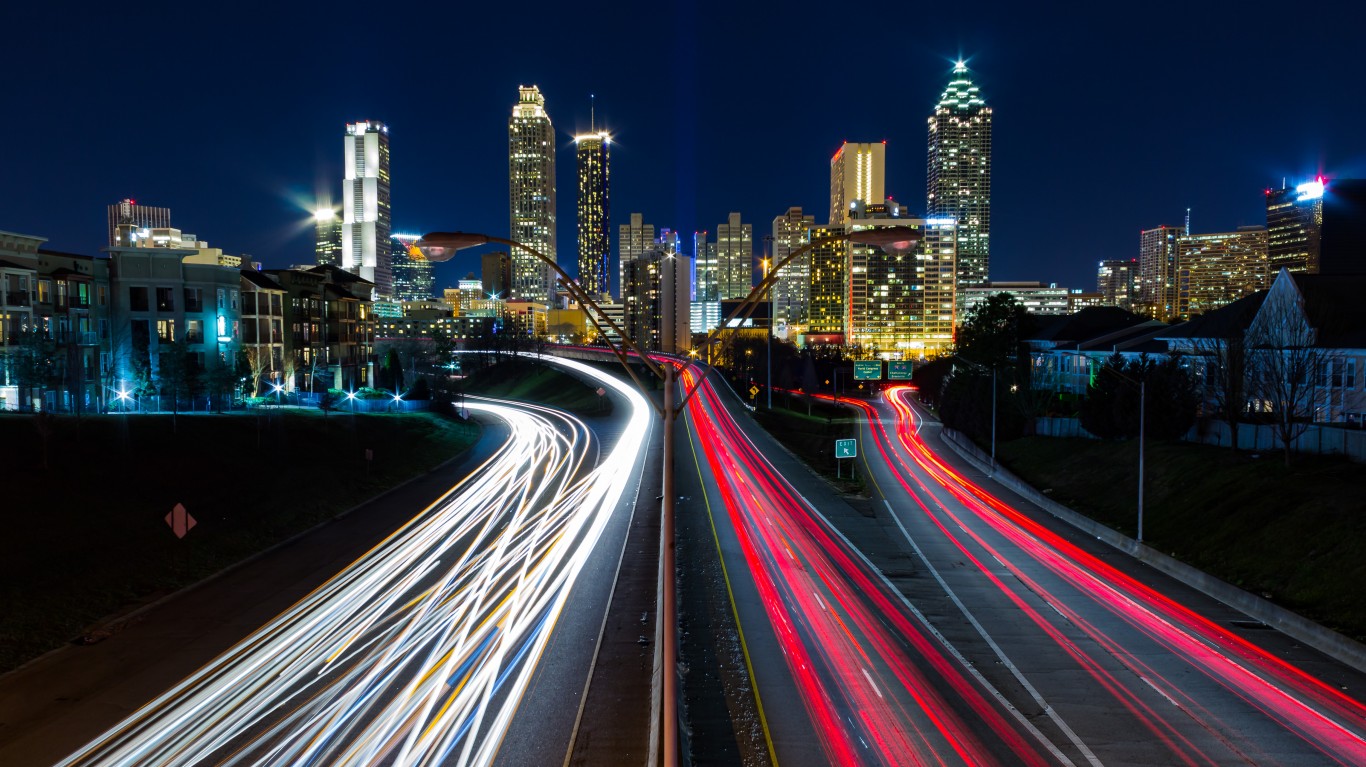
10. Atlanta, GA
> Avg. commute time lost to traffic delays in 2022: 74 hours per driver
> Change in traffic delays from 2021: +40%
> Avg. commute time in city: 27.8 minutes
> Commuters who drive or carpool to work: 163,636; 79.4% of commuters
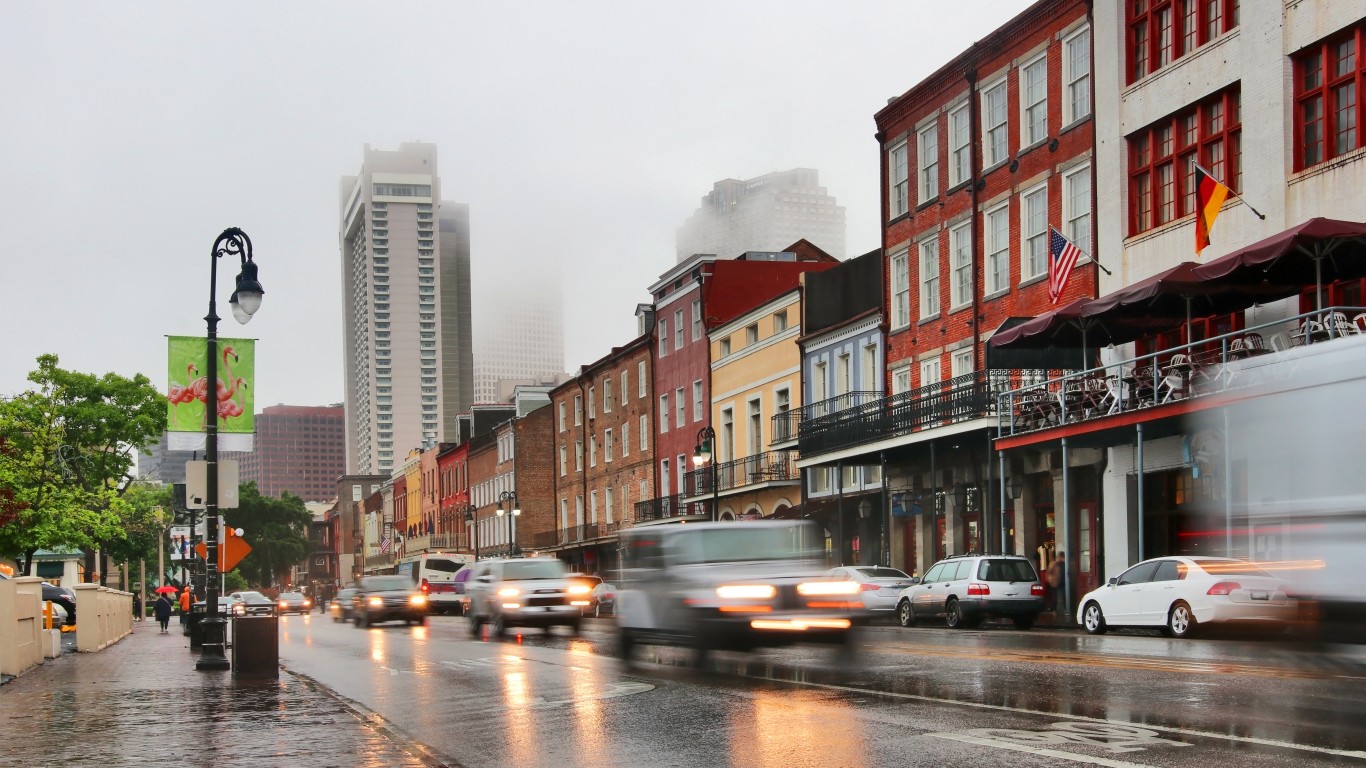
9. New Orleans, LA
> Avg. commute time lost to traffic delays in 2022: 77 hours per driver
> Change in traffic delays from 2021: +22%
> Avg. commute time in city: 23.5 minutes
> Commuters who drive or carpool to work: 128,457; 82.7% of commuters
[in-text-ad-2]
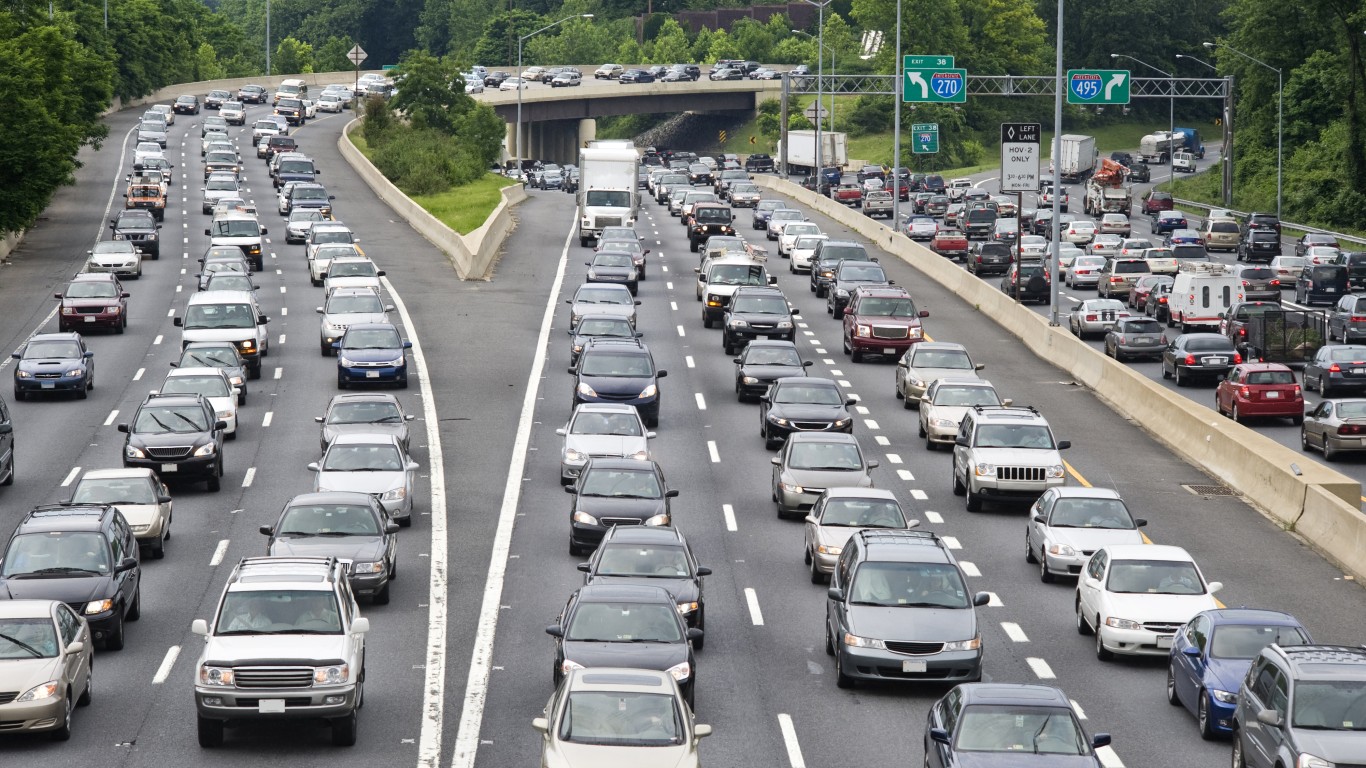
8. Washington, DC
> Avg. commute time lost to traffic delays in 2022: 83 hours per driver
> Change in traffic delays from 2021: +88%
> Avg. commute time in city: 30.4 minutes
> Commuters who drive or carpool to work: 131,329; 44.2% of commuters
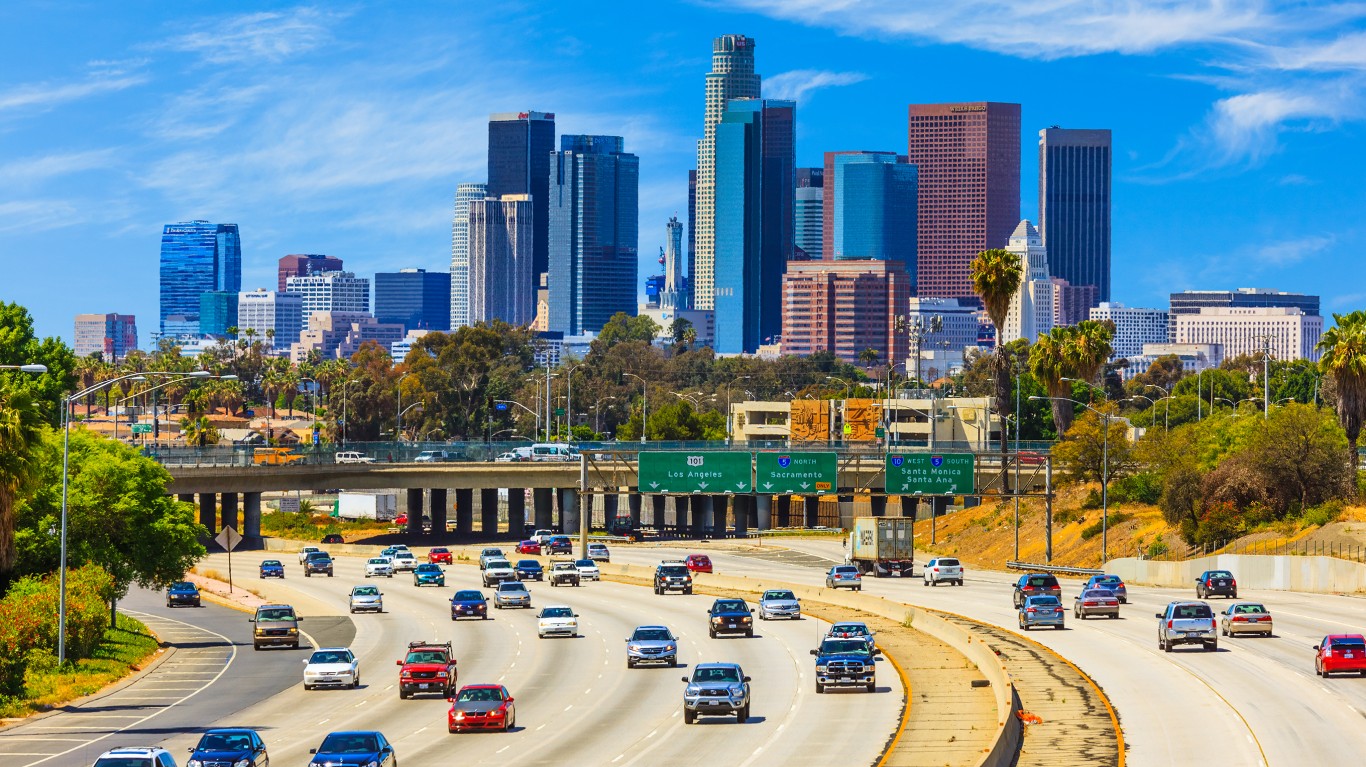
7. Los Angeles, CA
> Avg. commute time lost to traffic delays in 2022: 95 hours per driver
> Change in traffic delays from 2021: +53%
> Avg. commute time in city: 31.6 minutes
> Commuters who drive or carpool to work: 1,415,870; 84.6% of commuters
[in-text-ad]
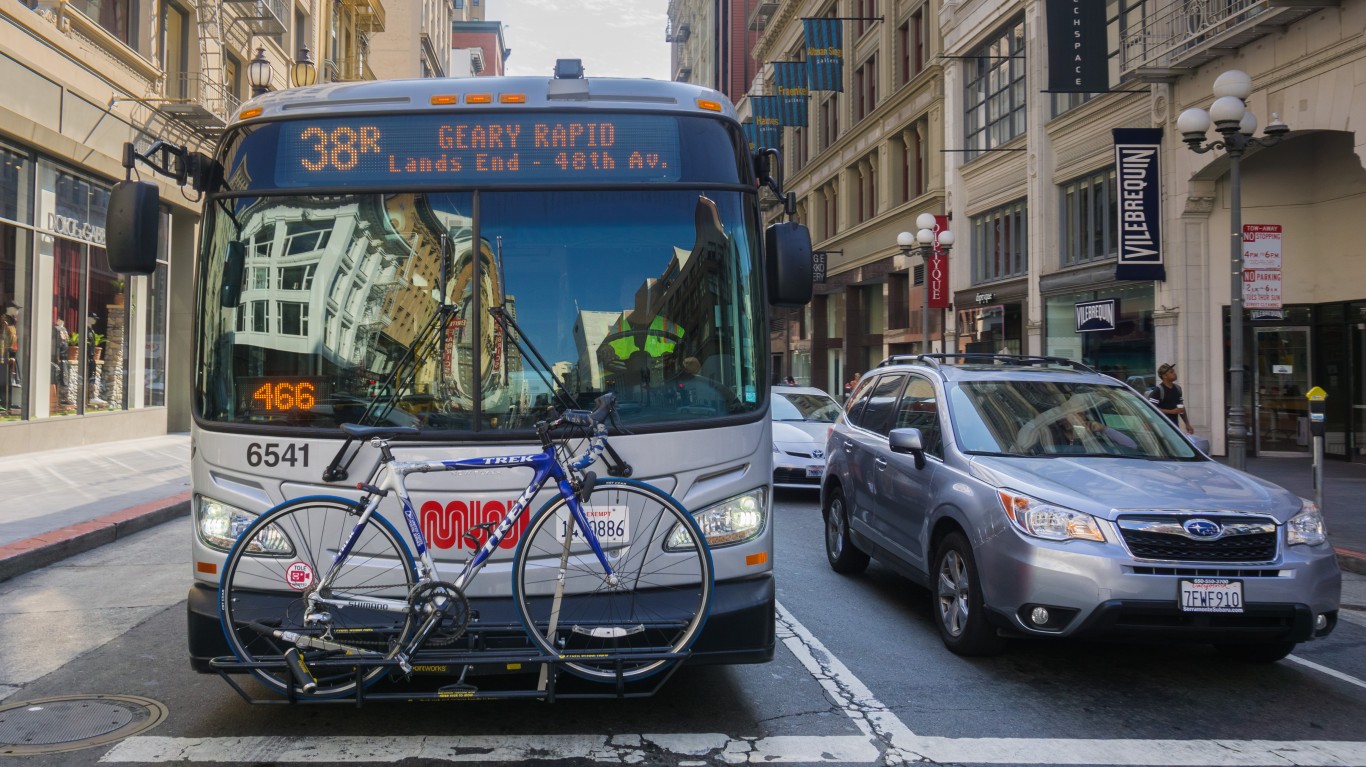
6. San Francisco, CA
> Avg. commute time lost to traffic delays in 2022: 97 hours per driver
> Change in traffic delays from 2021: +52%
> Avg. commute time in city: 32.8 minutes
> Commuters who drive or carpool to work: 179,667; 43.8% of commuters
[recirclink id=1198527]
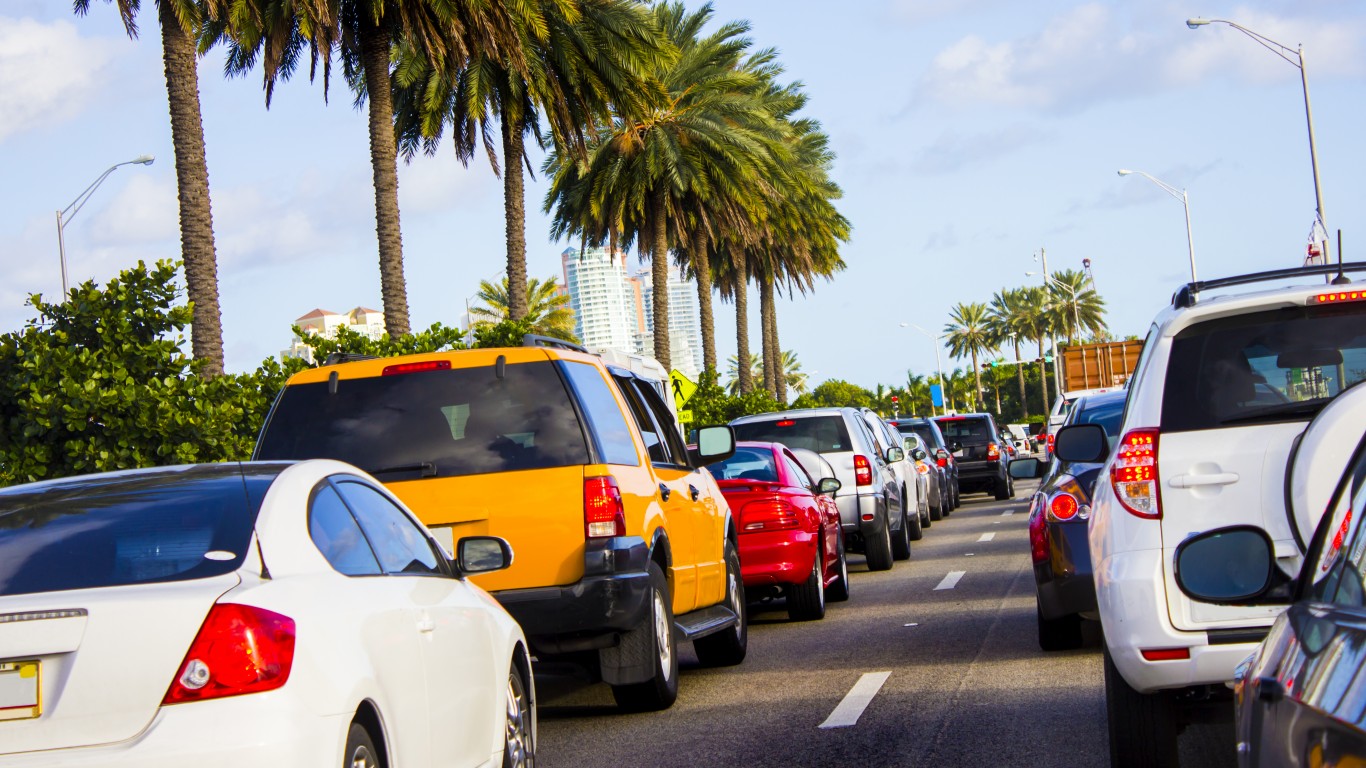
5. Miami, FL
> Avg. commute time lost to traffic delays in 2022: 105 hours per driver
> Change in traffic delays from 2021: +59%
> Avg. commute time in city: 28.0 minutes
> Commuters who drive or carpool to work: 165,042; 81.8% of commuters
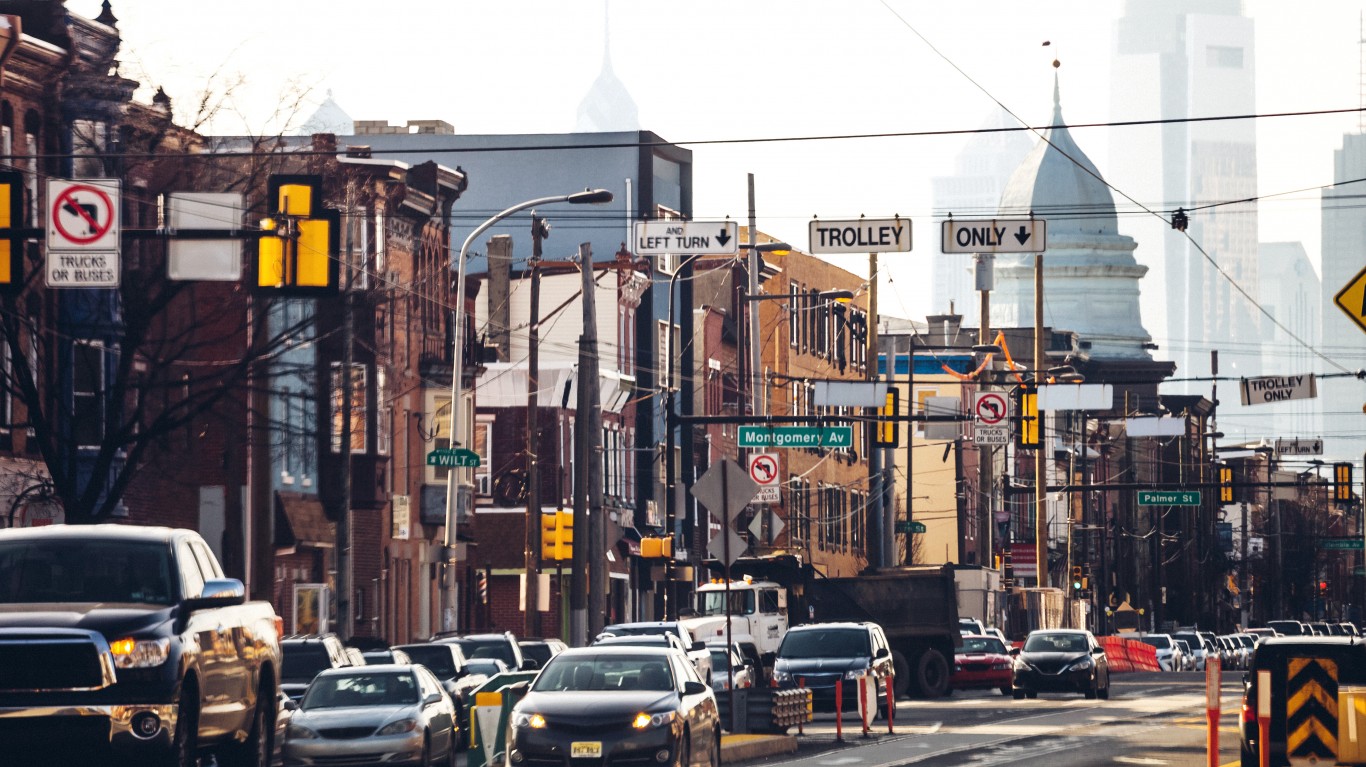
4. Philadelphia, PA
> Avg. commute time lost to traffic delays in 2022: 114 hours per driver
> Change in traffic delays from 2021: +27%
> Avg. commute time in city: 33.0 minutes
> Commuters who drive or carpool to work: 399,184; 62.9% of commuters
[in-text-ad-2]
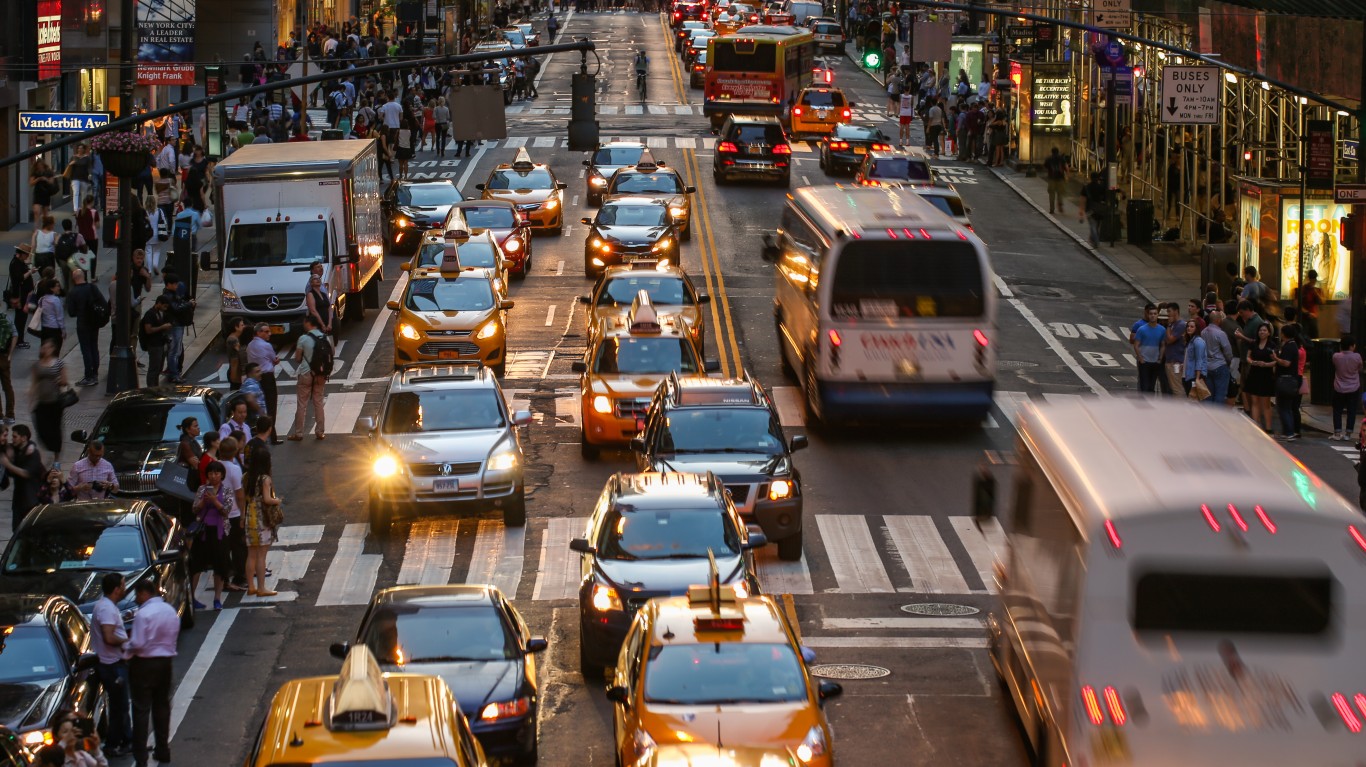
3. New York, NY
> Avg. commute time lost to traffic delays in 2022: 117 hours per driver
> Change in traffic delays from 2021: +15%
> Avg. commute time in city: 41.4 minutes
> Commuters who drive or carpool to work: 1,082,647; 30.0% of commuters
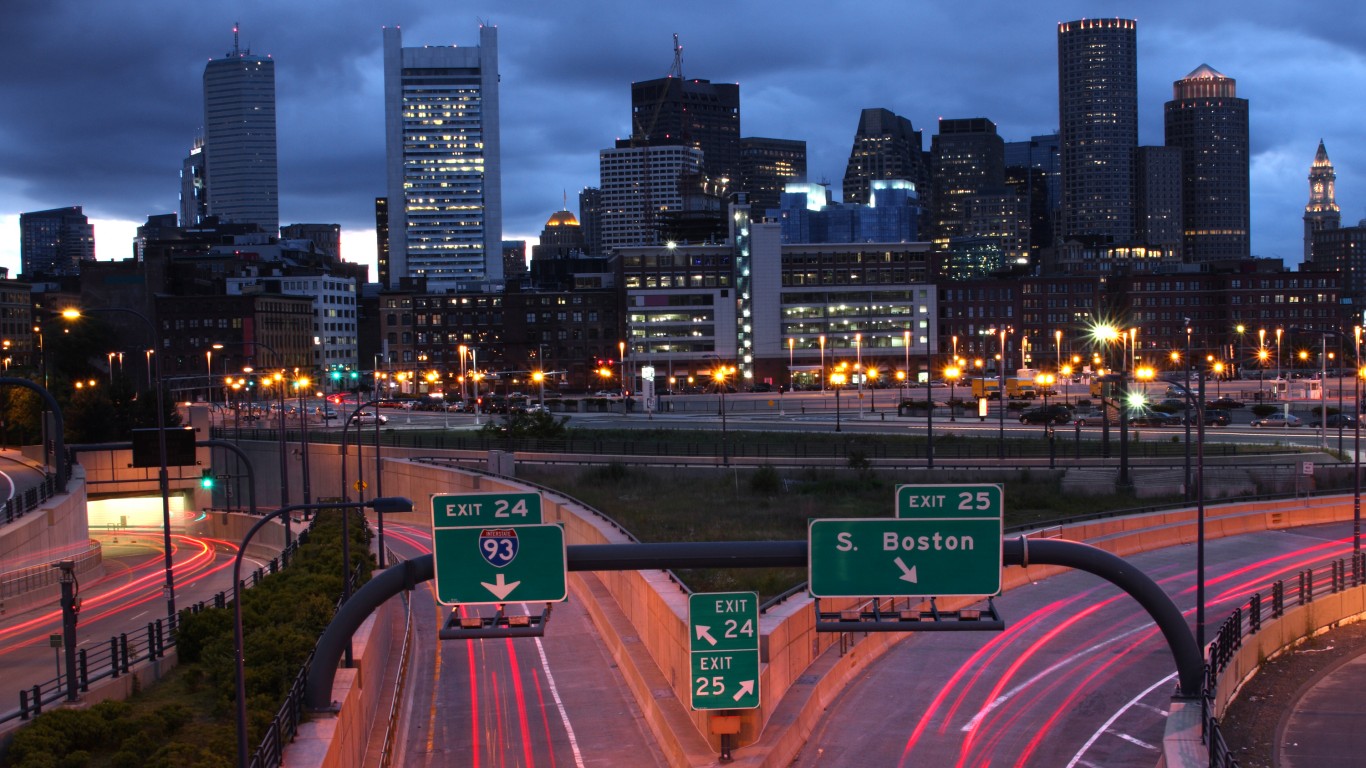
2. Boston, MA
> Avg. commute time lost to traffic delays in 2022: 134 hours per driver
> Change in traffic delays from 2021: +72%
> Avg. commute time in city: 30.6 minutes
> Commuters who drive or carpool to work: 151,856; 47.3% of commuters
[in-text-ad]
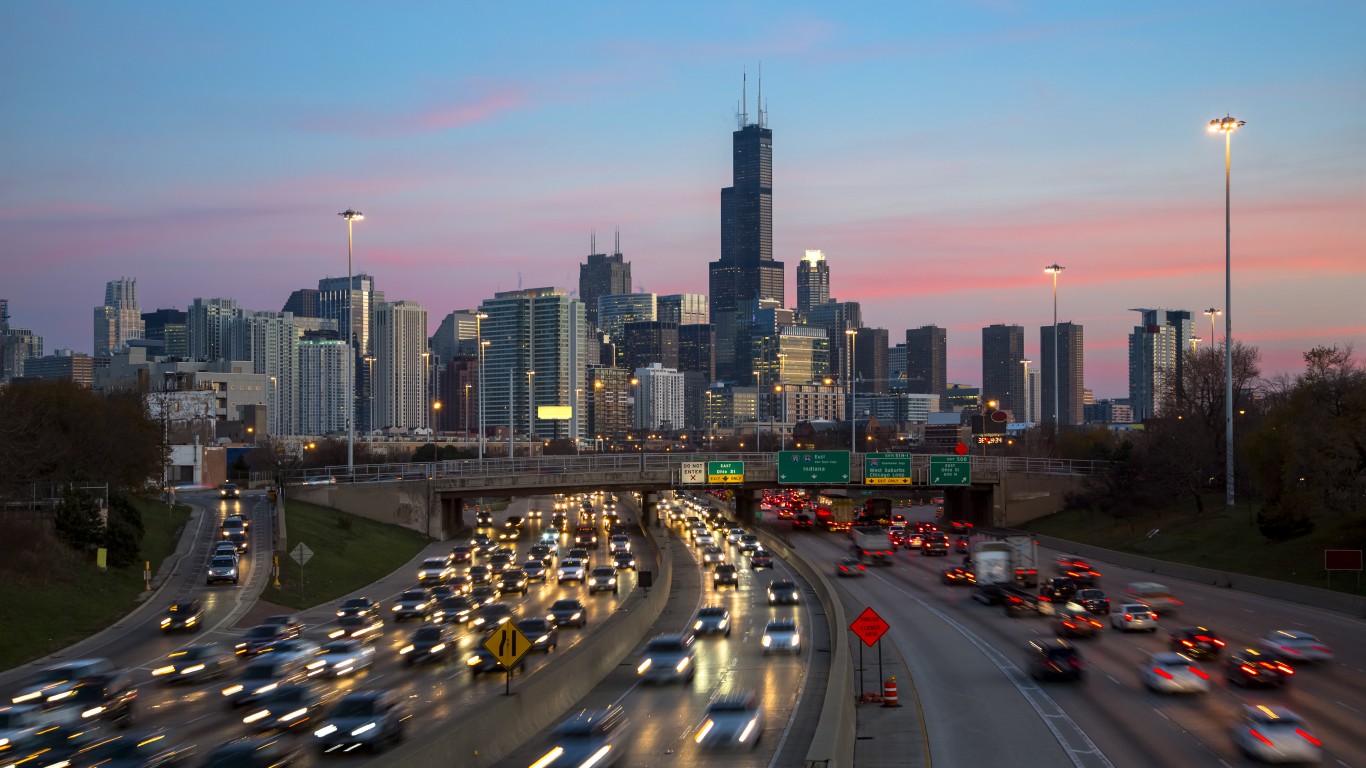
1. Chicago, IL
> Avg. commute time lost to traffic delays in 2022: 155 hours per driver
> Change in traffic delays from 2021: +49%
> Avg. commute time in city: 34.4 minutes
> Commuters who drive or carpool to work: 743,250; 62.7% of commuters
Methodology
To identify the cities with the worst traffic, 24/7 Wall St. reviewed data from the 2022 Global Traffic Scorecard, from INRIX, a traffic data and analytics company. We used the average time the typical commuter lost to traffic congestion in 2022 in the 292 U.S. cities with available data. Only the 32 U.S. cities where the typical commuter spent 30 or more hours sitting in traffic in 2022 are ranked. In the case of a tie, the city with the longer average commute time ranks lower.
Supplementary data on average commute time for those not working from home and the number and share of commuters who drive or carpool to work are five-year estimates from the U.S. Census Bureau’s 2021 American Community Survey.
Data on change in the average traffic delays from 2021 is also from INRIX.