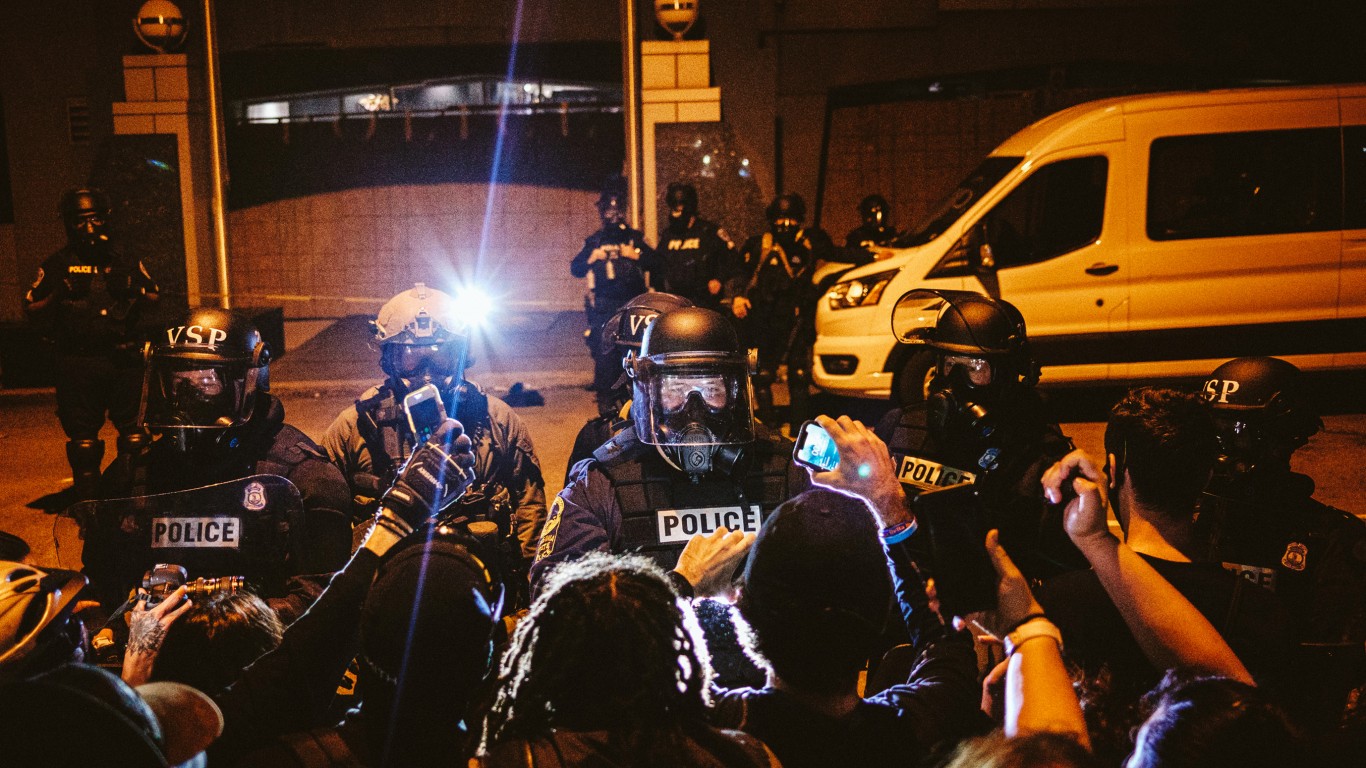
Police have killed 1,080 people nationwide so far in 2023 (updated Oct. 30), according to Mapping Police Violence. While many of the people killed were allegedly armed with a knife or a gun, with some attacking the officers or using or brandishing their weapons, a significant portion of people killed by police were unarmed.
In some states, police killings per capita are far higher than in other states. For example, in Texas, nearly 8.97 people were killed by police for every million residents so far this year, while in Massachusetts, 0.57 people were killed by police for every million residents so far in 2023. Within each state, some police departments report disproportionate killings. (Also see: the standard issue police sidearm in America’s 10 biggest cities.)
To determine the police department that has killed the most people in each state, 24/7 Wall St. reviewed data from Mapping Police Violence, a research collaborative that collects data on police killings across the nation from three large crowdsourced databases. Data was accessed on Feb. 22, 2023, and includes all police department killings from 2013 through the end of 2022.
Police departments in three of the cities on the list — Los Angeles, New York, and Phoenix — have killed more than 100 suspects from 2013 to 2022. While New York and L.A. are the two largest U.S. cities by population, Phoenix is the fifth most-populous city. Despite this, Phoenix Police Department reported 142 killings, less than the Los Angeles PD with 167 killings, but more than the NYPD with 102 killings. (Here is what you have to do to join the police in every state.)
The proportion of Black suspects killed by police is regularly higher than the proportion of residents identifying as Black in the local population. In St. Louis, Detroit, and Atlanta, between 91% and 96% of people killed by police officers between 2013 and 2022 were Black.
Here are the U.S. police departments that have killed the most people in every state.
Alabama: Birmingham Police Department

- Documented police killings (2013-2022): 13 — #139 most (6.2% of state killings)
- Police killings in 2022: 1
- % of those killed who were Black: 61.5% (total: 8)
- % of those killed who did not have a gun: 30.8% (total: 4)
- % of those killed who were fleeing: 50.0% (total: 4)
- % of cases officer was disciplined or charged with a crime: 10.0% (total: 1)
Alaska: Alaska State Troopers
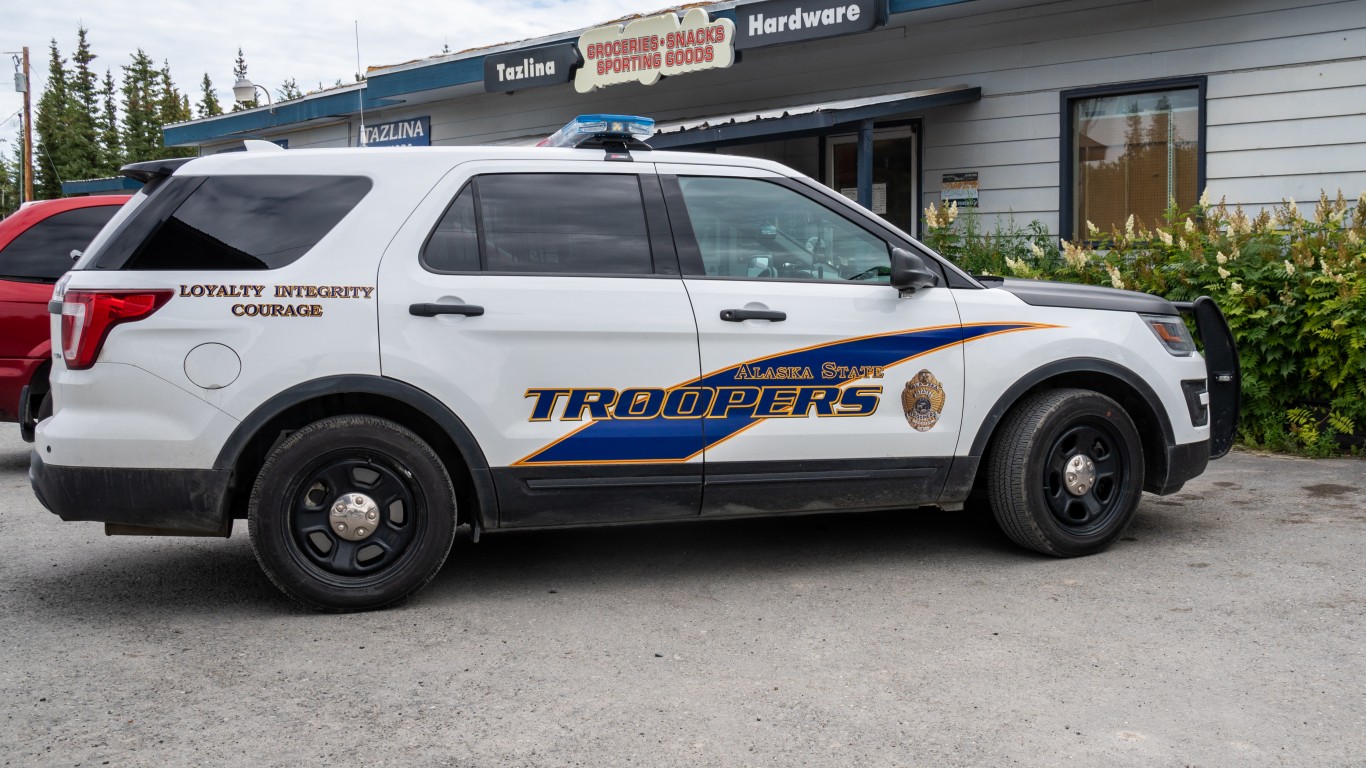
- Documented police killings (2013-2022): 24 — #60 most (36.9% of state killings)
- Police killings in 2022: 2
- % of those killed who were Black: 4.8% (total: 1)
- % of those killed who did not have a gun: 43.5% (total: 10)
- % of those killed who were fleeing: 29.4% (total: 5)
- % of cases officer was disciplined or charged with a crime: 0.0% (total: 0)
Arizona: Phoenix Police Department

- Documented police killings (2013-2022): 142 — #2 most (28.9% of state killings)
- Police killings in 2022: 10
- % of those killed who were Black: 17.4% (total: 23)
- % of those killed who did not have a gun: 47.9% (total: 67)
- % of those killed who were fleeing: 30.2% (total: 29)
- % of cases officer was disciplined or charged with a crime: 0.0% (total: 0)
Arkansas: Arkansas State Police
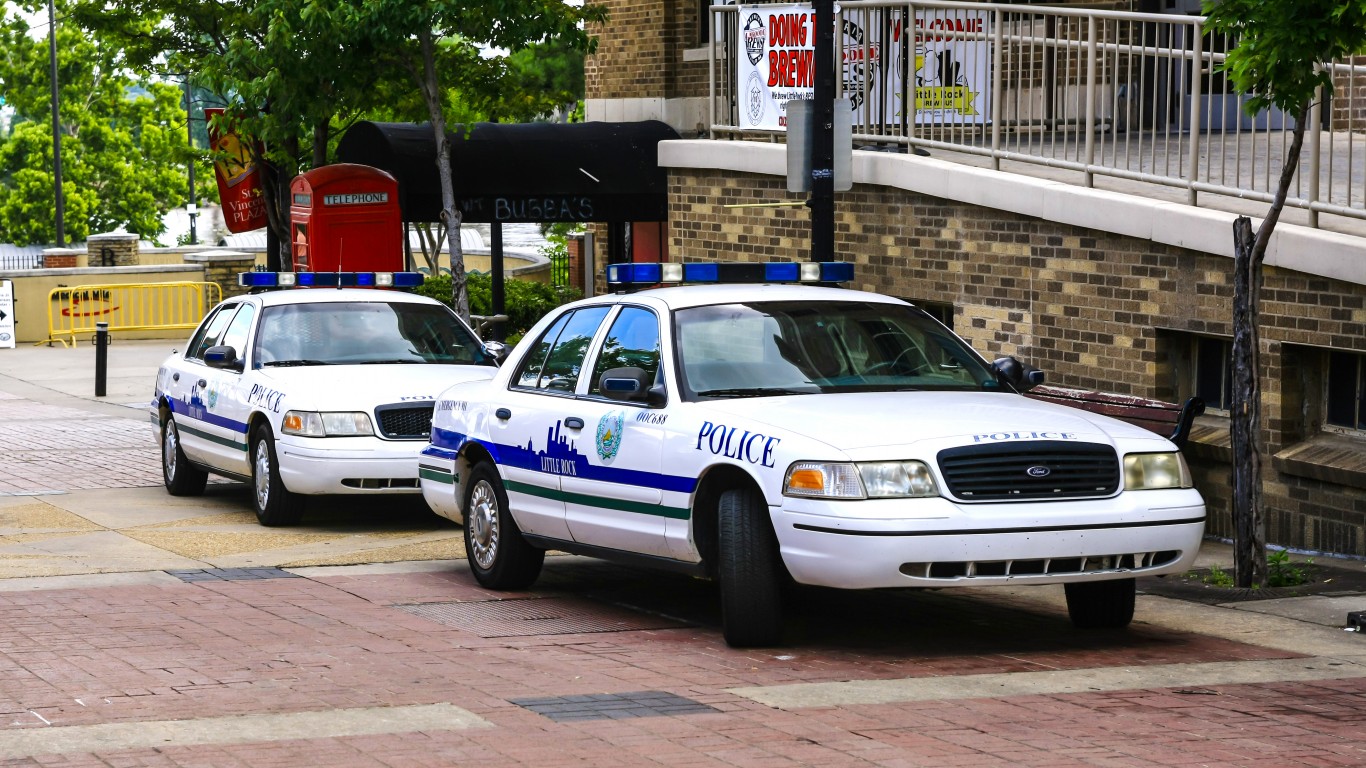
- Documented police killings (2013-2022): 15 — #111 most (10.2% of state killings)
- Police killings in 2022: 2
- % of those killed who were Black: 46.2% (total: 6)
- % of those killed who did not have a gun: 46.7% (total: 7)
- % of those killed who were fleeing: 66.7% (total: 6)
- % of cases officer was disciplined or charged with a crime: 0.0% (total: 0)
California: Los Angeles Police Department
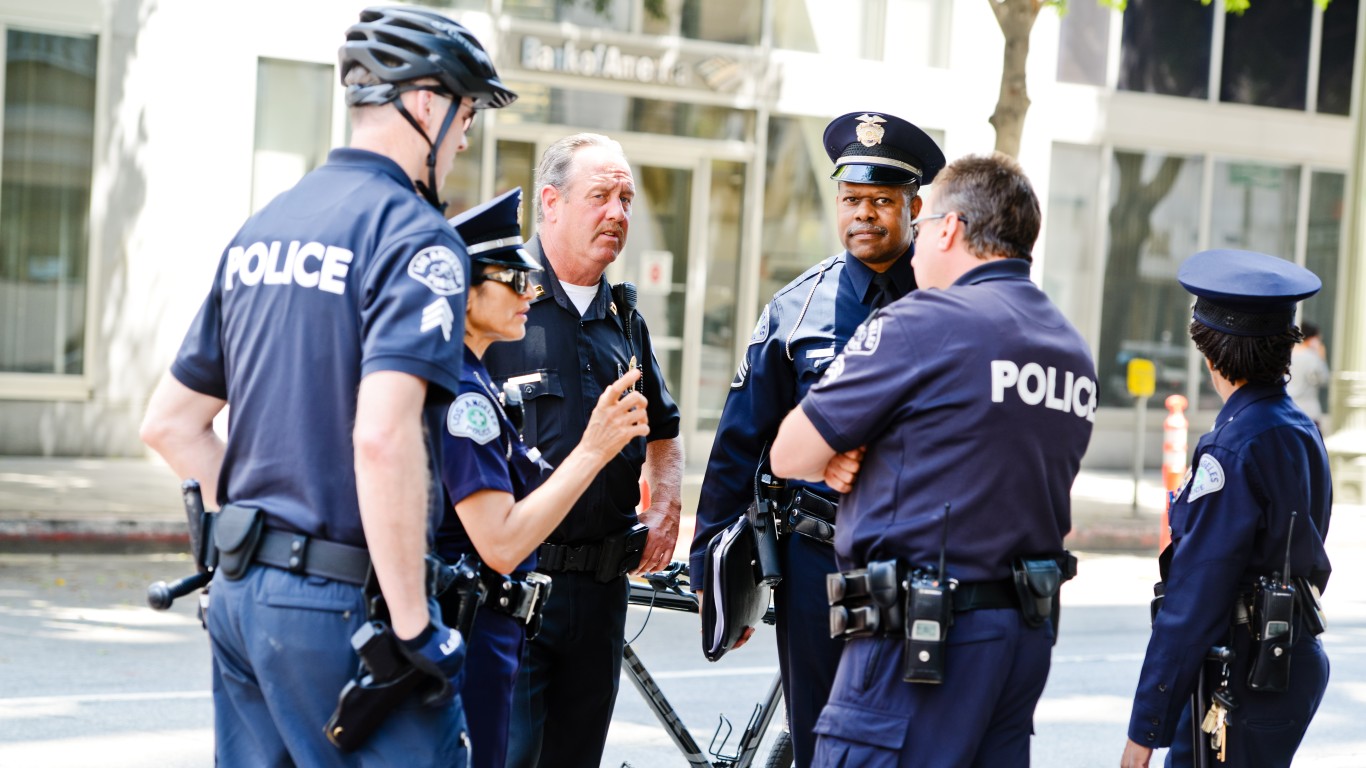
- Documented police killings (2013-2022): 167 — #1 most (10.1% of state killings)
- Police killings in 2022: 15
- % of those killed who were Black: 19.5% (total: 31)
- % of those killed who did not have a gun: 54.4% (total: 87)
- % of those killed who were fleeing: 35.2% (total: 37)
- % of cases officer was disciplined or charged with a crime: 2.1% (total: 2)
Colorado: Denver Police Department
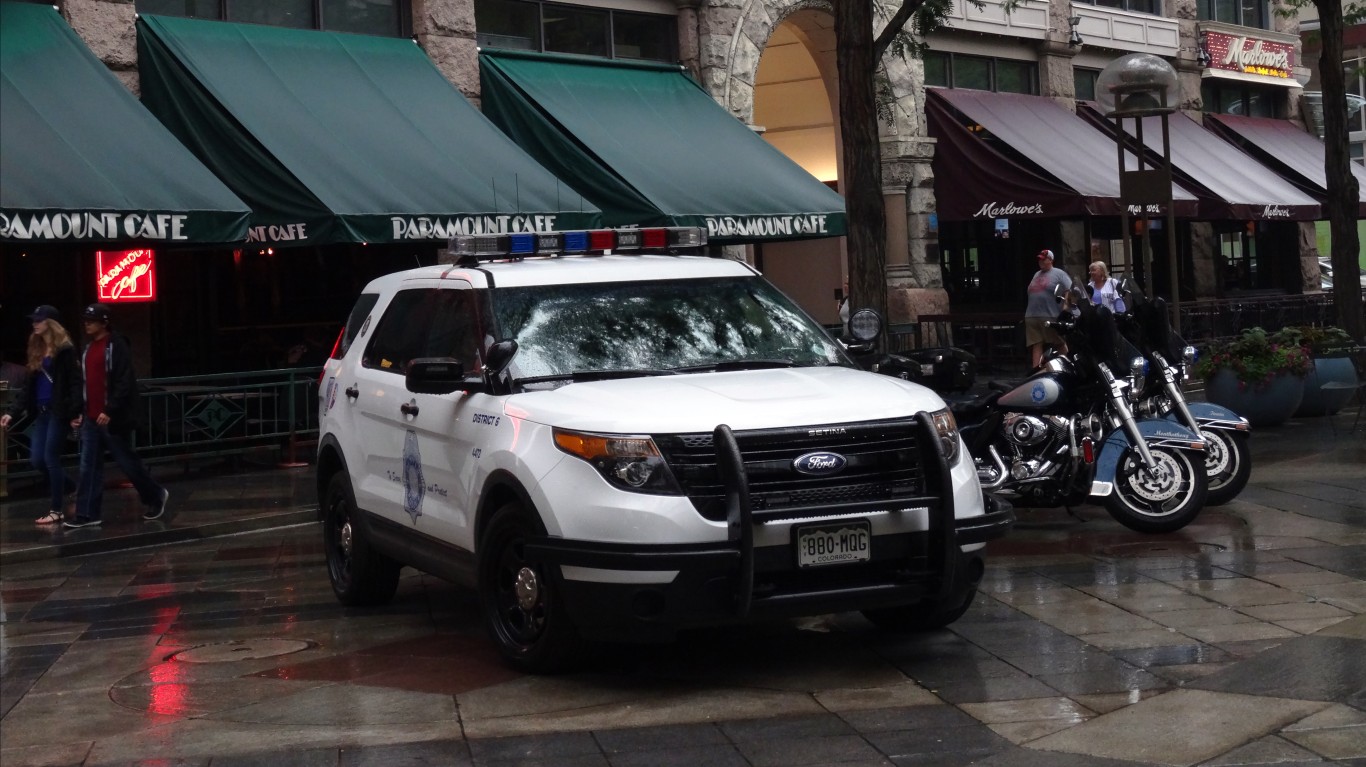
- Documented police killings (2013-2022): 45 — #22 most (12.8% of state killings)
- Police killings in 2022: 3
- % of those killed who were Black: 17.5% (total: 7)
- % of those killed who did not have a gun: 32.6% (total: 14)
- % of those killed who were fleeing: 48.6% (total: 17)
- % of cases officer was disciplined or charged with a crime: 0.0% (total: 0)
Connecticut: Connecticut State Police

- Documented police killings (2013-2022): 9 — #214 most (19.6% of state killings)
- Police killings in 2022: 1
- % of those killed who were Black: 25.0% (total: 2)
- % of those killed who did not have a gun: 77.8% (total: 7)
- % of those killed who were fleeing: 50.0% (total: 3)
- % of cases officer was disciplined or charged with a crime: 16.7% (total: 1)
Delaware: Delaware State Police

- Documented police killings (2013-2022): 11 — #167 most (42.3% of state killings)
- Police killings in 2022: 0
- % of those killed who were Black: 40.0% (total: 4)
- % of those killed who did not have a gun: 45.5% (total: 5)
- % of those killed who were fleeing: 33.3% (total: 3)
- % of cases officer was disciplined or charged with a crime: 0.0% (total: 0)
Florida: Miami-Dade Police Department

- Documented police killings (2013-2022): 60 — #11 most (7.8% of state killings)
- Police killings in 2022: 7
- % of those killed who were Black: 38.5% (total: 20)
- % of those killed who did not have a gun: 51.9% (total: 28)
- % of those killed who were fleeing: 38.2% (total: 13)
- % of cases officer was disciplined or charged with a crime: 0.0% (total: 0)
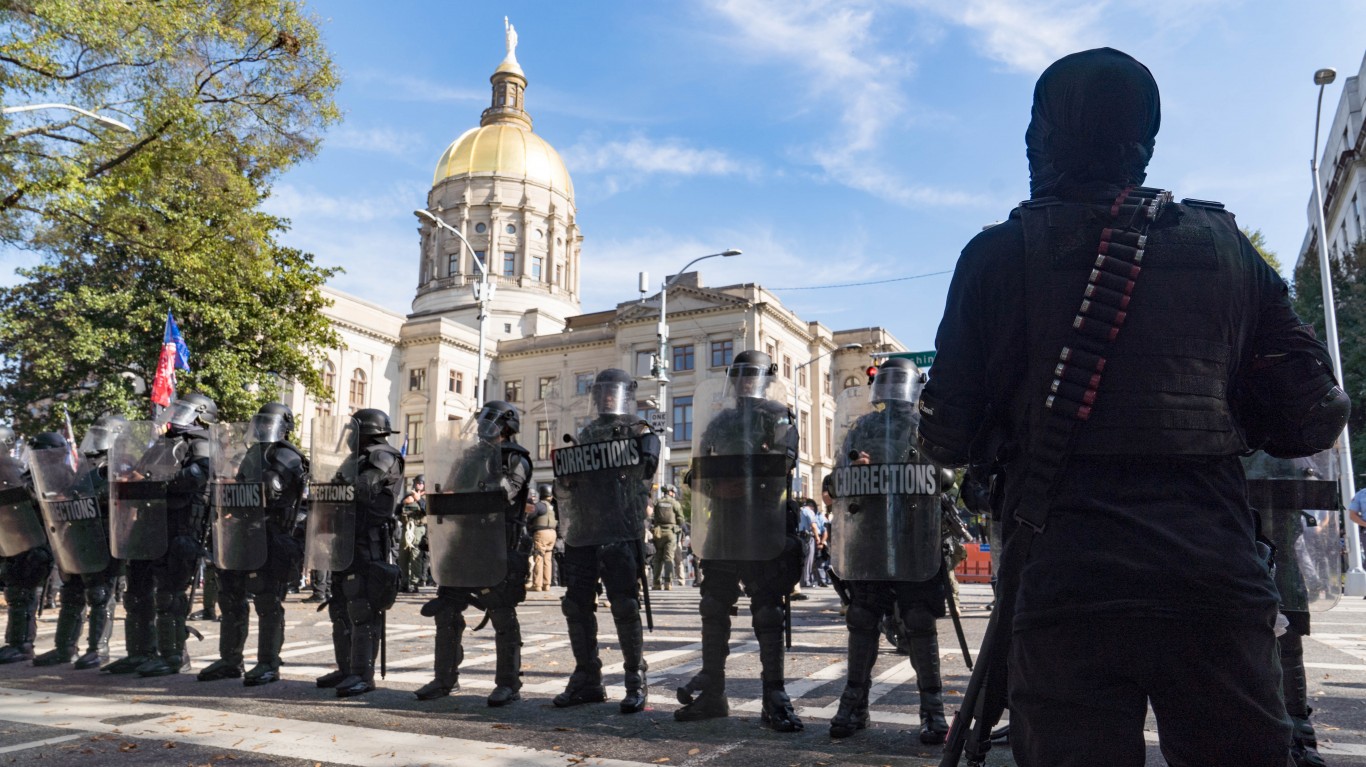
Georgia: Atlanta Police Department
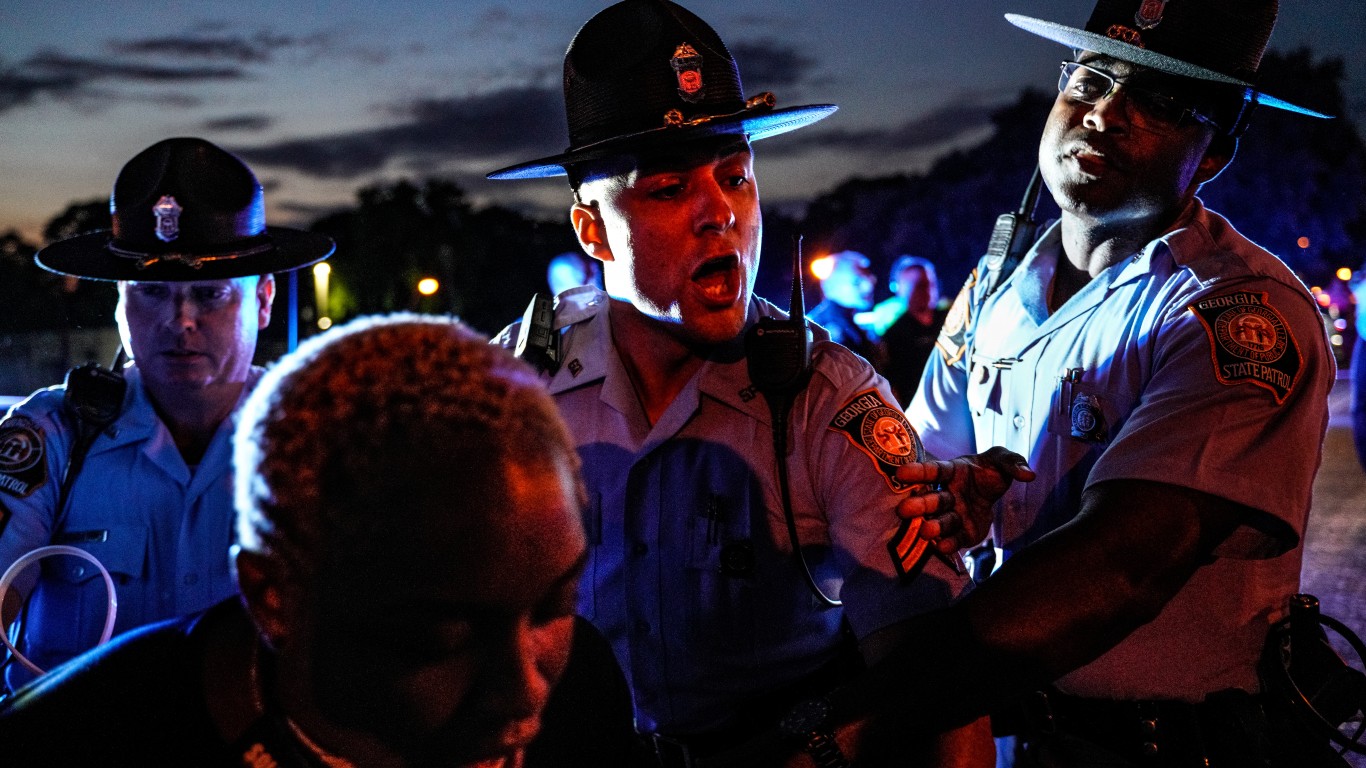
- Documented police killings (2013-2022): 28 — #48 most (6.5% of state killings)
- Police killings in 2022: 6
- % of those killed who were Black: 96.2% (total: 25)
- % of those killed who did not have a gun: 54.2% (total: 13)
- % of those killed who were fleeing: 44.4% (total: 8)
- % of cases officer was disciplined or charged with a crime: 21.4% (total: 3)
Hawaii: Honolulu Police Department

- Documented police killings (2013-2022): 28 — #48 most (58.3% of state killings)
- Police killings in 2022: 1
- % of those killed who were Black: 3.8% (total: 1)
- % of those killed who did not have a gun: 82.1% (total: 23)
- % of those killed who were fleeing: 27.8% (total: 5)
- % of cases officer was disciplined or charged with a crime: 4.5% (total: 1)
Idaho: Boise Police Department
- Documented police killings (2013-2022): 10 — #186 most (12.7% of state killings)
- Police killings in 2022: 0
- % of those killed who were Black: 0.0% (total: 0)
- % of those killed who did not have a gun: 33.3% (total: 3)
- % of those killed who were fleeing: 14.3% (total: 1)
- % of cases officer was disciplined or charged with a crime: 0.0% (total: 0)
Illinois: Chicago Police Department
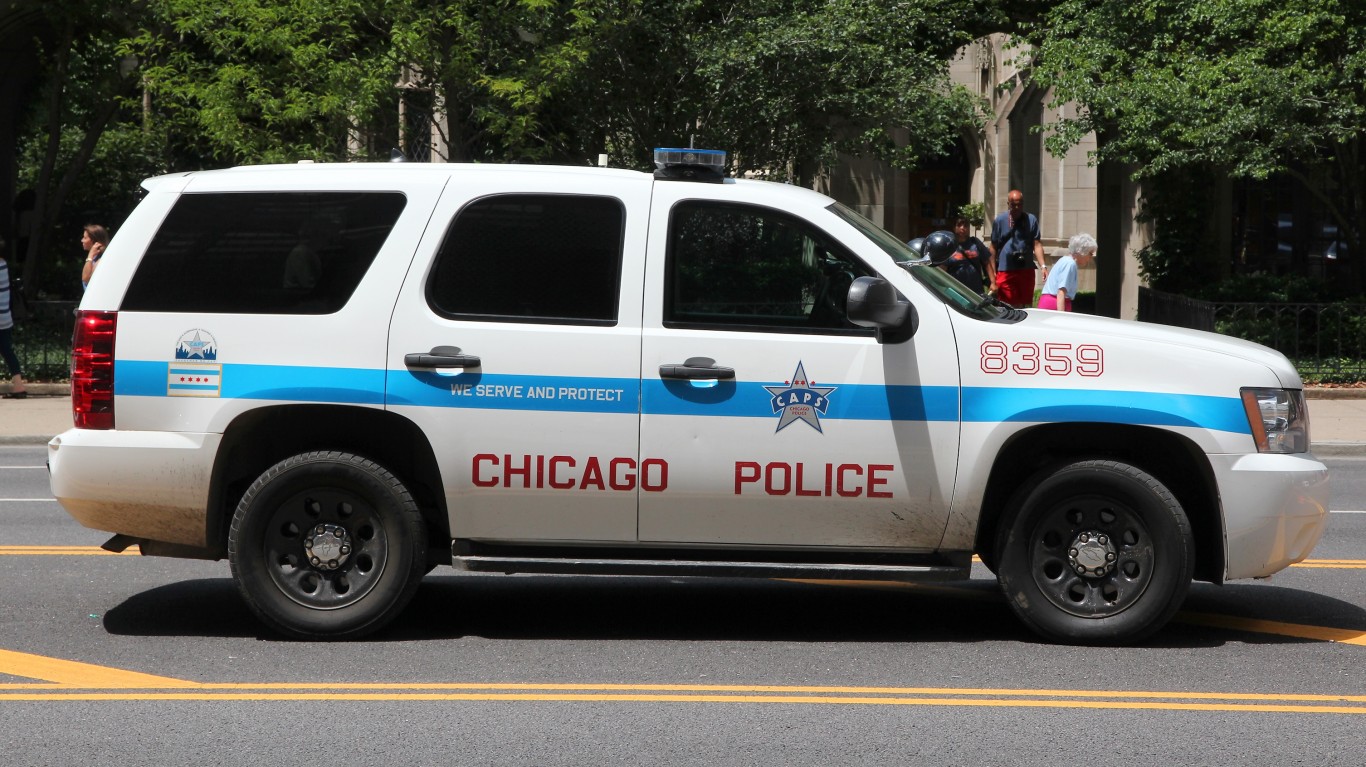
- Documented police killings (2013-2022): 92 — #6 most (35.8% of state killings)
- Police killings in 2022: 2
- % of those killed who were Black: 74.2% (total: 66)
- % of those killed who did not have a gun: 44.7% (total: 38)
- % of those killed who were fleeing: 49.0% (total: 25)
- % of cases officer was disciplined or charged with a crime: 13.0% (total: 7)
Indiana: Indianapolis Metropolitan Police Department

- Documented police killings (2013-2022): 34 — #34 most (17.9% of state killings)
- Police killings in 2022: 2
- % of those killed who were Black: 65.6% (total: 21)
- % of those killed who did not have a gun: 26.5% (total: 9)
- % of those killed who were fleeing: 35.0% (total: 7)
- % of cases officer was disciplined or charged with a crime: 0.0% (total: 0)
Iowa: Des Moines Police Department

- Documented police killings (2013-2022): 8 — #242 most (12.1% of state killings)
- Police killings in 2022: 1
- % of those killed who were Black: 28.6% (total: 2)
- % of those killed who did not have a gun: 37.5% (total: 3)
- % of those killed who were fleeing: 80.0% (total: 4)
- % of cases officer was disciplined or charged with a crime: 0.0% (total: 0)
Kansas: Wichita Police Department

- Documented police killings (2013-2022): 16 — #100 most (15.0% of state killings)
- Police killings in 2022: 0
- % of those killed who were Black: 6.3% (total: 1)
- % of those killed who did not have a gun: 43.8% (total: 7)
- % of those killed who were fleeing: 40.0% (total: 4)
- % of cases officer was disciplined or charged with a crime: 0.0% (total: 0)
Kentucky: Kentucky State Police
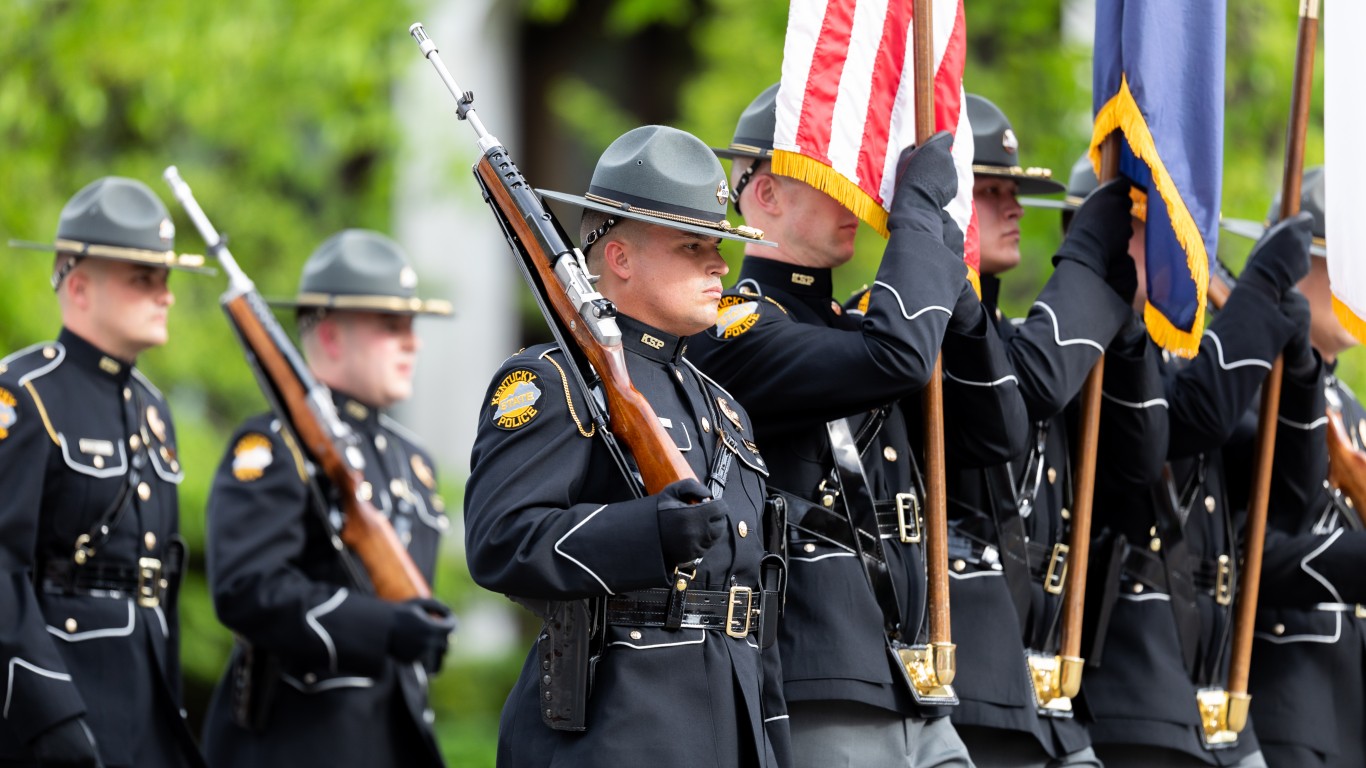
- Documented police killings (2013-2022): 55 — #14 most (30.1% of state killings)
- Police killings in 2022: 6
- % of those killed who were Black: 4.5% (total: 2)
- % of those killed who did not have a gun: 34.0% (total: 17)
- % of those killed who were fleeing: 38.2% (total: 13)
- % of cases officer was disciplined or charged with a crime: 0.0% (total: 0)
Louisiana: Jefferson Parish Sheriff’s Office
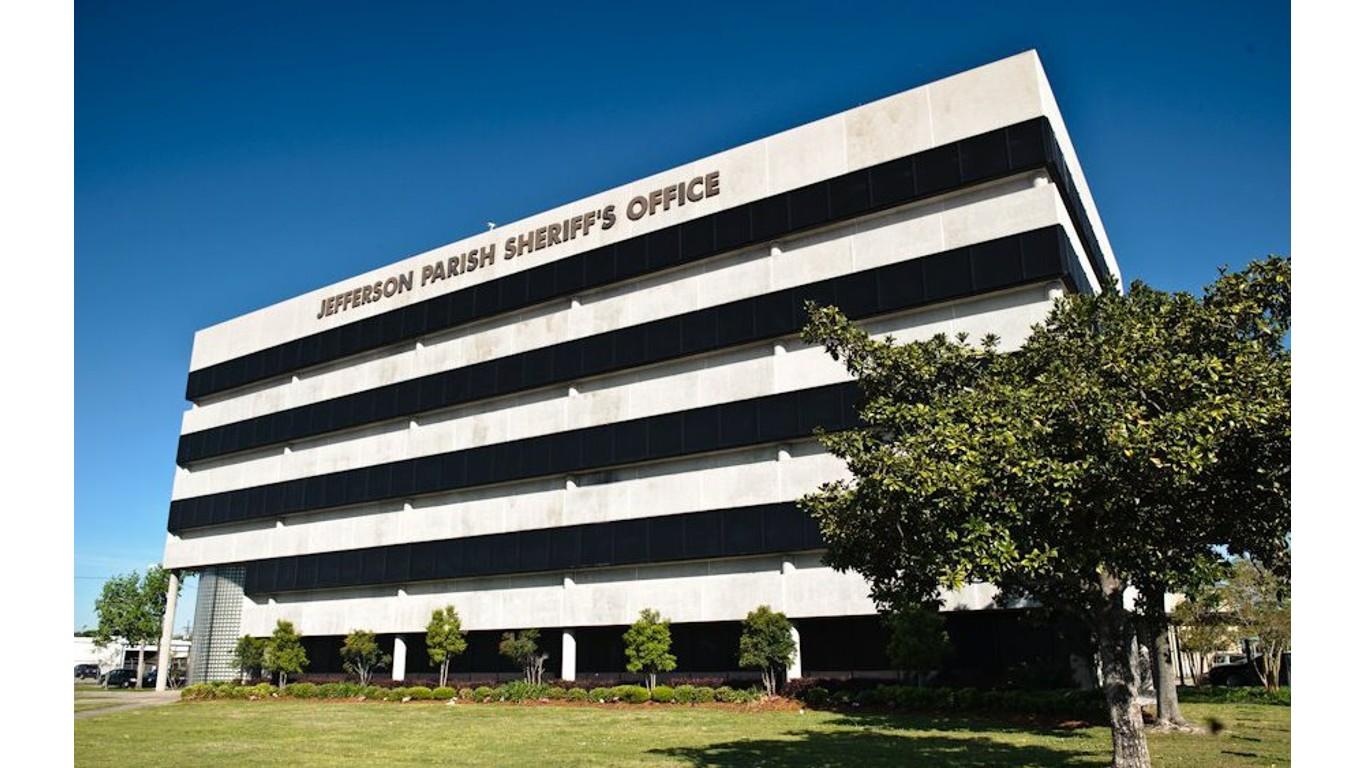
- Documented police killings (2013-2022): 18 — #85 most (8.2% of state killings)
- Police killings in 2022: 2
- % of those killed who were Black: 62.5% (total: 10)
- % of those killed who did not have a gun: 50.0% (total: 9)
- % of those killed who were fleeing: 53.8% (total: 7)
- % of cases officer was disciplined or charged with a crime: 7.7% (total: 1)
Maine: Maine State Police

- Documented police killings (2013-2022): 7 — #271 most (14.9% of state killings)
- Police killings in 2022: 1
- % of those killed who were Black: 0.0% (total: 0)
- % of those killed who did not have a gun: 16.7% (total: 1)
- % of those killed who were fleeing: 0.0% (total: 0)
- % of cases officer was disciplined or charged with a crime: 0.0% (total: 0)
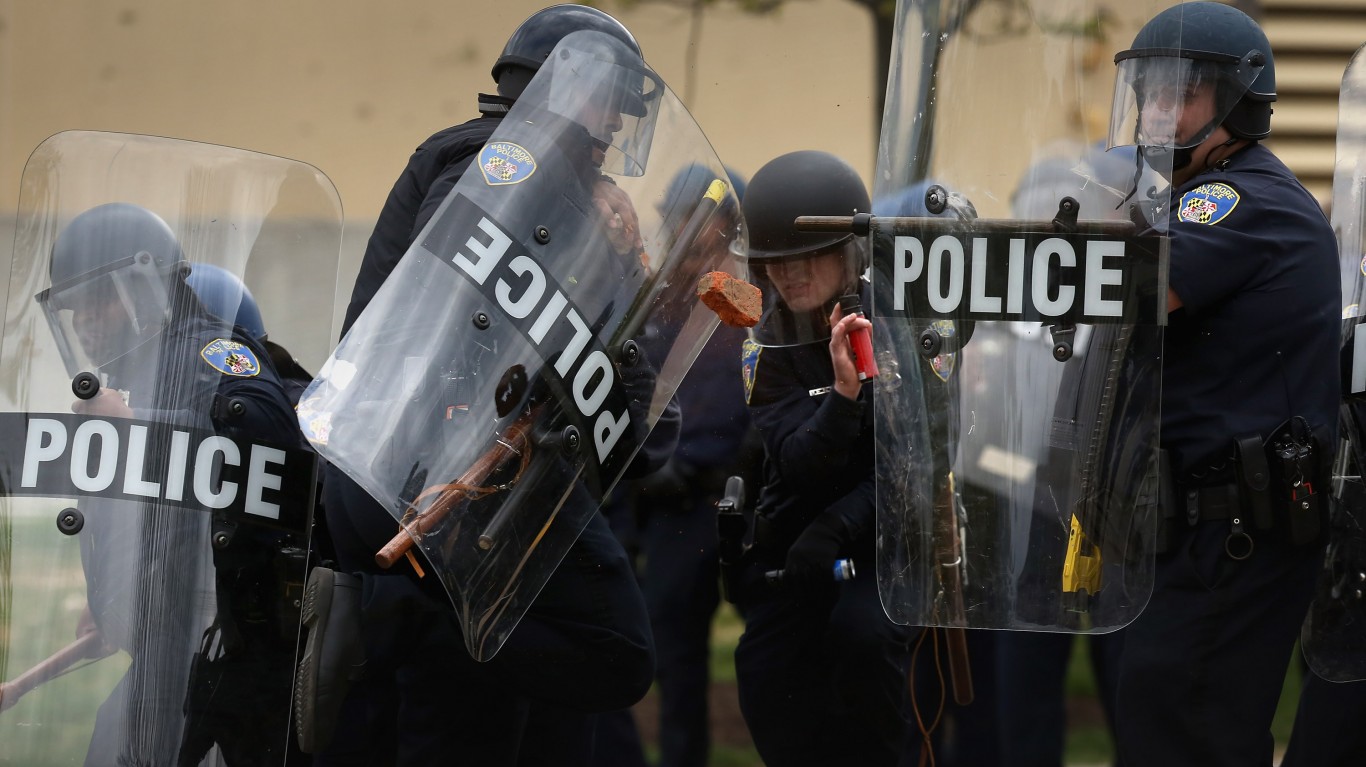
Maryland: Baltimore Police Department

- Documented police killings (2013-2022): 40 — #29 most (22.5% of state killings)
- Police killings in 2022: 3
- % of those killed who were Black: 89.7% (total: 35)
- % of those killed who did not have a gun: 40.0% (total: 16)
- % of those killed who were fleeing: 21.7% (total: 5)
- % of cases officer was disciplined or charged with a crime: 3.7% (total: 1)
Massachusetts: Boston Police Department
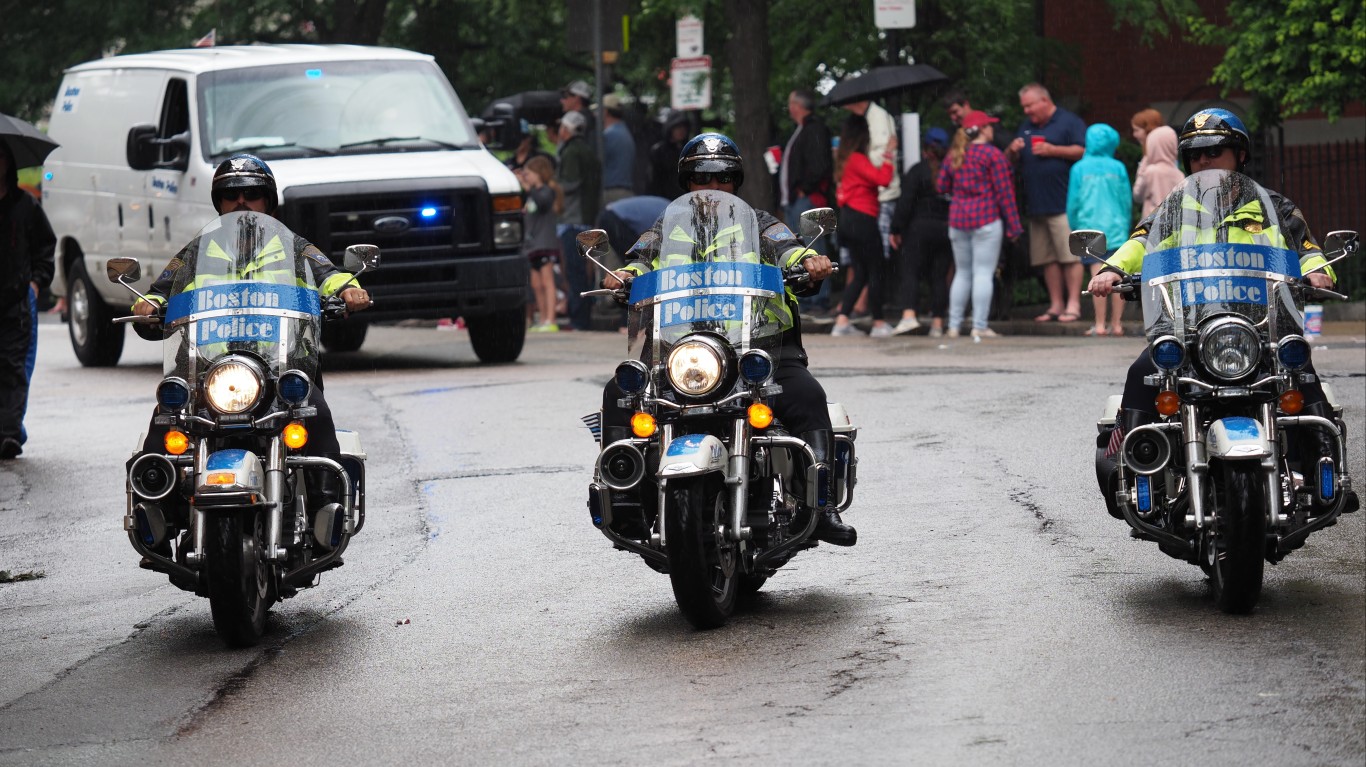
- Documented police killings (2013-2022): 16 — #100 most (20.5% of state killings)
- Police killings in 2022: 1
- % of those killed who were Black: 75.0% (total: 12)
- % of those killed who did not have a gun: 37.5% (total: 6)
- % of those killed who were fleeing: 31.3% (total: 5)
- % of cases officer was disciplined or charged with a crime: 0.0% (total: 0)
Michigan: Detroit Police Department
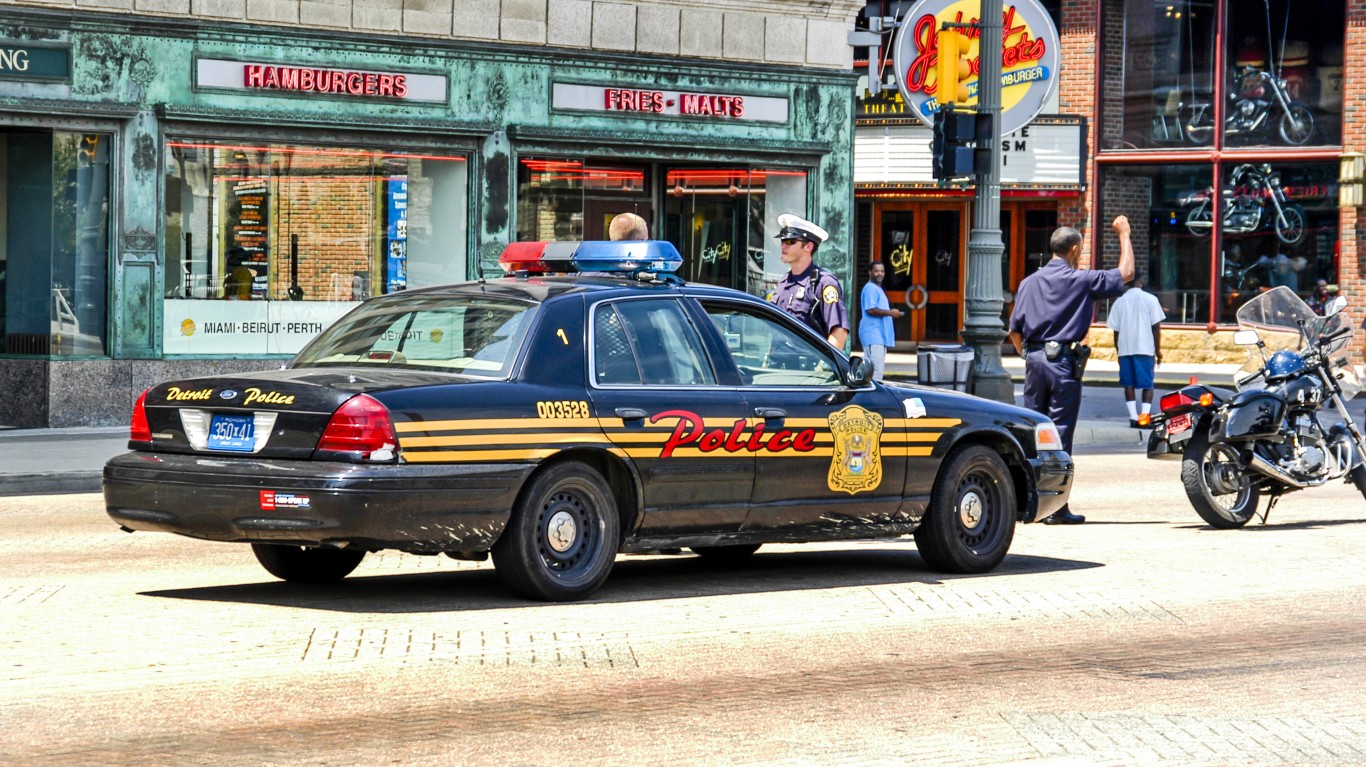
- Documented police killings (2013-2022): 30 — #41 most (15.9% of state killings)
- Police killings in 2022: 5
- % of those killed who were Black: 90.5% (total: 19)
- % of those killed who did not have a gun: 34.5% (total: 10)
- % of those killed who were fleeing: 18.8% (total: 3)
- % of cases officer was disciplined or charged with a crime: 10.0% (total: 1)
Minnesota: Minneapolis Police Department

- Documented police killings (2013-2022): 13 — #139 most (11.1% of state killings)
- Police killings in 2022: 2
- % of those killed who were Black: 76.9% (total: 10)
- % of those killed who did not have a gun: 50.0% (total: 6)
- % of those killed who were fleeing: 8.3% (total: 1)
- % of cases officer was disciplined or charged with a crime: 25.0% (total: 3)
Mississippi: Gulfport Police Department
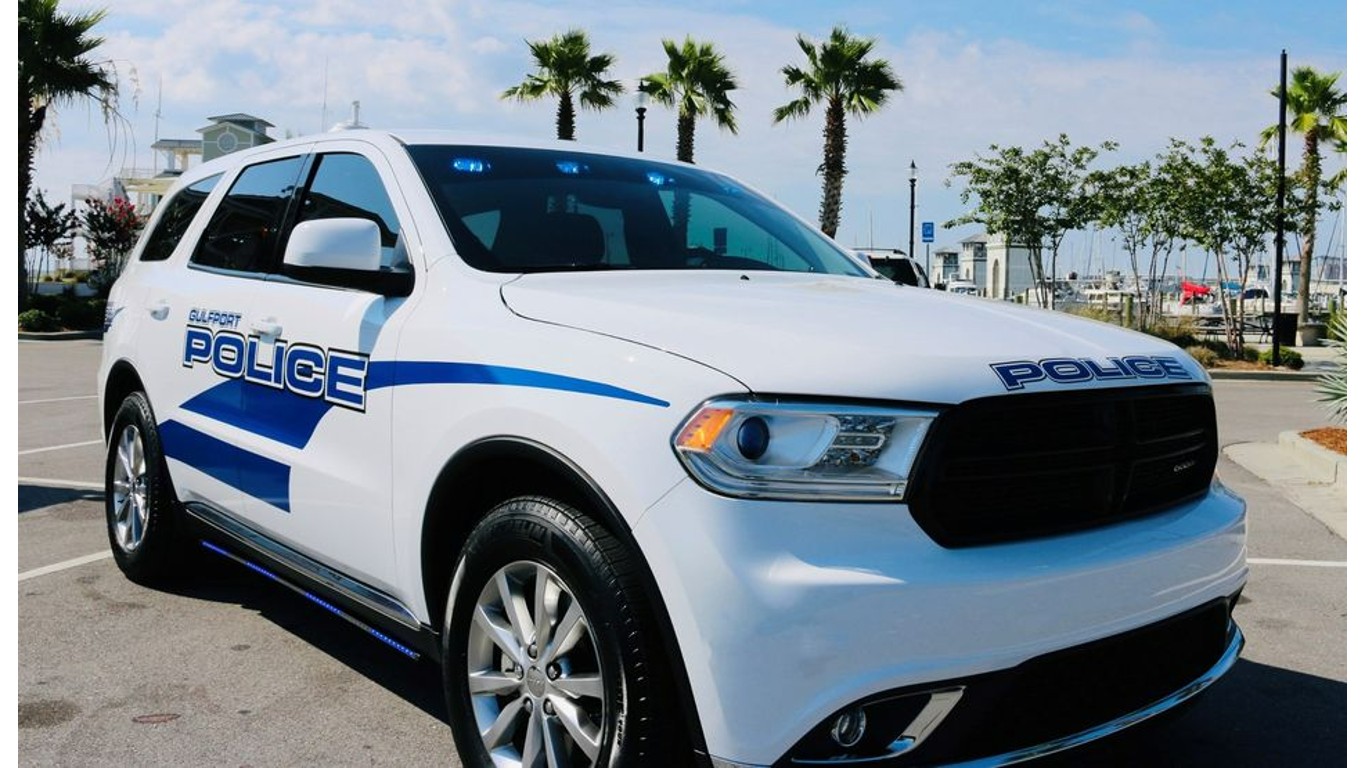
- Documented police killings (2013-2022): 9 — #214 most (5.7% of state killings)
- Police killings in 2022: 1
- % of those killed who were Black: 71.4% (total: 5)
- % of those killed who did not have a gun: 37.5% (total: 3)
- % of those killed who were fleeing: 0.0% (total: 0)
- % of cases officer was disciplined or charged with a crime: 0.0% (total: 0)
Missouri: St. Louis Metropolitan Police Department

- Documented police killings (2013-2022): 46 — #19 most (15.6% of state killings)
- Police killings in 2022: 4
- % of those killed who were Black: 90.5% (total: 38)
- % of those killed who did not have a gun: 25.0% (total: 11)
- % of those killed who were fleeing: 43.3% (total: 13)
- % of cases officer was disciplined or charged with a crime: 3.3% (total: 1)
Montana: Billings Police Department
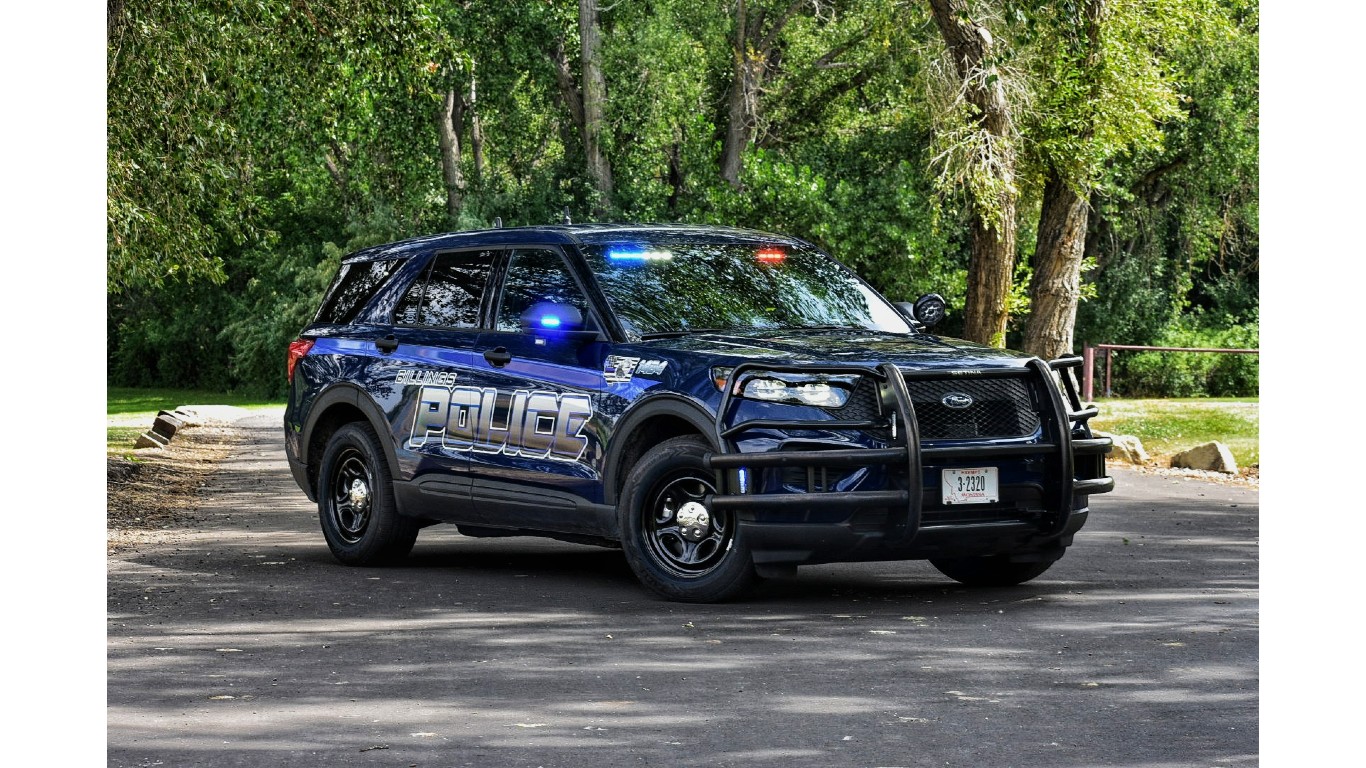
- Documented police killings (2013-2022): 14 — #127 most (21.5% of state killings)
- Police killings in 2022: 2
- % of those killed who were Black: 0.0% (total: 0)
- % of those killed who did not have a gun: 50.0% (total: 7)
- % of those killed who were fleeing: 36.4% (total: 4)
- % of cases officer was disciplined or charged with a crime: 0.0% (total: 0)
Nebraska: Omaha Police Department

- Documented police killings (2013-2022): 20 — #75 most (35.7% of state killings)
- Police killings in 2022: 2
- % of those killed who were Black: 36.8% (total: 7)
- % of those killed who did not have a gun: 57.9% (total: 11)
- % of those killed who were fleeing: 14.3% (total: 2)
- % of cases officer was disciplined or charged with a crime: 8.3% (total: 1)
Nevada: Las Vegas Metropolitan Police Department
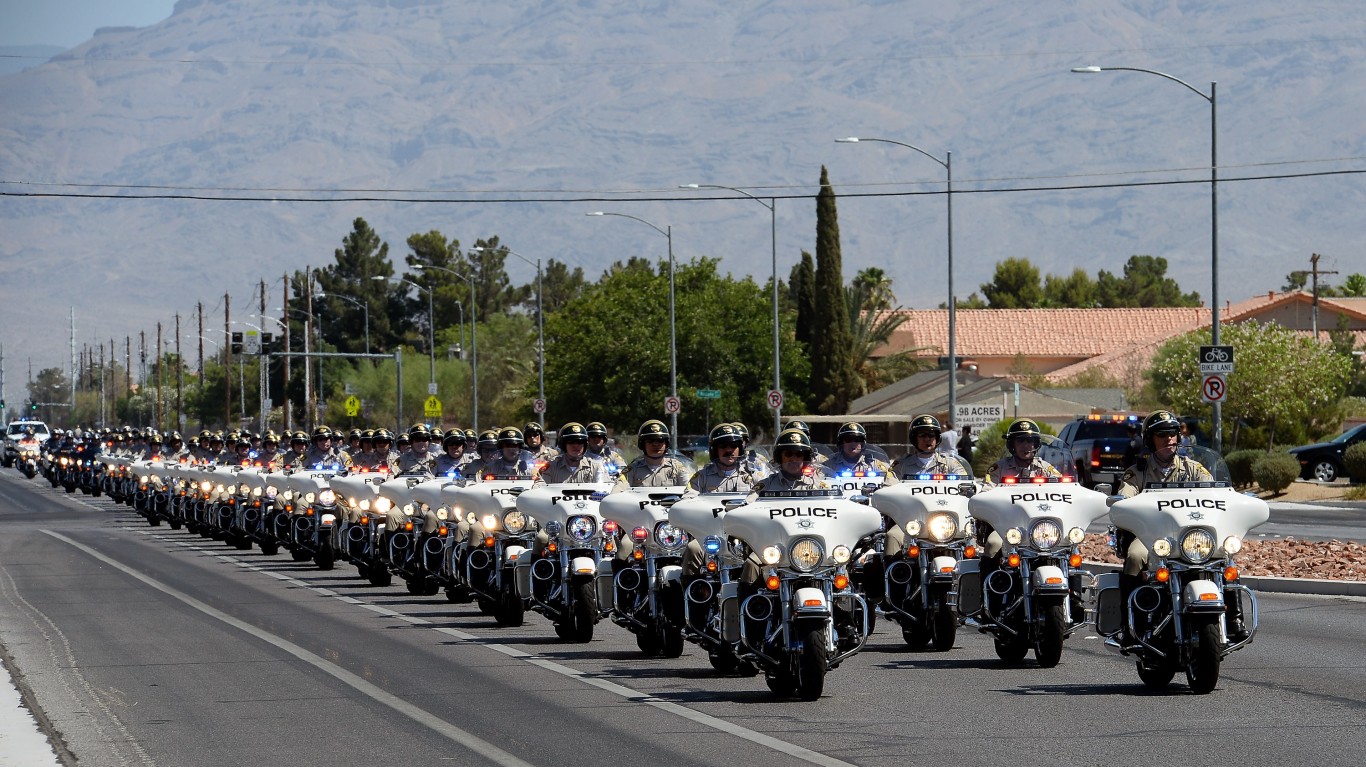
- Documented police killings (2013-2022): 87 — #8 most (48.6% of state killings)
- Police killings in 2022: 8
- % of those killed who were Black: 22.1% (total: 17)
- % of those killed who did not have a gun: 38.8% (total: 33)
- % of those killed who were fleeing: 27.4% (total: 17)
- % of cases officer was disciplined or charged with a crime: 4.3% (total: 2)
New Hampshire: New Hampshire State Police

- Documented police killings (2013-2022): 6 — #316 most (22.2% of state killings)
- Police killings in 2022: 1
- % of those killed who were Black: 0.0% (total: 0)
- % of those killed who did not have a gun: 50.0% (total: 2)
- % of those killed who were fleeing: 0.0% (total: 0)
- % of cases officer was disciplined or charged with a crime: 0.0% (total: 0)
New Jersey: Newark Police Department

- Documented police killings (2013-2022): 12 — #152 most (8.6% of state killings)
- Police killings in 2022: 0
- % of those killed who were Black: 63.6% (total: 7)
- % of those killed who did not have a gun: 50.0% (total: 6)
- % of those killed who were fleeing: 25.0% (total: 2)
- % of cases officer was disciplined or charged with a crime: 36.4% (total: 4)
New Mexico: Albuquerque Police Department
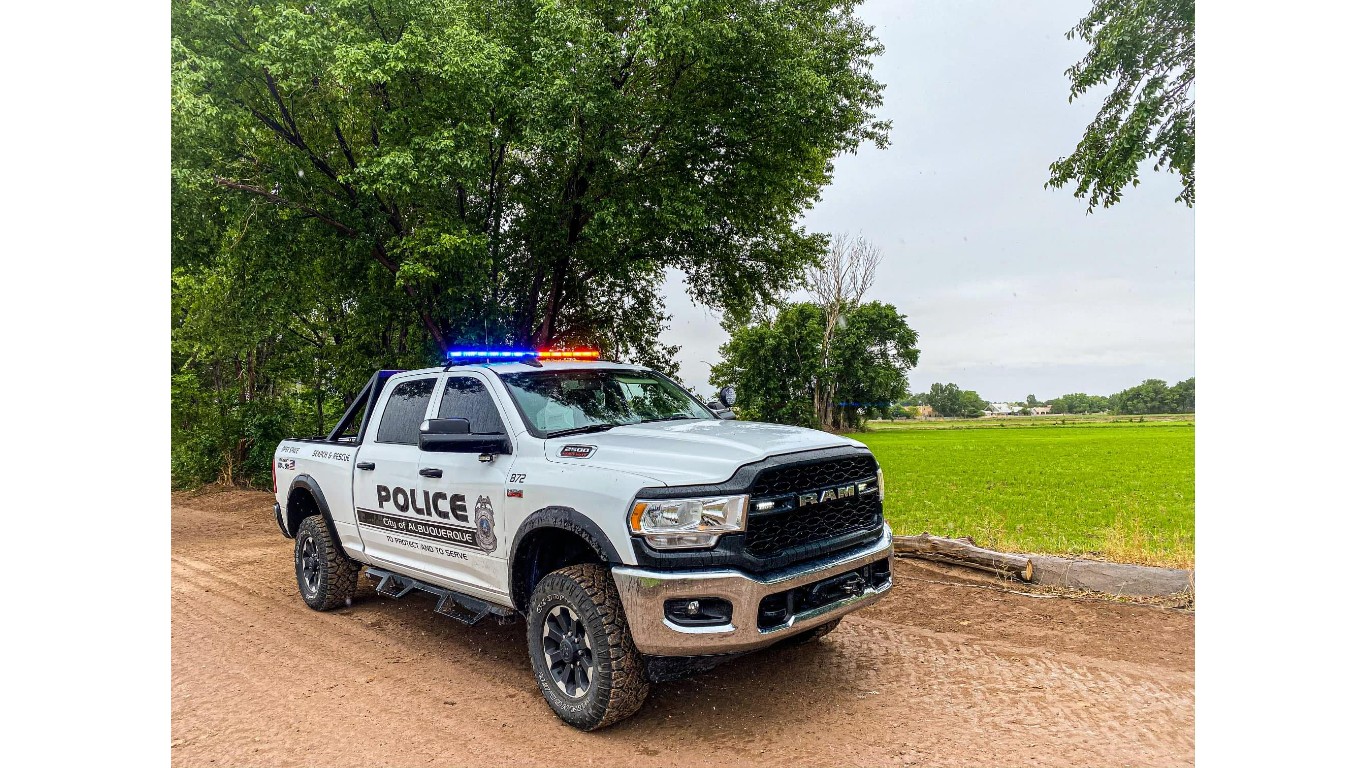
- Documented police killings (2013-2022): 51 — #18 most (22.9% of state killings)
- Police killings in 2022: 11
- % of those killed who were Black: 13.3% (total: 6)
- % of those killed who did not have a gun: 32.7% (total: 16)
- % of those killed who were fleeing: 35.1% (total: 13)
- % of cases officer was disciplined or charged with a crime: 4.5% (total: 1)
New York: New York Police Department

- Documented police killings (2013-2022): 102 — #4 most (43.4% of state killings)
- Police killings in 2022: 13
- % of those killed who were Black: 66.3% (total: 59)
- % of those killed who did not have a gun: 57.0% (total: 57)
- % of those killed who were fleeing: 34.9% (total: 22)
- % of cases officer was disciplined or charged with a crime: 8.1% (total: 5)
North Carolina: Charlotte-Mecklenburg Police Department

- Documented police killings (2013-2022): 28 — #48 most (9.0% of state killings)
- Police killings in 2022: 4
- % of those killed who were Black: 62.5% (total: 15)
- % of those killed who did not have a gun: 42.9% (total: 12)
- % of those killed who were fleeing: 13.6% (total: 3)
- % of cases officer was disciplined or charged with a crime: 9.5% (total: 2)
North Dakota: Bismarck Police Department

- Documented police killings (2013-2022): 4 — #467 most (19.0% of state killings)
- Police killings in 2022: 0
- % of those killed who were Black: 0.0% (total: 0)
- % of those killed who did not have a gun: 50.0% (total: 2)
- % of those killed who were fleeing: 33.3% (total: 1)
- % of cases officer was disciplined or charged with a crime: 0.0% (total: 0)
Ohio: Columbus Division of Police

- Documented police killings (2013-2022): 46 — #19 most (14.8% of state killings)
- Police killings in 2022: 0
- % of those killed who were Black: 73.3% (total: 33)
- % of those killed who did not have a gun: 39.0% (total: 16)
- % of those killed who were fleeing: 24.1% (total: 7)
- % of cases officer was disciplined or charged with a crime: 11.4% (total: 4)
Oklahoma: Oklahoma City Police Department
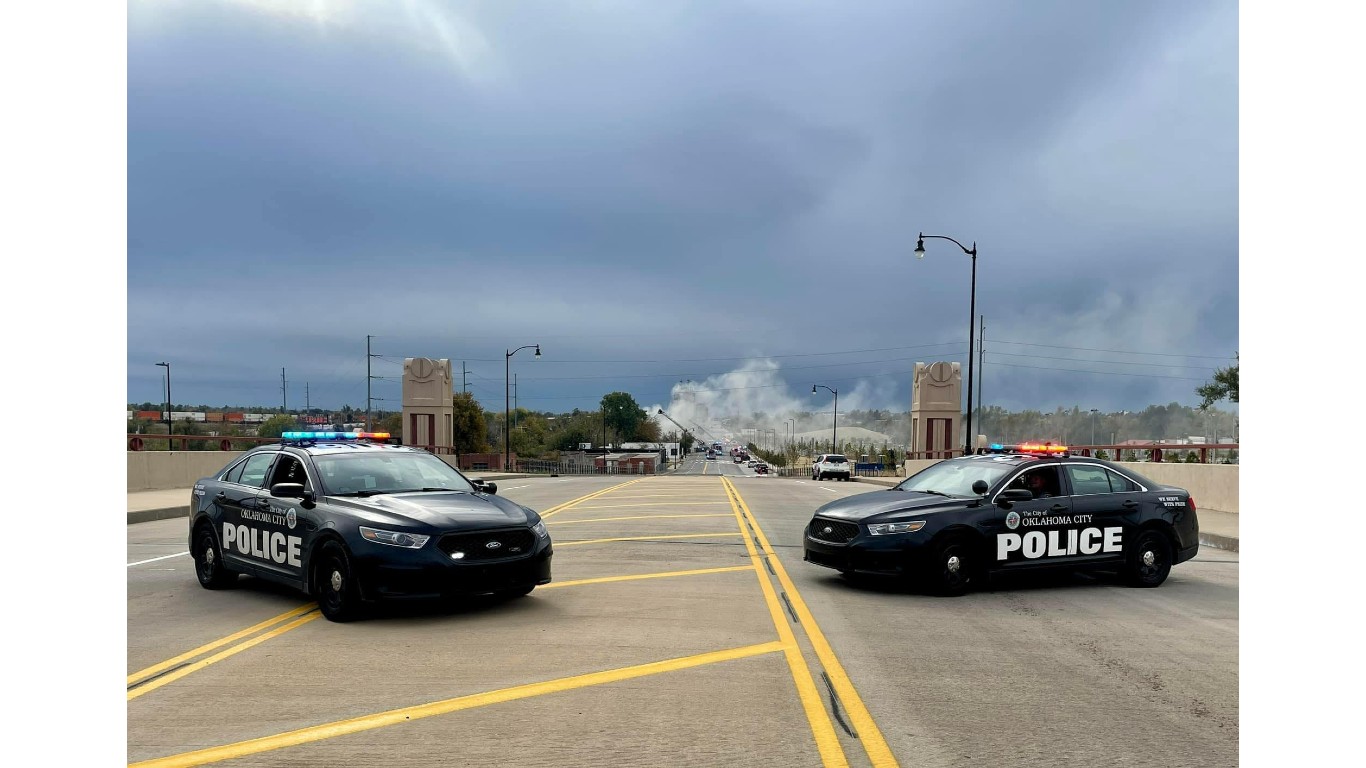
- Documented police killings (2013-2022): 58 — #12 most (19.6% of state killings)
- Police killings in 2022: 2
- % of those killed who were Black: 50.0% (total: 29)
- % of those killed who did not have a gun: 44.4% (total: 24)
- % of those killed who were fleeing: 25.0% (total: 8)
- % of cases officer was disciplined or charged with a crime: 5.1% (total: 2)
Oregon: Portland Police Bureau
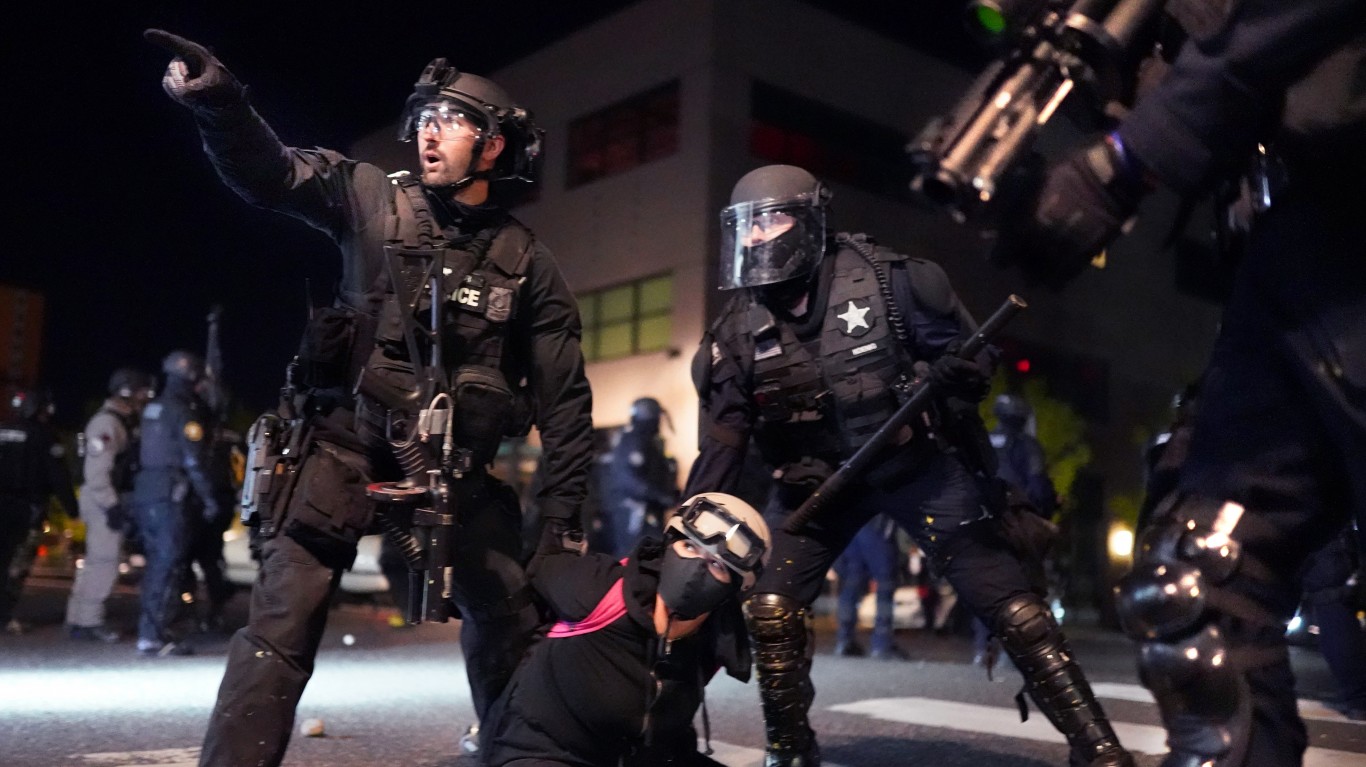
- Documented police killings (2013-2022): 23 — #63 most (13.7% of state killings)
- Police killings in 2022: 2
- % of those killed who were Black: 18.2% (total: 4)
- % of those killed who did not have a gun: 69.6% (total: 16)
- % of those killed who were fleeing: 26.7% (total: 4)
- % of cases officer was disciplined or charged with a crime: 0.0% (total: 0)
Pennsylvania: Pennsylvania State Police

- Documented police killings (2013-2022): 52 — #17 most (21.2% of state killings)
- Police killings in 2022: 8
- % of those killed who were Black: 7.1% (total: 3)
- % of those killed who did not have a gun: 44.0% (total: 22)
- % of those killed who were fleeing: 36.4% (total: 12)
- % of cases officer was disciplined or charged with a crime: 0.0% (total: 0)
Rhode Island: Providence Police Department

- Documented police killings (2013-2022): 3 — #611 most (33.3% of state killings)
- Police killings in 2022: 0
- % of those killed who were Black: 33.3% (total: 1)
- % of those killed who did not have a gun: 66.7% (total: 2)
- % of those killed who were fleeing: 50.0% (total: 1)
- % of cases officer was disciplined or charged with a crime: 0.0% (total: 0)
South Carolina: Greenville County Sheriff’s Office
- Documented police killings (2013-2022): 18 — #85 most (9.9% of state killings)
- Police killings in 2022: 1
- % of those killed who were Black: 53.3% (total: 8)
- % of those killed who did not have a gun: 16.7% (total: 3)
- % of those killed who were fleeing: 26.7% (total: 4)
- % of cases officer was disciplined or charged with a crime: 7.7% (total: 1)
South Dakota: Rapid City Police Department
- Documented police killings (2013-2022): 11 — #167 most (28.9% of state killings)
- Police killings in 2022: 3
- % of those killed who were Black: 0.0% (total: 0)
- % of those killed who did not have a gun: 36.4% (total: 4)
- % of those killed who were fleeing: 11.1% (total: 1)
- % of cases officer was disciplined or charged with a crime: 0.0% (total: 0)
Tennessee: Memphis Police Department

- Documented police killings (2013-2022): 29 — #44 most (10.4% of state killings)
- Police killings in 2022: 5
- % of those killed who were Black: 75.0% (total: 18)
- % of those killed who did not have a gun: 57.7% (total: 15)
- % of those killed who were fleeing: 35.7% (total: 5)
- % of cases officer was disciplined or charged with a crime: 14.3% (total: 2)
Texas: Houston Police Department
- Documented police killings (2013-2022): 97 — #5 most (9.3% of state killings)
- Police killings in 2022: 13
- % of those killed who were Black: 55.9% (total: 52)
- % of those killed who did not have a gun: 30.9% (total: 29)
- % of those killed who were fleeing: 32.3% (total: 20)
- % of cases officer was disciplined or charged with a crime: 3.6% (total: 2)
Utah: Salt Lake City Police Department
- Documented police killings (2013-2022): 18 — #85 most (14.3% of state killings)
- Police killings in 2022: 3
- % of those killed who were Black: 16.7% (total: 3)
- % of those killed who did not have a gun: 66.7% (total: 12)
- % of those killed who were fleeing: 31.3% (total: 5)
- % of cases officer was disciplined or charged with a crime: 0.0% (total: 0)
Vermont: Burlington Police Department

- Documented police killings (2013-2022): 8 — #242 most (47.1% of state killings)
- Police killings in 2022: 1
- % of those killed who were Black: 12.5% (total: 1)
- % of those killed who did not have a gun: 75.0% (total: 6)
- % of those killed who were fleeing: 33.3% (total: 2)
- % of cases officer was disciplined or charged with a crime: 0.0% (total: 0)
Virginia: Virginia State Police
- Documented police killings (2013-2022): 15 — #111 most (7.9% of state killings)
- Police killings in 2022: 1
- % of those killed who were Black: 54.5% (total: 6)
- % of those killed who did not have a gun: 20.0% (total: 3)
- % of those killed who were fleeing: 37.5% (total: 3)
- % of cases officer was disciplined or charged with a crime: 0.0% (total: 0)
Washington: Seattle Police Department
- Documented police killings (2013-2022): 29 — #44 most (9.4% of state killings)
- Police killings in 2022: 1
- % of those killed who were Black: 26.9% (total: 7)
- % of those killed who did not have a gun: 50.0% (total: 14)
- % of those killed who were fleeing: 56.3% (total: 9)
- % of cases officer was disciplined or charged with a crime: 0.0% (total: 0)
West Virginia: West Virginia State Police
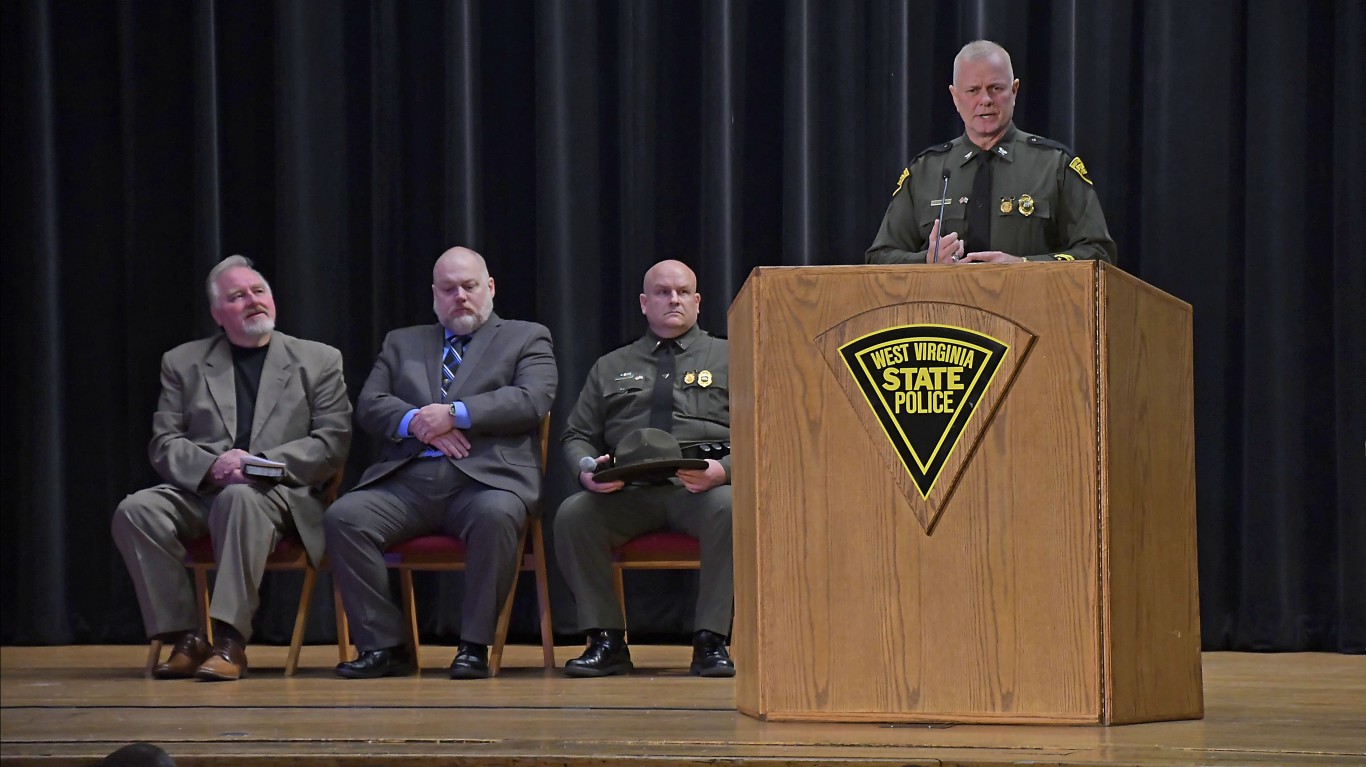
- Documented police killings (2013-2022): 17 — #93 most (17.3% of state killings)
- Police killings in 2022: 1
- % of those killed who were Black: 5.9% (total: 1)
- % of those killed who did not have a gun: 52.9% (total: 9)
- % of those killed who were fleeing: 43.8% (total: 7)
- % of cases officer was disciplined or charged with a crime: 0.0% (total: 0)
Wisconsin: Milwaukee Police Department

- Documented police killings (2013-2022): 26 — #58 most (16.7% of state killings)
- Police killings in 2022: 5
- % of those killed who were Black: 75.0% (total: 18)
- % of those killed who did not have a gun: 46.2% (total: 12)
- % of those killed who were fleeing: 38.9% (total: 7)
- % of cases officer was disciplined or charged with a crime: 18.2% (total: 2)
Wyoming: Casper Police Department
- Documented police killings (2013-2022): 9 — #214 most (25.0% of state killings)
- Police killings in 2022: 2
- % of those killed who were Black: 14.3% (total: 1)
- % of those killed who did not have a gun: 50.0% (total: 4)
- % of those killed who were fleeing: 57.1% (total: 4)
- % of cases officer was disciplined or charged with a crime: 0.0% (total: 0)
Methodology
To determine the police department in every state with the most killings, 24/7 Wall St. reviewed data from Mapping Police Violence, a research collaborative that collects data on police killings across the nation from the country’s three largest comprehensive and impartial crowdsourced databases. Data was accessed on Feb. 22, 2023, and includes all police department killings from 2013 through the end of 2022.
The percentages of incidents in which the person killed was Black, did not have a gun, was fleeing, and in which the officer was disciplined or faced criminal charges, the figures were calculated as a percentage of incidents for which information was available in the report rather than all incidents.