Special Report
How Florida's Job Market Compared to the US Over the Last 47 Years

Published:
Last Updated:

In an era of economic uncertainty, the U.S. job market remains resilient. After falling to 3.7% in November 2023, the national unemployment rate has been below 4% for 22 consecutive months, the longest streak in over 50 years.
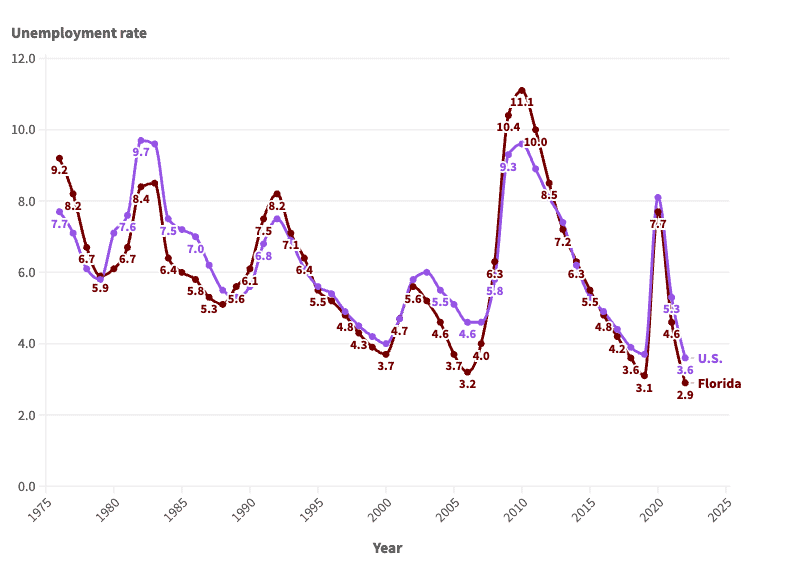
Of course, if history is any guide, much of the economy is subject to boom and bust cycles — and the job market is no exception. Since the mid-1970s, the average annual unemployment rate in the U.S. has fluctuated between 3.6% and nearly 10%, according to the Bureau of Labor Statistics.
These same cyclical patterns are also evident in Florida, where the job market is supported largely by the professional and scientific and retail trade industries. The annual unemployment rate in the state was 2.9% in 2022, a multi-decade low. However, conditions for job seekers have not always been so favorable.
According to historical BLS data going back to 1976, the annual jobless rate has been as high as 11.1% in Florida. More than once, unemployment in the state has either matched or come close to that peak.
This is how Florida’s job market has changed in each of the last 47 years.


| Year | Florida unemployment rate | U.S. unemployment rate | Unemployed population in Florida |
|---|---|---|---|
| 1976 | 9.2 | 7.7 | 335,779 |
| 1977 | 8.2 | 7.1 | 308,189 |
| 1978 | 6.7 | 6.1 | 267,886 |
| 1979 | 5.9 | 5.8 | 247,869 |
| 1980 | 6.1 | 7.1 | 257,340 |
| 1981 | 6.7 | 7.6 | 309,542 |
| 1982 | 8.4 | 9.7 | 399,472 |
| 1983 | 8.5 | 9.6 | 421,757 |
| 1984 | 6.4 | 7.5 | 339,293 |
| 1985 | 6.0 | 7.2 | 324,410 |
| 1986 | 5.8 | 7.0 | 325,357 |
| 1987 | 5.3 | 6.2 | 317,174 |
| 1988 | 5.1 | 5.5 | 315,577 |
| 1989 | 5.6 | 5.3 | 350,990 |
| 1990 | 6.1 | 5.6 | 404,346 |
| 1991 | 7.5 | 6.8 | 496,817 |
| 1992 | 8.2 | 7.5 | 555,073 |
| 1993 | 7.1 | 6.9 | 499,262 |
| 1994 | 6.4 | 6.1 | 450,146 |
| 1995 | 5.5 | 5.6 | 395,332 |
| 1996 | 5.2 | 5.4 | 378,251 |
| 1997 | 4.8 | 4.9 | 363,557 |
| 1998 | 4.3 | 4.5 | 335,466 |
| 1999 | 3.9 | 4.2 | 303,451 |
| 2000 | 3.7 | 4.0 | 297,174 |
| 2001 | 4.7 | 4.7 | 356,758 |
| 2002 | 5.6 | 5.8 | 398,128 |
| 2003 | 5.2 | 6.0 | 362,231 |
| 2004 | 4.6 | 5.5 | 313,725 |
| 2005 | 3.7 | 5.1 | 246,933 |
| 2006 | 3.2 | 4.6 | 219,940 |
| 2007 | 4.0 | 4.6 | 300,155 |
| 2008 | 6.3 | 5.8 | 520,246 |
| 2009 | 10.4 | 9.3 | 860,538 |
| 2010 | 11.1 | 9.6 | 991,706 |
| 2011 | 10.0 | 8.9 | 926,229 |
| 2012 | 8.5 | 8.1 | 806,664 |
| 2013 | 7.2 | 7.4 | 708,604 |
| 2014 | 6.3 | 6.2 | 614,967 |
| 2015 | 5.5 | 5.3 | 532,965 |
| 2016 | 4.8 | 4.9 | 481,064 |
| 2017 | 4.2 | 4.4 | 428,098 |
| 2018 | 3.6 | 3.9 | 368,708 |
| 2019 | 3.1 | 3.7 | 334,148 |
| 2020 | 7.7 | 8.1 | 821,101 |
| 2021 | 4.6 | 5.3 | 480,794 |
| 2022 | 2.9 | 3.6 | 313,266 |
The last few years made people forget how much banks and CD’s can pay. Meanwhile, interest rates have spiked and many can afford to pay you much more, but most are keeping yields low and hoping you won’t notice.
But there is good news. To win qualified customers, some accounts are paying almost 10x the national average! That’s an incredible way to keep your money safe and earn more at the same time. Our top pick for high yield savings accounts includes other benefits as well. You can earn up to 3.80% with a Checking & Savings Account today Sign up and get up to $300 with direct deposit. No account fees. FDIC Insured.
Click here to see how much more you could be earning on your savings today. It takes just a few minutes to open an account to make your money work for you.
Thank you for reading! Have some feedback for us?
Contact the 24/7 Wall St. editorial team.