Special Report
How Ohio's Job Market Compared to the US Over the Last 47 Years

Published:
Of course, if history is any guide, much of the economy is subject to boom and bust cycles — and the job market is no exception. Since the mid-1970s, the average annual unemployment rate in the U.S. has fluctuated between 3.6% and nearly 10%, according to the Bureau of Labor Statistics.
These same cyclical patterns are also evident in Ohio, where the job market is supported largely by the manufacturing and retail trade industries. The annual unemployment rate in the state was 4.0% in 2022, a multi-decade low. However, conditions for job seekers have not always been so favorable.
According to historical BLS data going back to 1976, the annual jobless rate has been as high as 12.7% in Ohio. More than once, unemployment in the state has either matched or come close to that peak.
This is how Ohio’s job market has changed in each of the last 47 years.


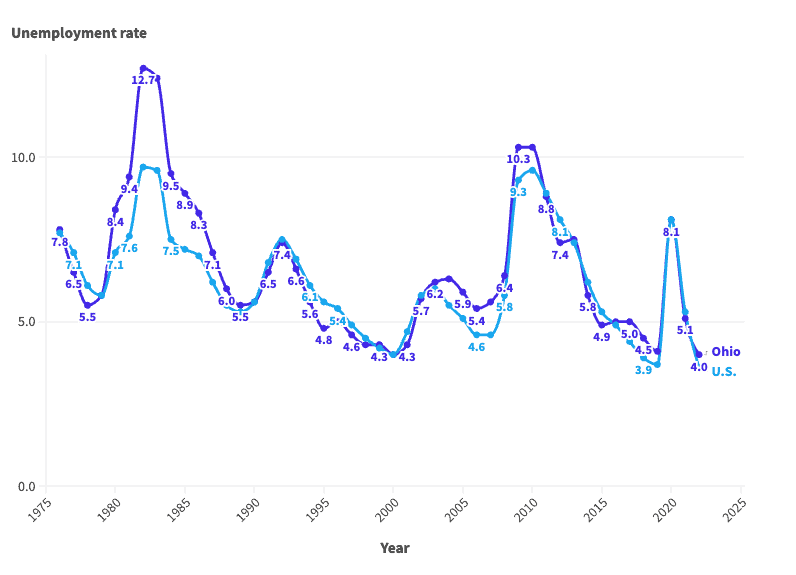
| Year | Ohio unemployment rate | U.S. unemployment rate | Unemployed population in Ohio |
|---|---|---|---|
| 1976 | 7.8 | 7.7 | 369,119 |
| 1977 | 6.5 | 7.1 | 312,688 |
| 1978 | 5.5 | 6.1 | 273,327 |
| 1979 | 5.8 | 5.8 | 297,430 |
| 1980 | 8.4 | 7.1 | 421,192 |
| 1981 | 9.4 | 7.6 | 490,849 |
| 1982 | 12.7 | 9.7 | 643,816 |
| 1983 | 12.4 | 9.6 | 631,030 |
| 1984 | 9.5 | 7.5 | 483,162 |
| 1985 | 8.9 | 7.2 | 459,413 |
| 1986 | 8.3 | 7.0 | 433,271 |
| 1987 | 7.1 | 6.2 | 373,425 |
| 1988 | 6.0 | 5.5 | 320,814 |
| 1989 | 5.5 | 5.3 | 301,821 |
| 1990 | 5.6 | 5.6 | 312,096 |
| 1991 | 6.5 | 6.8 | 352,932 |
| 1992 | 7.4 | 7.5 | 407,362 |
| 1993 | 6.6 | 6.9 | 367,204 |
| 1994 | 5.6 | 6.1 | 315,490 |
| 1995 | 4.8 | 5.6 | 273,075 |
| 1996 | 5.0 | 5.4 | 283,204 |
| 1997 | 4.6 | 4.9 | 265,367 |
| 1998 | 4.3 | 4.5 | 248,493 |
| 1999 | 4.3 | 4.2 | 248,882 |
| 2000 | 4.0 | 4.0 | 237,102 |
| 2001 | 4.3 | 4.7 | 254,737 |
| 2002 | 5.7 | 5.8 | 337,401 |
| 2003 | 6.2 | 6.0 | 364,037 |
| 2004 | 6.3 | 5.5 | 366,496 |
| 2005 | 5.9 | 5.1 | 349,262 |
| 2006 | 5.4 | 4.6 | 321,252 |
| 2007 | 5.6 | 4.6 | 337,945 |
| 2008 | 6.4 | 5.8 | 393,367 |
| 2009 | 10.3 | 9.3 | 600,044 |
| 2010 | 10.3 | 9.6 | 604,169 |
| 2011 | 8.8 | 8.9 | 509,752 |
| 2012 | 7.4 | 8.1 | 422,083 |
| 2013 | 7.5 | 7.4 | 425,318 |
| 2014 | 5.8 | 6.2 | 331,389 |
| 2015 | 4.9 | 5.3 | 282,926 |
| 2016 | 5.0 | 4.9 | 290,383 |
| 2017 | 5.0 | 4.4 | 289,496 |
| 2018 | 4.5 | 3.9 | 261,865 |
| 2019 | 4.1 | 3.7 | 244,879 |
| 2020 | 8.1 | 8.1 | 473,768 |
| 2021 | 5.1 | 5.3 | 293,954 |
| 2022 | 4.0 | 3.6 | 230,950 |
Credit card companies are pulling out all the stops, with the issuers are offering insane travel rewards and perks.
We’re talking huge sign-up bonuses, points on every purchase, and benefits like lounge access, travel credits, and free hotel nights. For travelers, these rewards can add up to thousands of dollars in flights, upgrades, and luxury experiences every year.
It’s like getting paid to travel — and it’s available to qualified borrowers who know where to look.
We’ve rounded up some of the best travel credit cards on the market. Click here to see the list. Don’t miss these offers — they won’t be this good forever.
Thank you for reading! Have some feedback for us?
Contact the 24/7 Wall St. editorial team.


Our expert who first called NVIDIA in 2009 is predicting 2025 will see a historic AI breakthrough.
You can follow him investing $500,000 of his own money on our top AI stocks for free.