Special Report

For Almost 50 Years Illinois' Unemployment Rate Has Been Worse Than the US Average

JaySi / iStock via Getty Images

In an era of economic uncertainty, the U.S. job market remains resilient. After falling to 3.7% in November 2023, the national unemployment rate has been below 4% for 22 consecutive months, the longest streak in over 50 years.

Of course, if history is any guide, much of the economy is subject to boom and bust cycles — and the job market is no exception. Since the mid-1970s, the average annual unemployment rate in the U.S. has fluctuated between 3.6% and nearly 10%, according to the Bureau of Labor Statistics.

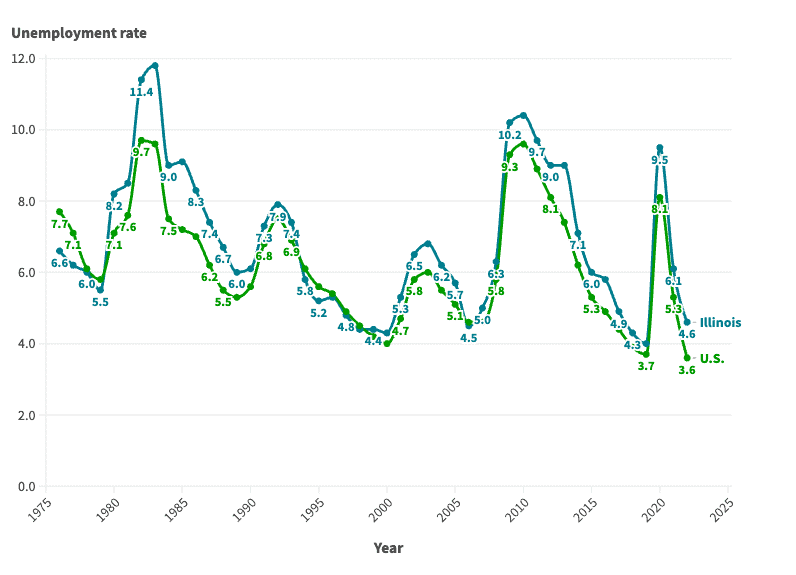
These same cyclical patterns are also evident in Illinois, where the job market is supported largely by the professional and scientific and manufacturing industries. The annual unemployment rate in the state was 4.6% in 2022, only slightly higher than the state’s lowest recorded annual jobless rate of 4%. However, conditions for job seekers have not always been so favorable.

According to historical BLS data going back to 1976, the annual jobless rate has been as high as 11.8% in Illinois. More than once, unemployment in the state has either matched or come close to that peak.

This is how Illinois’s job market has changed in each of the last 47 years.

1976: 6.6% unemployment

ghornephoto / iStock via Getty Images
  • Avg. unemployment rate: 6.6% (7.7% nationwide)
  • Labor force participation rate: 62.9% (61.6% nationwide)
  • Unemployed population in Illinois: 336,593

1977: 6.2% unemployment

franckreporter / E+ via Getty Images
  • Avg. unemployment rate: 6.2% (7.1% nationwide)
  • Labor force participation rate: 63.8% (62.3% nationwide)
  • Unemployed population in Illinois: 326,911

1978: 6.0% unemployment

Scott Olson / Getty Images News via Getty Images
  • Avg. unemployment rate: 6.0% (6.1% nationwide)
  • Labor force participation rate: 64.8% (63.2% nationwide)
  • Unemployed population in Illinois: 325,540

1979: 5.5% unemployment

lhongfoto / iStock Unreleased via Getty Images
  • Avg. unemployment rate: 5.5% (5.8% nationwide)
  • Labor force participation rate: 64.9% (63.7% nationwide)
  • Unemployed population in Illinois: 303,261

1980: 8.2% unemployment

dszc / E+ via Getty Images
  • Avg. unemployment rate: 8.2% (7.1% nationwide)
  • Labor force participation rate: 65.4% (63.8% nationwide)
  • Unemployed population in Illinois: 453,616

1981: 8.5% unemployment

benkrut / iStock via Getty Images
  • Avg. unemployment rate: 8.5% (7.6% nationwide)
  • Labor force participation rate: 65.6% (63.9% nationwide)
  • Unemployed population in Illinois: 482,384

1982: 11.4% unemployment

nopow / iStock via Getty Images
  • Avg. unemployment rate: 11.4% (9.7% nationwide)
  • Labor force participation rate: 65.6% (64.0% nationwide)
  • Unemployed population in Illinois: 640,399

1983: 11.8% unemployment

  • Avg. unemployment rate: 11.8% (9.6% nationwide)
  • Labor force participation rate: 65.3% (64.0% nationwide)
  • Unemployed population in Illinois: 654,851

1984: 9.0% unemployment

ghornephoto / iStock via Getty Images
  • Avg. unemployment rate: 9.0% (7.5% nationwide)
  • Labor force participation rate: 65.1% (64.4% nationwide)
  • Unemployed population in Illinois: 511,851

1985: 9.1% unemployment

franckreporter / E+ via Getty Images
  • Avg. unemployment rate: 9.1% (7.2% nationwide)
  • Labor force participation rate: 65.5% (64.8% nationwide)
  • Unemployed population in Illinois: 513,416

1986: 8.3% unemployment

Scott Olson / Getty Images News via Getty Images
  • Avg. unemployment rate: 8.3% (7.0% nationwide)
  • Labor force participation rate: 65.6% (65.3% nationwide)
  • Unemployed population in Illinois: 472,919

1987: 7.4% unemployment

lhongfoto / iStock Unreleased via Getty Images
  • Avg. unemployment rate: 7.4% (6.2% nationwide)
  • Labor force participation rate: 65.9% (65.6% nationwide)
  • Unemployed population in Illinois: 430,220

1988: 6.7% unemployment

dszc / E+ via Getty Images
  • Avg. unemployment rate: 6.7% (5.5% nationwide)
  • Labor force participation rate: 66.4% (65.9% nationwide)
  • Unemployed population in Illinois: 393,846

1989: 6.0% unemployment

benkrut / iStock via Getty Images
  • Avg. unemployment rate: 6.0% (5.3% nationwide)
  • Labor force participation rate: 67.9% (66.5% nationwide)
  • Unemployed population in Illinois: 363,132

1990: 6.1% unemployment

nopow / iStock via Getty Images
  • Avg. unemployment rate: 6.1% (5.6% nationwide)
  • Labor force participation rate: 68.2% (66.5% nationwide)
  • Unemployed population in Illinois: 371,930

1991: 7.3% unemployment

  • Avg. unemployment rate: 7.3% (6.8% nationwide)
  • Labor force participation rate: 67.6% (66.2% nationwide)
  • Unemployed population in Illinois: 432,444

1992: 7.9% unemployment

ghornephoto / iStock via Getty Images
  • Avg. unemployment rate: 7.9% (7.5% nationwide)
  • Labor force participation rate: 68.2% (66.4% nationwide)
  • Unemployed population in Illinois: 473,748

1993: 7.4% unemployment

franckreporter / E+ via Getty Images
  • Avg. unemployment rate: 7.4% (6.9% nationwide)
  • Labor force participation rate: 68.1% (66.3% nationwide)
  • Unemployed population in Illinois: 454,785

1994: 5.8% unemployment

Scott Olson / Getty Images News via Getty Images
  • Avg. unemployment rate: 5.8% (6.1% nationwide)
  • Labor force participation rate: 68.0% (66.6% nationwide)
  • Unemployed population in Illinois: 356,065

1995: 5.2% unemployment

lhongfoto / iStock Unreleased via Getty Images
  • Avg. unemployment rate: 5.2% (5.6% nationwide)
  • Labor force participation rate: 68.3% (66.6% nationwide)
  • Unemployed population in Illinois: 321,514

1996: 5.3% unemployment

dszc / E+ via Getty Images
  • Avg. unemployment rate: 5.3% (5.4% nationwide)
  • Labor force participation rate: 68.6% (66.8% nationwide)
  • Unemployed population in Illinois: 330,937

1997: 4.8% unemployment

benkrut / iStock via Getty Images
  • Avg. unemployment rate: 4.8% (4.9% nationwide)
  • Labor force participation rate: 68.7% (67.1% nationwide)
  • Unemployed population in Illinois: 301,777

1998: 4.4% unemployment

nopow / iStock via Getty Images
  • Avg. unemployment rate: 4.4% (4.5% nationwide)
  • Labor force participation rate: 68.7% (67.1% nationwide)
  • Unemployed population in Illinois: 283,850

1999: 4.4% unemployment

  • Avg. unemployment rate: 4.4% (4.2% nationwide)
  • Labor force participation rate: 69.5% (67.1% nationwide)
  • Unemployed population in Illinois: 284,597

2000: 4.3% unemployment

ghornephoto / iStock via Getty Images
  • Avg. unemployment rate: 4.3% (4.0% nationwide)
  • Labor force participation rate: 69.5% (67.1% nationwide)
  • Unemployed population in Illinois: 288,369

2001: 5.3% unemployment

franckreporter / E+ via Getty Images
  • Avg. unemployment rate: 5.3% (4.7% nationwide)
  • Labor force participation rate: 68.6% (66.8% nationwide)
  • Unemployed population in Illinois: 351,000

2002: 6.5% unemployment

Scott Olson / Getty Images News via Getty Images
  • Avg. unemployment rate: 6.5% (5.8% nationwide)
  • Labor force participation rate: 67.0% (66.6% nationwide)
  • Unemployed population in Illinois: 415,901

2003: 6.8% unemployment

lhongfoto / iStock Unreleased via Getty Images
  • Avg. unemployment rate: 6.8% (6.0% nationwide)
  • Labor force participation rate: 66.3% (66.2% nationwide)
  • Unemployed population in Illinois: 425,386

2004: 6.2% unemployment

dszc / E+ via Getty Images
  • Avg. unemployment rate: 6.2% (5.5% nationwide)
  • Labor force participation rate: 66.4% (66.0% nationwide)
  • Unemployed population in Illinois: 392,977

2005: 5.7% unemployment

benkrut / iStock via Getty Images
  • Avg. unemployment rate: 5.7% (5.1% nationwide)
  • Labor force participation rate: 66.7% (66.0% nationwide)
  • Unemployed population in Illinois: 366,082

2006: 4.5% unemployment

nopow / iStock via Getty Images
  • Avg. unemployment rate: 4.5% (4.6% nationwide)
  • Labor force participation rate: 67.3% (66.2% nationwide)
  • Unemployed population in Illinois: 297,770

2007: 5.0% unemployment

  • Avg. unemployment rate: 5.0% (4.6% nationwide)
  • Labor force participation rate: 68.1% (66.0% nationwide)
  • Unemployed population in Illinois: 337,789

2008: 6.3% unemployment

ghornephoto / iStock via Getty Images
  • Avg. unemployment rate: 6.3% (5.8% nationwide)
  • Labor force participation rate: 67.8% (66.0% nationwide)
  • Unemployed population in Illinois: 430,763

2009: 10.2% unemployment

franckreporter / E+ via Getty Images
  • Avg. unemployment rate: 10.2% (9.3% nationwide)
  • Labor force participation rate: 66.8% (65.4% nationwide)
  • Unemployed population in Illinois: 673,081

2010: 10.4% unemployment

Scott Olson / Getty Images News via Getty Images
  • Avg. unemployment rate: 10.4% (9.6% nationwide)
  • Labor force participation rate: 66.8% (64.7% nationwide)
  • Unemployed population in Illinois: 694,231

2011: 9.7% unemployment

lhongfoto / iStock Unreleased via Getty Images
  • Avg. unemployment rate: 9.7% (8.9% nationwide)
  • Labor force participation rate: 66.0% (64.1% nationwide)
  • Unemployed population in Illinois: 641,744

2012: 9.0% unemployment

dszc / E+ via Getty Images
  • Avg. unemployment rate: 9.0% (8.1% nationwide)
  • Labor force participation rate: 65.9% (63.7% nationwide)
  • Unemployed population in Illinois: 594,235

2013: 9.0% unemployment

benkrut / iStock via Getty Images
  • Avg. unemployment rate: 9.0% (7.4% nationwide)
  • Labor force participation rate: 65.4% (63.2% nationwide)
  • Unemployed population in Illinois: 595,392

2014: 7.1% unemployment

nopow / iStock via Getty Images
  • Avg. unemployment rate: 7.1% (6.2% nationwide)
  • Labor force participation rate: 64.8% (62.9% nationwide)
  • Unemployed population in Illinois: 467,313

2015: 6.0% unemployment

  • Avg. unemployment rate: 6.0% (5.3% nationwide)
  • Labor force participation rate: 64.8% (62.7% nationwide)
  • Unemployed population in Illinois: 391,863

2016: 5.8% unemployment

ghornephoto / iStock via Getty Images
  • Avg. unemployment rate: 5.8% (4.9% nationwide)
  • Labor force participation rate: 65.3% (62.8% nationwide)
  • Unemployed population in Illinois: 386,366

2017: 4.9% unemployment

franckreporter / E+ via Getty Images
  • Avg. unemployment rate: 4.9% (4.4% nationwide)
  • Labor force participation rate: 64.7% (62.9% nationwide)
  • Unemployed population in Illinois: 324,358

2018: 4.3% unemployment

Scott Olson / Getty Images News via Getty Images
  • Avg. unemployment rate: 4.3% (3.9% nationwide)
  • Labor force participation rate: 64.7% (62.9% nationwide)
  • Unemployed population in Illinois: 286,572

2019: 4.0% unemployment

lhongfoto / iStock Unreleased via Getty Images
  • Avg. unemployment rate: 4.0% (3.7% nationwide)
  • Labor force participation rate: 64.7% (63.1% nationwide)
  • Unemployed population in Illinois: 260,782

2020: 9.5% unemployment

dszc / E+ via Getty Images
  • Avg. unemployment rate: 9.5% (8.1% nationwide)
  • Labor force participation rate: 62.7% (61.7% nationwide)
  • Unemployed population in Illinois: 590,812

2021: 6.1% unemployment

benkrut / iStock via Getty Images
  • Avg. unemployment rate: 6.1% (5.3% nationwide)
  • Labor force participation rate: 63.1% (61.7% nationwide)
  • Unemployed population in Illinois: 385,984

2022: 4.6% unemployment

nopow / iStock via Getty Images
  • Avg. unemployment rate: 4.6% (3.6% nationwide)
  • Labor force participation rate: 64.5% (62.2% nationwide)
  • Unemployed population in Illinois: 295,787

24/7 Wall St.
Year Illinois unemployment rate U.S. unemployment rate Unemployed population in Illinois
1976 6.6 7.7 336,593
1977 6.2 7.1 326,911
1978 6.0 6.1 325,540
1979 5.5 5.8 303,261
1980 8.2 7.1 453,616
1981 8.5 7.6 482,384
1982 11.4 9.7 640,399
1983 11.8 9.6 654,851
1984 9.0 7.5 511,851
1985 9.1 7.2 513,416
1986 8.3 7.0 472,919
1987 7.4 6.2 430,220
1988 6.7 5.5 393,846
1989 6.0 5.3 363,132
1990 6.1 5.6 371,930
1991 7.3 6.8 432,444
1992 7.9 7.5 473,748
1993 7.4 6.9 454,785
1994 5.8 6.1 356,065
1995 5.2 5.6 321,514
1996 5.3 5.4 330,937
1997 4.8 4.9 301,777
1998 4.4 4.5 283,850
1999 4.4 4.2 284,597
2000 4.3 4.0 288,369
2001 5.3 4.7 351,000
2002 6.5 5.8 415,901
2003 6.8 6.0 425,386
2004 6.2 5.5 392,977
2005 5.7 5.1 366,082
2006 4.5 4.6 297,770
2007 5.0 4.6 337,789
2008 6.3 5.8 430,763
2009 10.2 9.3 673,081
2010 10.4 9.6 694,231
2011 9.7 8.9 641,744
2012 9.0 8.1 594,235
2013 9.0 7.4 595,392
2014 7.1 6.2 467,313
2015 6.0 5.3 391,863
2016 5.8 4.9 386,366
2017 4.9 4.4 324,358
2018 4.3 3.9 286,572
2019 4.0 3.7 260,782
2020 9.5 8.1 590,812
2021 6.1 5.3 385,984
2022 4.6 3.6 295,787

Want to Retire Early? Start Here (Sponsor)

Want retirement to come a few years earlier than you’d planned? Or are you ready to retire now, but want an extra set of eyes on your finances?

Now you can speak with up to 3 financial experts in your area for FREE. By simply clicking here you can begin to match with financial professionals who can help you build your plan to retire early. And the best part? The first conversation with them is free.

Click here to match with up to 3 financial pros who would be excited to help you make financial decisions.

Thank you for reading! Have some feedback for us?
Contact the 24/7 Wall St. editorial team.