Special Report
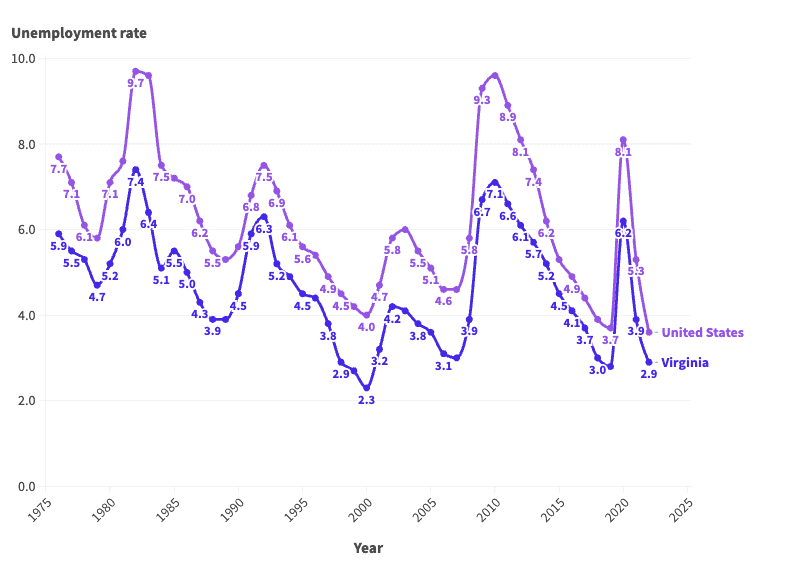
For Almost 50 years Virginia's Unemployment Rate Has Been Better Than the US Average

Published:

In an era of economic uncertainty, the U.S. job market remains resilient. After falling to 3.7% in November 2023, the national unemployment rate has been below 4% for 22 consecutive months, the longest streak in over 50 years.
Of course, if history is any guide, much of the economy is subject to boom and bust cycles — and the job market is no exception. Since the mid-1970s, the average annual unemployment rate in the U.S. has fluctuated between 3.6% and nearly 10%, according to the Bureau of Labor Statistics.
These same cyclical patterns are also evident in Virginia, where the job market is supported largely by the professional and scientific and retail trade industries. The annual unemployment rate in the state was 2.9% in 2022, only slightly higher than the state’s lowest on record annual jobless rate of 2.3%. However, conditions for job seekers have not always been so favorable.
According to historical BLS data going back to 1976, the annual jobless rate has been as high as 7.4% in Virginia. More than once, unemployment in the state has either matched or come close to that peak.
This is how Virginia’s job market has changed in each of the last 47 years.










| Year | Virginia unemployment rate | U.S. unemployment rate | Unemployed population in Virginia |
|---|---|---|---|
| 1976 | 5.9 | 7.7 | 138,261 |
| 1977 | 5.5 | 7.1 | 130,967 |
| 1978 | 5.3 | 6.1 | 131,093 |
| 1979 | 4.7 | 5.8 | 119,908 |
| 1980 | 5.2 | 7.1 | 130,561 |
| 1981 | 6.0 | 7.6 | 155,509 |
| 1982 | 7.4 | 9.7 | 198,076 |
| 1983 | 6.4 | 9.6 | 172,599 |
| 1984 | 5.1 | 7.5 | 142,557 |
| 1985 | 5.5 | 7.2 | 155,189 |
| 1986 | 5.0 | 7.0 | 144,482 |
| 1987 | 4.3 | 6.2 | 125,312 |
| 1988 | 3.9 | 5.5 | 120,274 |
| 1989 | 3.9 | 5.3 | 122,211 |
| 1990 | 4.5 | 5.6 | 142,633 |
| 1991 | 5.9 | 6.8 | 192,112 |
| 1992 | 6.3 | 7.5 | 208,791 |
| 1993 | 5.2 | 6.9 | 174,372 |
| 1994 | 4.9 | 6.1 | 164,850 |
| 1995 | 4.5 | 5.6 | 153,290 |
| 1996 | 4.4 | 5.4 | 149,190 |
| 1997 | 3.8 | 4.9 | 128,363 |
| 1998 | 2.9 | 4.5 | 97,456 |
| 1999 | 2.7 | 4.2 | 95,927 |
| 2000 | 2.3 | 4.0 | 81,909 |
| 2001 | 3.2 | 4.7 | 121,438 |
| 2002 | 4.2 | 5.8 | 162,969 |
| 2003 | 4.1 | 6.0 | 163,214 |
| 2004 | 3.8 | 5.5 | 156,108 |
| 2005 | 3.6 | 5.1 | 149,962 |
| 2006 | 3.1 | 4.6 | 132,218 |
| 2007 | 3.0 | 4.6 | 132,788 |
| 2008 | 3.9 | 5.8 | 175,866 |
| 2009 | 6.7 | 9.3 | 282,835 |
| 2010 | 7.1 | 9.6 | 304,827 |
| 2011 | 6.6 | 8.9 | 276,176 |
| 2012 | 6.1 | 8.1 | 250,378 |
| 2013 | 5.7 | 7.4 | 236,320 |
| 2014 | 5.2 | 6.2 | 217,948 |
| 2015 | 4.5 | 5.3 | 185,900 |
| 2016 | 4.1 | 4.9 | 169,526 |
| 2017 | 3.7 | 4.4 | 159,687 |
| 2018 | 3.0 | 3.9 | 130,779 |
| 2019 | 2.8 | 3.7 | 122,471 |
| 2020 | 6.2 | 8.1 | 280,533 |
| 2021 | 3.9 | 5.3 | 168,742 |
| 2022 | 2.9 | 3.6 | 127,053 |
The thought of burdening your family with a financial disaster is most Americans’ nightmare. However, recent studies show that over 100 million Americans still don’t have proper life insurance in the event they pass away.
Life insurance can bring peace of mind – ensuring your loved ones are safeguarded against unforeseen expenses and debts. With premiums often lower than expected and a variety of plans tailored to different life stages and health conditions, securing a policy is more accessible than ever.
A quick, no-obligation quote can provide valuable insight into what’s available and what might best suit your family’s needs. Life insurance is a simple step you can take today to help secure peace of mind for your loved ones tomorrow.
Click here to learn how to get a quote in just a few minutes.
Thank you for reading! Have some feedback for us?
Contact the 24/7 Wall St. editorial team.