In an era of economic uncertainty, the U.S. job market remains resilient. After falling to 3.7% in November 2023, the national unemployment rate has been below 4% for 22 consecutive months, the longest streak in over 50 years.
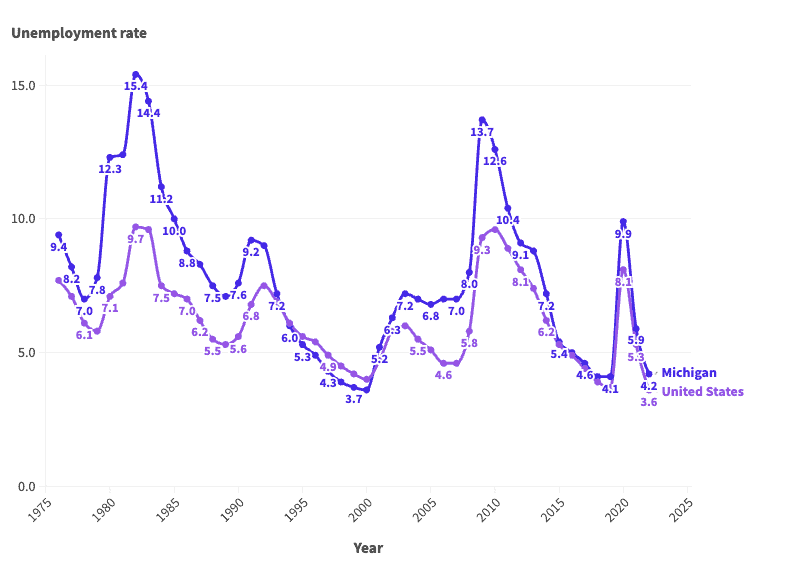
Of course, if history is any guide, much of the economy is subject to boom and bust cycles — and the job market is no exception. Since the mid-1970s, the average annual unemployment rate in the U.S. has fluctuated between 3.6% and nearly 10%, according to the Bureau of Labor Statistics.
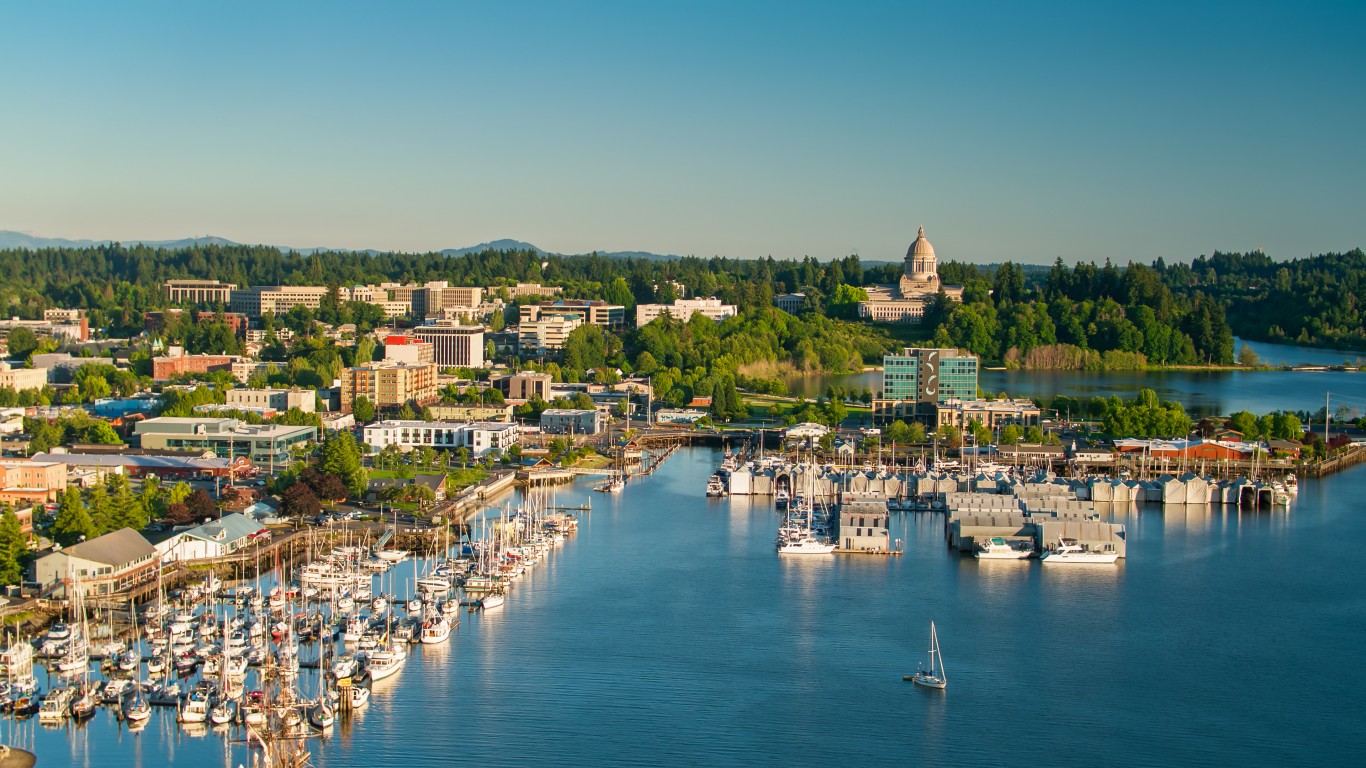
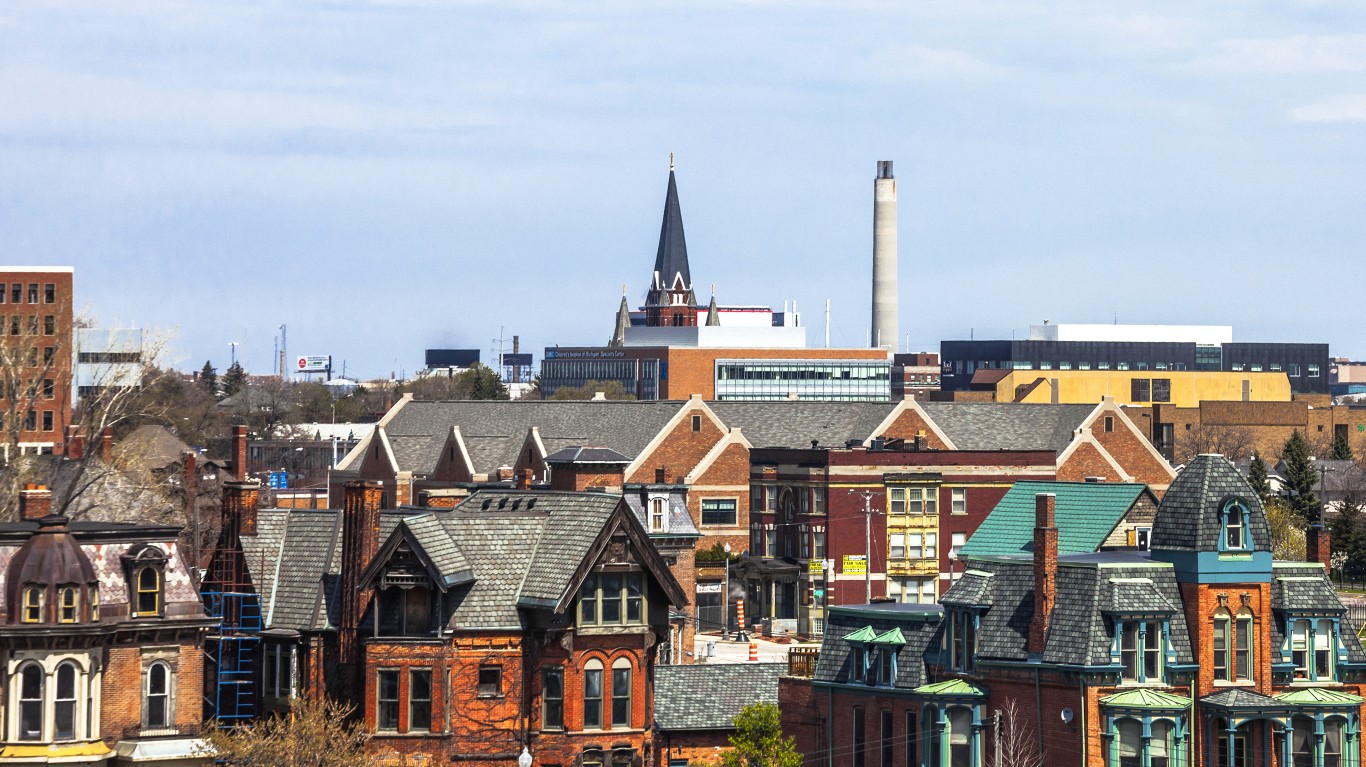
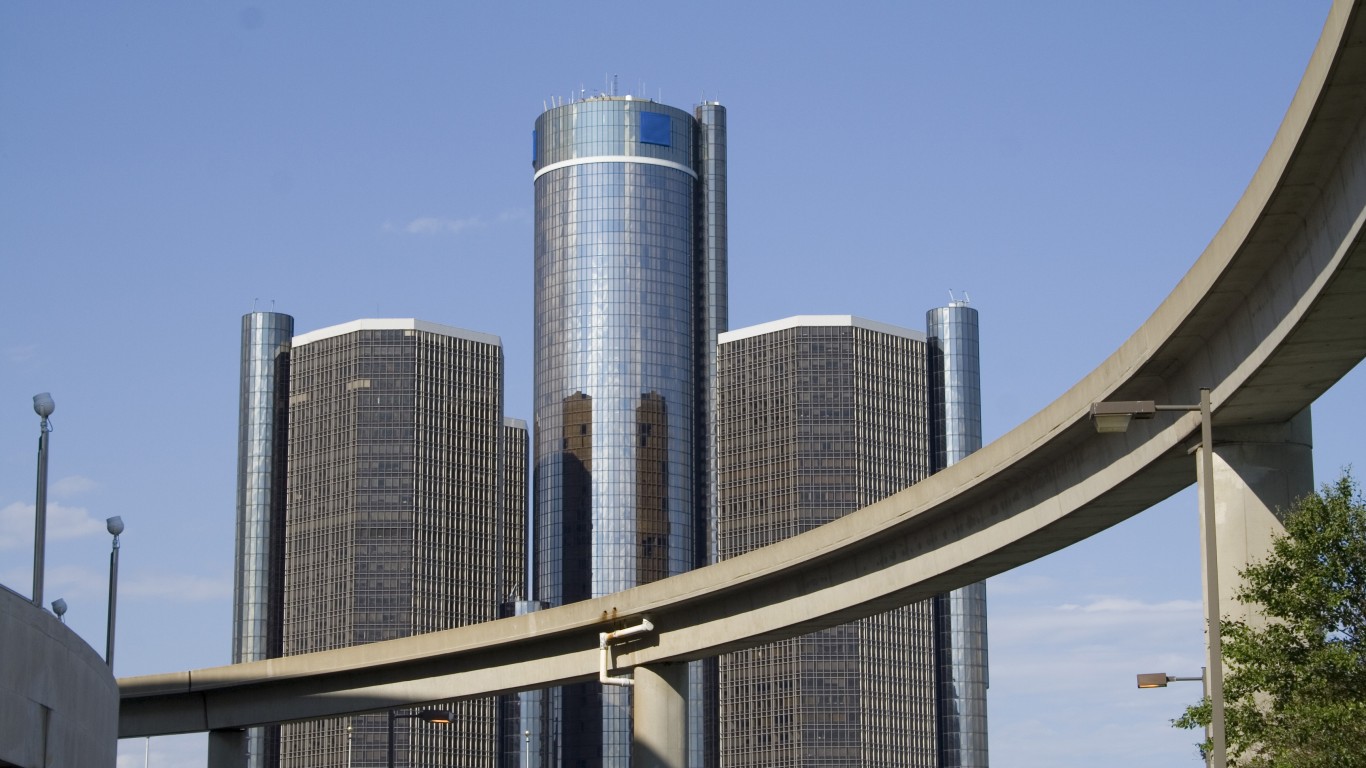
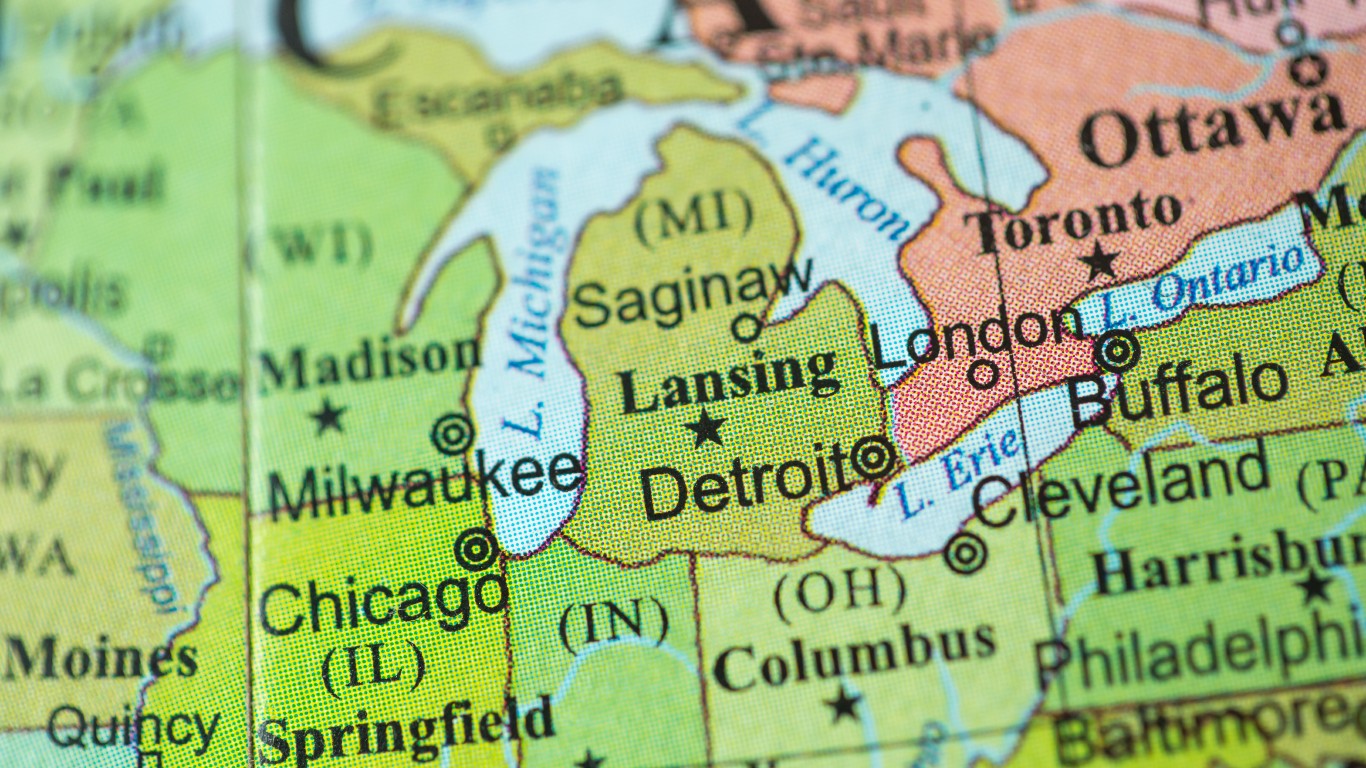
These same cyclical patterns are also evident in Michigan, where the job market is supported largely by the manufacturing and retail trade industries. The annual unemployment rate in the state was 4.2% in 2022, only slightly higher than the state’s lowest recorded annual jobless rate of 3.6%. However, conditions for job seekers have not always been so favorable.
According to historical BLS data going back to 1976, the annual jobless rate has been as high as 15.4% in Michigan. More than once, unemployment in the state has either matched or come close to that peak.
This is how Michigan’s job market has changed in each of the last 47 years.
1976: 9.4% unemployment
- Avg. unemployment rate: 9.4% (7.7% nationwide)
- Labor force participation rate: 61.7% (61.6% nationwide)
- Unemployed population in Michigan: 375,056
1977: 8.2% unemployment

- Avg. unemployment rate: 8.2% (7.1% nationwide)
- Labor force participation rate: 62.8% (62.3% nationwide)
- Unemployed population in Michigan: 337,939
1978: 7.0% unemployment

- Avg. unemployment rate: 7.0% (6.1% nationwide)
- Labor force participation rate: 63.6% (63.2% nationwide)
- Unemployed population in Michigan: 296,859
1979: 7.8% unemployment
- Avg. unemployment rate: 7.8% (5.8% nationwide)
- Labor force participation rate: 64.3% (63.7% nationwide)
- Unemployed population in Michigan: 339,231
1980: 12.3% unemployment
- Avg. unemployment rate: 12.3% (7.1% nationwide)
- Labor force participation rate: 64.0% (63.8% nationwide)
- Unemployed population in Michigan: 531,279
1981: 12.4% unemployment
- Avg. unemployment rate: 12.4% (7.6% nationwide)
- Labor force participation rate: 63.4% (63.9% nationwide)
- Unemployed population in Michigan: 532,261
1982: 15.4% unemployment
- Avg. unemployment rate: 15.4% (9.7% nationwide)
- Labor force participation rate: 63.3% (64.0% nationwide)
- Unemployed population in Michigan: 662,859
1983: 14.4% unemployment
- Avg. unemployment rate: 14.4% (9.6% nationwide)
- Labor force participation rate: 63.5% (64.0% nationwide)
- Unemployed population in Michigan: 617,154
1984: 11.2% unemployment
- Avg. unemployment rate: 11.2% (7.5% nationwide)
- Labor force participation rate: 63.9% (64.4% nationwide)
- Unemployed population in Michigan: 484,805
1985: 10.0% unemployment
- Avg. unemployment rate: 10.0% (7.2% nationwide)
- Labor force participation rate: 64.2% (64.8% nationwide)
- Unemployed population in Michigan: 436,559
1986: 8.8% unemployment
- Avg. unemployment rate: 8.8% (7.0% nationwide)
- Labor force participation rate: 64.2% (65.3% nationwide)
- Unemployed population in Michigan: 391,816
1987: 8.3% unemployment
- Avg. unemployment rate: 8.3% (6.2% nationwide)
- Labor force participation rate: 65.0% (65.6% nationwide)
- Unemployed population in Michigan: 377,221
1988: 7.5% unemployment
- Avg. unemployment rate: 7.5% (5.5% nationwide)
- Labor force participation rate: 65.3% (65.9% nationwide)
- Unemployed population in Michigan: 344,509
1989: 7.1% unemployment
- Avg. unemployment rate: 7.1% (5.3% nationwide)
- Labor force participation rate: 66.0% (66.5% nationwide)
- Unemployed population in Michigan: 330,618
1990: 7.6% unemployment
- Avg. unemployment rate: 7.6% (5.6% nationwide)
- Labor force participation rate: 65.8% (66.5% nationwide)
- Unemployed population in Michigan: 353,539
1991: 9.2% unemployment
- Avg. unemployment rate: 9.2% (6.8% nationwide)
- Labor force participation rate: 65.0% (66.2% nationwide)
- Unemployed population in Michigan: 426,685
1992: 9.0% unemployment
- Avg. unemployment rate: 9.0% (7.5% nationwide)
- Labor force participation rate: 65.5% (66.4% nationwide)
- Unemployed population in Michigan: 424,245
1993: 7.2% unemployment
- Avg. unemployment rate: 7.2% (6.9% nationwide)
- Labor force participation rate: 65.8% (66.3% nationwide)
- Unemployed population in Michigan: 347,057
1994: 6.0% unemployment
- Avg. unemployment rate: 6.0% (6.1% nationwide)
- Labor force participation rate: 66.5% (66.6% nationwide)
- Unemployed population in Michigan: 292,697
1995: 5.3% unemployment
- Avg. unemployment rate: 5.3% (5.6% nationwide)
- Labor force participation rate: 66.3% (66.6% nationwide)
- Unemployed population in Michigan: 257,276
1996: 4.9% unemployment
- Avg. unemployment rate: 4.9% (5.4% nationwide)
- Labor force participation rate: 66.5% (66.8% nationwide)
- Unemployed population in Michigan: 239,907
1997: 4.3% unemployment
- Avg. unemployment rate: 4.3% (4.9% nationwide)
- Labor force participation rate: 67.0% (67.1% nationwide)
- Unemployed population in Michigan: 212,570
1998: 3.9% unemployment
- Avg. unemployment rate: 3.9% (4.5% nationwide)
- Labor force participation rate: 67.5% (67.1% nationwide)
- Unemployed population in Michigan: 199,520
1999: 3.7% unemployment
- Avg. unemployment rate: 3.7% (4.2% nationwide)
- Labor force participation rate: 68.3% (67.1% nationwide)
- Unemployed population in Michigan: 191,761
2000: 3.6% unemployment
- Avg. unemployment rate: 3.6% (4.0% nationwide)
- Labor force participation rate: 68.6% (67.1% nationwide)
- Unemployed population in Michigan: 187,817
2001: 5.2% unemployment
- Avg. unemployment rate: 5.2% (4.7% nationwide)
- Labor force participation rate: 67.9% (66.8% nationwide)
- Unemployed population in Michigan: 266,726
2002: 6.3% unemployment
- Avg. unemployment rate: 6.3% (5.8% nationwide)
- Labor force participation rate: 66.1% (66.6% nationwide)
- Unemployed population in Michigan: 311,436
2003: 7.2% unemployment
- Avg. unemployment rate: 7.2% (6.0% nationwide)
- Labor force participation rate: 65.7% (66.2% nationwide)
- Unemployed population in Michigan: 357,218
2004: 7.0% unemployment
- Avg. unemployment rate: 7.0% (5.5% nationwide)
- Labor force participation rate: 65.6% (66.0% nationwide)
- Unemployed population in Michigan: 352,186
2005: 6.8% unemployment
- Avg. unemployment rate: 6.8% (5.1% nationwide)
- Labor force participation rate: 65.5% (66.0% nationwide)
- Unemployed population in Michigan: 343,901
2006: 7.0% unemployment
- Avg. unemployment rate: 7.0% (4.6% nationwide)
- Labor force participation rate: 65.1% (66.2% nationwide)
- Unemployed population in Michigan: 355,349
2007: 7.0% unemployment
- Avg. unemployment rate: 7.0% (4.6% nationwide)
- Labor force participation rate: 64.2% (66.0% nationwide)
- Unemployed population in Michigan: 354,668
2008: 8.0% unemployment
- Avg. unemployment rate: 8.0% (5.8% nationwide)
- Labor force participation rate: 63.2% (66.0% nationwide)
- Unemployed population in Michigan: 402,532
2009: 13.7% unemployment
- Avg. unemployment rate: 13.7% (9.3% nationwide)
- Labor force participation rate: 62.5% (65.4% nationwide)
- Unemployed population in Michigan: 638,574
2010: 12.6% unemployment
- Avg. unemployment rate: 12.6% (9.6% nationwide)
- Labor force participation rate: 61.4% (64.7% nationwide)
- Unemployed population in Michigan: 580,853
2011: 10.4% unemployment
- Avg. unemployment rate: 10.4% (8.9% nationwide)
- Labor force participation rate: 60.2% (64.1% nationwide)
- Unemployed population in Michigan: 467,194
2012: 9.1% unemployment
- Avg. unemployment rate: 9.1% (8.1% nationwide)
- Labor force participation rate: 60.1% (63.7% nationwide)
- Unemployed population in Michigan: 423,499
2013: 8.8% unemployment
- Avg. unemployment rate: 8.8% (7.4% nationwide)
- Labor force participation rate: 60.5% (63.2% nationwide)
- Unemployed population in Michigan: 413,509
2014: 7.2% unemployment
- Avg. unemployment rate: 7.2% (6.2% nationwide)
- Labor force participation rate: 60.6% (62.9% nationwide)
- Unemployed population in Michigan: 343,703
2015: 5.4% unemployment
- Avg. unemployment rate: 5.4% (5.3% nationwide)
- Labor force participation rate: 60.4% (62.7% nationwide)
- Unemployed population in Michigan: 258,391
2016: 5.0% unemployment
- Avg. unemployment rate: 5.0% (4.9% nationwide)
- Labor force participation rate: 61.2% (62.8% nationwide)
- Unemployed population in Michigan: 241,690
2017: 4.6% unemployment
- Avg. unemployment rate: 4.6% (4.4% nationwide)
- Labor force participation rate: 61.4% (62.9% nationwide)
- Unemployed population in Michigan: 225,394
2018: 4.1% unemployment
- Avg. unemployment rate: 4.1% (3.9% nationwide)
- Labor force participation rate: 61.6% (62.9% nationwide)
- Unemployed population in Michigan: 205,713
2019: 4.1% unemployment
- Avg. unemployment rate: 4.1% (3.7% nationwide)
- Labor force participation rate: 61.8% (63.1% nationwide)
- Unemployed population in Michigan: 202,560
2020: 9.9% unemployment
- Avg. unemployment rate: 9.9% (8.1% nationwide)
- Labor force participation rate: 60.3% (61.7% nationwide)
- Unemployed population in Michigan: 483,886
2021: 5.9% unemployment
- Avg. unemployment rate: 5.9% (5.3% nationwide)
- Labor force participation rate: 59.3% (61.7% nationwide)
- Unemployed population in Michigan: 277,993
2022: 4.2% unemployment
- Avg. unemployment rate: 4.2% (3.6% nationwide)
- Labor force participation rate: 59.9% (62.2% nationwide)
- Unemployed population in Michigan: 203,427
| Year | Michigan unemployment rate | U.S. unemployment rate | Unemployed population in Michigan |
|---|---|---|---|
| 1976 | 9.4 | 7.7 | 375,056 |
| 1977 | 8.2 | 7.1 | 337,939 |
| 1978 | 7.0 | 6.1 | 296,859 |
| 1979 | 7.8 | 5.8 | 339,231 |
| 1980 | 12.3 | 7.1 | 531,279 |
| 1981 | 12.4 | 7.6 | 532,261 |
| 1982 | 15.4 | 9.7 | 662,859 |
| 1983 | 14.4 | 9.6 | 617,154 |
| 1984 | 11.2 | 7.5 | 484,805 |
| 1985 | 10.0 | 7.2 | 436,559 |
| 1986 | 8.8 | 7.0 | 391,816 |
| 1987 | 8.3 | 6.2 | 377,221 |
| 1988 | 7.5 | 5.5 | 344,509 |
| 1989 | 7.1 | 5.3 | 330,618 |
| 1990 | 7.6 | 5.6 | 353,539 |
| 1991 | 9.2 | 6.8 | 426,685 |
| 1992 | 9.0 | 7.5 | 424,245 |
| 1993 | 7.2 | 6.9 | 347,057 |
| 1994 | 6.0 | 6.1 | 292,697 |
| 1995 | 5.3 | 5.6 | 257,276 |
| 1996 | 4.9 | 5.4 | 239,907 |
| 1997 | 4.3 | 4.9 | 212,570 |
| 1998 | 3.9 | 4.5 | 199,520 |
| 1999 | 3.7 | 4.2 | 191,761 |
| 2000 | 3.6 | 4.0 | 187,817 |
| 2001 | 5.2 | 4.7 | 266,726 |
| 2002 | 6.3 | 5.8 | 311,436 |
| 2003 | 7.2 | 6.0 | 357,218 |
| 2004 | 7.0 | 5.5 | 352,186 |
| 2005 | 6.8 | 5.1 | 343,901 |
| 2006 | 7.0 | 4.6 | 355,349 |
| 2007 | 7.0 | 4.6 | 354,668 |
| 2008 | 8.0 | 5.8 | 402,532 |
| 2009 | 13.7 | 9.3 | 638,574 |
| 2010 | 12.6 | 9.6 | 580,853 |
| 2011 | 10.4 | 8.9 | 467,194 |
| 2012 | 9.1 | 8.1 | 423,499 |
| 2013 | 8.8 | 7.4 | 413,509 |
| 2014 | 7.2 | 6.2 | 343,703 |
| 2015 | 5.4 | 5.3 | 258,391 |
| 2016 | 5.0 | 4.9 | 241,690 |
| 2017 | 4.6 | 4.4 | 225,394 |
| 2018 | 4.1 | 3.9 | 205,713 |
| 2019 | 4.1 | 3.7 | 202,560 |
| 2020 | 9.9 | 8.1 | 483,886 |
| 2021 | 5.9 | 5.3 | 277,993 |
| 2022 | 4.2 | 3.6 | 203,427 |