
In an era of economic uncertainty, the U.S. job market remains resilient. After falling to 3.7% in November 2023, the national unemployment rate has been below 4% for 22 consecutive months, the longest streak in over 50 years.
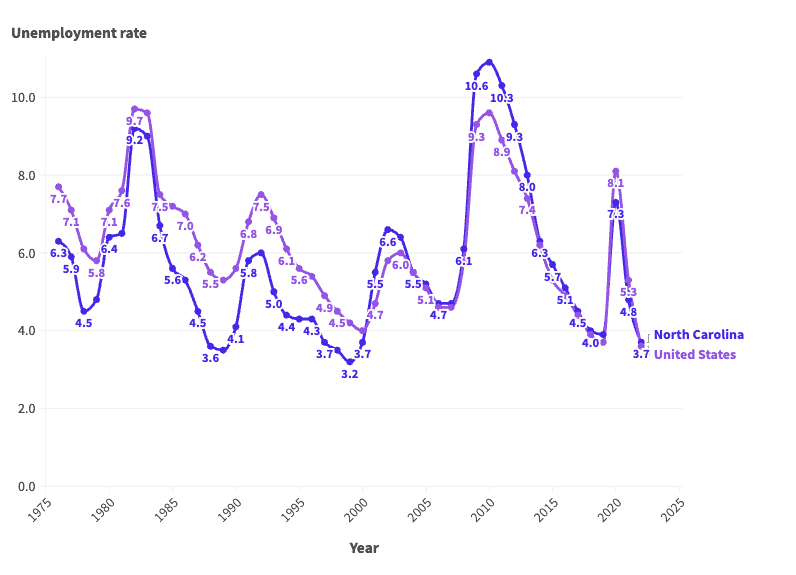
Of course, if history is any guide, much of the economy is subject to boom and bust cycles — and the job market is no exception. Since the mid-1970s, the average annual unemployment rate in the U.S. has fluctuated between 3.6% and nearly 10%, according to the Bureau of Labor Statistics.
These same cyclical patterns are also evident in North Carolina, where the job market is supported largely by the professional and scientific and manufacturing industries. The annual unemployment rate in the state was 3.7% in 2022, only slightly higher than the state’s lowest recorded annual jobless rate of 3.2%. However, conditions for job seekers have not always been so favorable.
According to historical BLS data going back to 1976, the annual jobless rate has been as high as 10.9% in North Carolina. More than once, unemployment in the state has either matched or come close to that peak.
This is how North Carolina’s job market has changed in each of the last 47 years.
1976: 6.3%

- Avg. unemployment rate: 6.3% (7.7% nationwide)
- Labor force participation rate: 66.2% (61.6% nationwide)
- Unemployed population in North Carolina: 162,485
1977: 5.9%

- Avg. unemployment rate: 5.9% (7.1% nationwide)
- Labor force participation rate: 66.7% (62.3% nationwide)
- Unemployed population in North Carolina: 157,981
1978: 4.5%

- Avg. unemployment rate: 4.5% (6.1% nationwide)
- Labor force participation rate: 67.2% (63.2% nationwide)
- Unemployed population in North Carolina: 126,041
1979: 4.8%

- Avg. unemployment rate: 4.8% (5.8% nationwide)
- Labor force participation rate: 66.9% (63.7% nationwide)
- Unemployed population in North Carolina: 135,571
1980: 6.4%

- Avg. unemployment rate: 6.4% (7.1% nationwide)
- Labor force participation rate: 66.5% (63.8% nationwide)
- Unemployed population in North Carolina: 182,356
1981: 6.5%
- Avg. unemployment rate: 6.5% (7.6% nationwide)
- Labor force participation rate: 66.4% (63.9% nationwide)
- Unemployed population in North Carolina: 186,083
1982: 9.2%

- Avg. unemployment rate: 9.2% (9.7% nationwide)
- Labor force participation rate: 66.3% (64.0% nationwide)
- Unemployed population in North Carolina: 272,303
1983: 9.0%

- Avg. unemployment rate: 9.0% (9.6% nationwide)
- Labor force participation rate: 65.8% (64.0% nationwide)
- Unemployed population in North Carolina: 262,896
1984: 6.7%
- Avg. unemployment rate: 6.7% (7.5% nationwide)
- Labor force participation rate: 66.3% (64.4% nationwide)
- Unemployed population in North Carolina: 199,648
1985: 5.6%
- Avg. unemployment rate: 5.6% (7.2% nationwide)
- Labor force participation rate: 66.6% (64.8% nationwide)
- Unemployed population in North Carolina: 176,193
1986: 5.3%
- Avg. unemployment rate: 5.3% (7.0% nationwide)
- Labor force participation rate: 67.4% (65.3% nationwide)
- Unemployed population in North Carolina: 168,653
1987: 4.5%
- Avg. unemployment rate: 4.5% (6.2% nationwide)
- Labor force participation rate: 68.1% (65.6% nationwide)
- Unemployed population in North Carolina: 148,417
1988: 3.6%
- Avg. unemployment rate: 3.6% (5.5% nationwide)
- Labor force participation rate: 68.3% (65.9% nationwide)
- Unemployed population in North Carolina: 123,576
1989: 3.5%
- Avg. unemployment rate: 3.5% (5.3% nationwide)
- Labor force participation rate: 68.7% (66.5% nationwide)
- Unemployed population in North Carolina: 121,066
1990: 4.1%
- Avg. unemployment rate: 4.1% (5.6% nationwide)
- Labor force participation rate: 68.3% (66.5% nationwide)
- Unemployed population in North Carolina: 142,712
1991: 5.8%
- Avg. unemployment rate: 5.8% (6.8% nationwide)
- Labor force participation rate: 68.1% (66.2% nationwide)
- Unemployed population in North Carolina: 209,069
1992: 6.0%
- Avg. unemployment rate: 6.0% (7.5% nationwide)
- Labor force participation rate: 68.4% (66.4% nationwide)
- Unemployed population in North Carolina: 225,630
1993: 5.0%
- Avg. unemployment rate: 5.0% (6.9% nationwide)
- Labor force participation rate: 67.4% (66.3% nationwide)
- Unemployed population in North Carolina: 184,851
1994: 4.4%
- Avg. unemployment rate: 4.4% (6.1% nationwide)
- Labor force participation rate: 67.1% (66.6% nationwide)
- Unemployed population in North Carolina: 162,850
1995: 4.3%
- Avg. unemployment rate: 4.3% (5.6% nationwide)
- Labor force participation rate: 67.0% (66.6% nationwide)
- Unemployed population in North Carolina: 163,421
1996: 4.3%
- Avg. unemployment rate: 4.3% (5.4% nationwide)
- Labor force participation rate: 67.8% (66.8% nationwide)
- Unemployed population in North Carolina: 169,316
1997: 3.7%
- Avg. unemployment rate: 3.7% (4.9% nationwide)
- Labor force participation rate: 68.0% (67.1% nationwide)
- Unemployed population in North Carolina: 152,047
1998: 3.5%
- Avg. unemployment rate: 3.5% (4.5% nationwide)
- Labor force participation rate: 66.9% (67.1% nationwide)
- Unemployed population in North Carolina: 140,602
1999: 3.2%
- Avg. unemployment rate: 3.2% (4.2% nationwide)
- Labor force participation rate: 67.0% (67.1% nationwide)
- Unemployed population in North Carolina: 133,262
2000: 3.7%
- Avg. unemployment rate: 3.7% (4.0% nationwide)
- Labor force participation rate: 67.5% (67.1% nationwide)
- Unemployed population in North Carolina: 154,654
2001: 5.5%
- Avg. unemployment rate: 5.5% (4.7% nationwide)
- Labor force participation rate: 67.6% (66.8% nationwide)
- Unemployed population in North Carolina: 235,835
2002: 6.6%
- Avg. unemployment rate: 6.6% (5.8% nationwide)
- Labor force participation rate: 67.0% (66.6% nationwide)
- Unemployed population in North Carolina: 292,056
2003: 6.4%
- Avg. unemployment rate: 6.4% (6.0% nationwide)
- Labor force participation rate: 67.3% (66.2% nationwide)
- Unemployed population in North Carolina: 287,451
2004: 5.5%
- Avg. unemployment rate: 5.5% (5.5% nationwide)
- Labor force participation rate: 66.5% (66.0% nationwide)
- Unemployed population in North Carolina: 251,731
2005: 5.2%
- Avg. unemployment rate: 5.2% (5.1% nationwide)
- Labor force participation rate: 66.2% (66.0% nationwide)
- Unemployed population in North Carolina: 243,718
2006: 4.7%
- Avg. unemployment rate: 4.7% (4.6% nationwide)
- Labor force participation rate: 66.4% (66.2% nationwide)
- Unemployed population in North Carolina: 228,299
2007: 4.7%
- Avg. unemployment rate: 4.7% (4.6% nationwide)
- Labor force participation rate: 65.8% (66.0% nationwide)
- Unemployed population in North Carolina: 230,902
2008: 6.1%
- Avg. unemployment rate: 6.1% (5.8% nationwide)
- Labor force participation rate: 65.3% (66.0% nationwide)
- Unemployed population in North Carolina: 281,872
2009: 10.6%
- Avg. unemployment rate: 10.6% (9.3% nationwide)
- Labor force participation rate: 64.8% (65.4% nationwide)
- Unemployed population in North Carolina: 509,124
2010: 10.9%
- Avg. unemployment rate: 10.9% (9.6% nationwide)
- Labor force participation rate: 63.5% (64.7% nationwide)
- Unemployed population in North Carolina: 497,912
2011: 10.3%
- Avg. unemployment rate: 10.3% (8.9% nationwide)
- Labor force participation rate: 62.8% (64.1% nationwide)
- Unemployed population in North Carolina: 477,802
2012: 9.3%
- Avg. unemployment rate: 9.3% (8.1% nationwide)
- Labor force participation rate: 62.9% (63.7% nationwide)
- Unemployed population in North Carolina: 448,820
2013: 8.0%
- Avg. unemployment rate: 8.0% (7.4% nationwide)
- Labor force participation rate: 61.9% (63.2% nationwide)
- Unemployed population in North Carolina: 365,012
2014: 6.3%
- Avg. unemployment rate: 6.3% (6.2% nationwide)
- Labor force participation rate: 61.1% (62.9% nationwide)
- Unemployed population in North Carolina: 287,640
2015: 5.7%
- Avg. unemployment rate: 5.7% (5.3% nationwide)
- Labor force participation rate: 61.1% (62.7% nationwide)
- Unemployed population in North Carolina: 269,939
2016: 5.1%
- Avg. unemployment rate: 5.1% (4.9% nationwide)
- Labor force participation rate: 61.2% (62.8% nationwide)
- Unemployed population in North Carolina: 246,395
2017: 4.5%
- Avg. unemployment rate: 4.5% (4.4% nationwide)
- Labor force participation rate: 61.3% (62.9% nationwide)
- Unemployed population in North Carolina: 219,688
2018: 4.0%
- Avg. unemployment rate: 4.0% (3.9% nationwide)
- Labor force participation rate: 61.2% (62.9% nationwide)
- Unemployed population in North Carolina: 196,268
2019: 3.9%
- Avg. unemployment rate: 3.9% (3.7% nationwide)
- Labor force participation rate: 61.4% (63.1% nationwide)
- Unemployed population in North Carolina: 192,382
2020: 7.3%
- Avg. unemployment rate: 7.3% (8.1% nationwide)
- Labor force participation rate: 58.8% (61.7% nationwide)
- Unemployed population in North Carolina: 347,623
2021: 4.8%
- Avg. unemployment rate: 4.8% (5.3% nationwide)
- Labor force participation rate: 59.4% (61.7% nationwide)
- Unemployed population in North Carolina: 241,917
2022: 3.7%
- Avg. unemployment rate: 3.7% (3.6% nationwide)
- Labor force participation rate: 60.9% (62.2% nationwide)
- Unemployed population in North Carolina: 188,331
| Year | North Carolina unemployment rate | U.S. unemployment rate | Unemployed population in North Carolina |
|---|---|---|---|
| 1976 | 6.3 | 7.7 | 162,485 |
| 1977 | 5.9 | 7.1 | 157,981 |
| 1978 | 4.5 | 6.1 | 126,041 |
| 1979 | 4.8 | 5.8 | 135,571 |
| 1980 | 6.4 | 7.1 | 182,356 |
| 1981 | 6.5 | 7.6 | 186,083 |
| 1982 | 9.2 | 9.7 | 272,303 |
| 1983 | 9.0 | 9.6 | 262,896 |
| 1984 | 6.7 | 7.5 | 199,648 |
| 1985 | 5.6 | 7.2 | 176,193 |
| 1986 | 5.3 | 7.0 | 168,653 |
| 1987 | 4.5 | 6.2 | 148,417 |
| 1988 | 3.6 | 5.5 | 123,576 |
| 1989 | 3.5 | 5.3 | 121,066 |
| 1990 | 4.1 | 5.6 | 142,712 |
| 1991 | 5.8 | 6.8 | 209,069 |
| 1992 | 6.0 | 7.5 | 225,630 |
| 1993 | 5.0 | 6.9 | 184,851 |
| 1994 | 4.4 | 6.1 | 162,850 |
| 1995 | 4.3 | 5.6 | 163,421 |
| 1996 | 4.3 | 5.4 | 169,316 |
| 1997 | 3.7 | 4.9 | 152,047 |
| 1998 | 3.5 | 4.5 | 140,602 |
| 1999 | 3.2 | 4.2 | 133,262 |
| 2000 | 3.7 | 4.0 | 154,654 |
| 2001 | 5.5 | 4.7 | 235,835 |
| 2002 | 6.6 | 5.8 | 292,056 |
| 2003 | 6.4 | 6.0 | 287,451 |
| 2004 | 5.5 | 5.5 | 251,731 |
| 2005 | 5.2 | 5.1 | 243,718 |
| 2006 | 4.7 | 4.6 | 228,299 |
| 2007 | 4.7 | 4.6 | 230,902 |
| 2008 | 6.1 | 5.8 | 281,872 |
| 2009 | 10.6 | 9.3 | 509,124 |
| 2010 | 10.9 | 9.6 | 497,912 |
| 2011 | 10.3 | 8.9 | 477,802 |
| 2012 | 9.3 | 8.1 | 448,820 |
| 2013 | 8.0 | 7.4 | 365,012 |
| 2014 | 6.3 | 6.2 | 287,640 |
| 2015 | 5.7 | 5.3 | 269,939 |
| 2016 | 5.1 | 4.9 | 246,395 |
| 2017 | 4.5 | 4.4 | 219,688 |
| 2018 | 4.0 | 3.9 | 196,268 |
| 2019 | 3.9 | 3.7 | 192,382 |
| 2020 | 7.3 | 8.1 | 347,623 |
| 2021 | 4.8 | 5.3 | 241,917 |
| 2022 | 3.7 | 3.6 | 188,331 |