![](https://a673b.bigscoots-temp.com/wp-content/uploads/2022/03/imageForEntry17-9A1.jpg)
In an era of economic uncertainty, the U.S. job market remains resilient. After falling to 3.7% in November 2023, the national unemployment rate has been below 4% for 22 consecutive months, the longest streak in over 50 years.
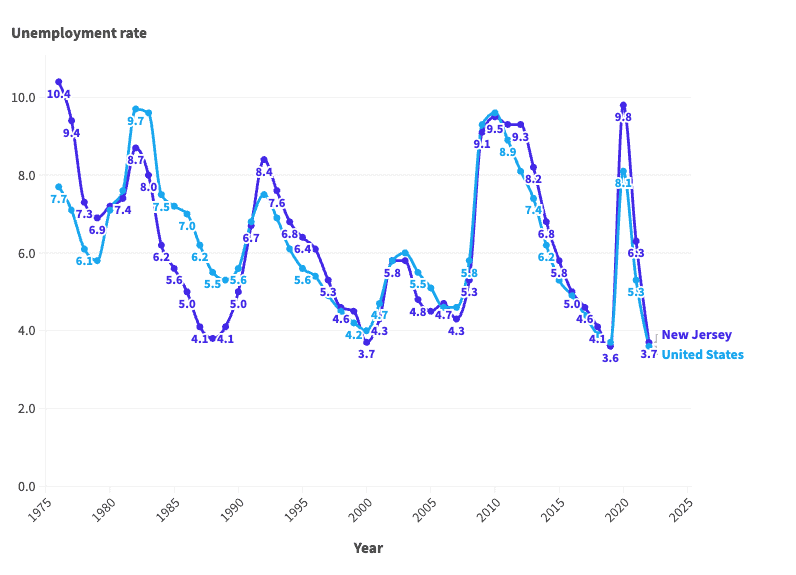
Of course, if history is any guide, much of the economy is subject to boom and bust cycles — and the job market is no exception. Since the mid-1970s, the average annual unemployment rate in the U.S. has fluctuated between 3.6% and nearly 10%, according to the Bureau of Labor Statistics.
These same cyclical patterns are also evident in New Jersey, where the job market is supported largely by the professional and scientific and retail trade industries. The annual unemployment rate in the state was 3.7% in 2022, closely in line with the state’s lowest recorded annual jobless rate of 3.6%. However, conditions for job seekers have not always been so favorable.
According to historical BLS data going back to 1976, the annual jobless rate has been as high as 10.4% in New Jersey. More than once, unemployment in the state has either matched or come close to that peak.
This is how New Jersey’s job market has changed in each of the last 47 years.
1976: 10.4% unemployment
![](https://a673b.bigscoots-temp.com/wp-content/uploads/2022/10/imageForEntry49-oor.jpg)
- Avg. unemployment rate: 10.4% (7.7% nationwide)
- Labor force participation rate: 61.7% (61.6% nationwide)
- Unemployed population in New Jersey: 344,980
1977: 9.4% unemployment
![](https://a673b.bigscoots-temp.com/wp-content/uploads/2022/10/imageForEntry38-aTj.jpg)
- Avg. unemployment rate: 9.4% (7.1% nationwide)
- Labor force participation rate: 62.3% (62.3% nationwide)
- Unemployed population in New Jersey: 314,764
1978: 7.3% unemployment
![](https://a673b.bigscoots-temp.com/wp-content/uploads/2022/10/imageForEntry27-2Kj.jpg)
- Avg. unemployment rate: 7.3% (6.1% nationwide)
- Labor force participation rate: 62.9% (63.2% nationwide)
- Unemployed population in New Jersey: 250,727
1979: 6.9% unemployment
![](https://a673b.bigscoots-temp.com/wp-content/uploads/2022/10/imageForEntry30-638.jpg)
- Avg. unemployment rate: 6.9% (5.8% nationwide)
- Labor force participation rate: 64.1% (63.7% nationwide)
- Unemployed population in New Jersey: 244,204
1980: 7.2% unemployment
![](https://a673b.bigscoots-temp.com/wp-content/uploads/2022/10/imageForEntry20-5Ri.jpg)
- Avg. unemployment rate: 7.2% (7.1% nationwide)
- Labor force participation rate: 64.1% (63.8% nationwide)
- Unemployed population in New Jersey: 256,104
1981: 7.4% unemployment
![](https://a673b.bigscoots-temp.com/wp-content/uploads/2022/10/imageForEntry25-5CF.jpg)
- Avg. unemployment rate: 7.4% (7.6% nationwide)
- Labor force participation rate: 63.8% (63.9% nationwide)
- Unemployed population in New Jersey: 272,354
1982: 8.7% unemployment
![](https://a673b.bigscoots-temp.com/wp-content/uploads/2022/10/imageForEntry30-LYP.jpg)
- Avg. unemployment rate: 8.7% (9.7% nationwide)
- Labor force participation rate: 63.6% (64.0% nationwide)
- Unemployed population in New Jersey: 317,013
1983: 8.0% unemployment
![](https://a673b.bigscoots-temp.com/wp-content/uploads/2022/10/imageForEntry24-y1O.jpg)
- Avg. unemployment rate: 8.0% (9.6% nationwide)
- Labor force participation rate: 63.9% (64.0% nationwide)
- Unemployed population in New Jersey: 302,456
1984: 6.2% unemployment
![](https://a673b.bigscoots-temp.com/wp-content/uploads/2022/10/imageForEntry49-oor.jpg)
- Avg. unemployment rate: 6.2% (7.5% nationwide)
- Labor force participation rate: 65.2% (64.4% nationwide)
- Unemployed population in New Jersey: 238,131
1985: 5.6% unemployment
![](https://a673b.bigscoots-temp.com/wp-content/uploads/2022/10/imageForEntry38-aTj.jpg)
- Avg. unemployment rate: 5.6% (7.2% nationwide)
- Labor force participation rate: 65.3% (64.8% nationwide)
- Unemployed population in New Jersey: 215,439
1986: 5.0% unemployment
![](https://a673b.bigscoots-temp.com/wp-content/uploads/2022/10/imageForEntry27-2Kj.jpg)
- Avg. unemployment rate: 5.0% (7.0% nationwide)
- Labor force participation rate: 65.5% (65.3% nationwide)
- Unemployed population in New Jersey: 195,822
1987: 4.1% unemployment
![](https://a673b.bigscoots-temp.com/wp-content/uploads/2022/10/imageForEntry30-638.jpg)
- Avg. unemployment rate: 4.1% (6.2% nationwide)
- Labor force participation rate: 65.9% (65.6% nationwide)
- Unemployed population in New Jersey: 159,814
1988: 3.8% unemployment
![](https://a673b.bigscoots-temp.com/wp-content/uploads/2022/10/imageForEntry20-5Ri.jpg)
- Avg. unemployment rate: 3.8% (5.5% nationwide)
- Labor force participation rate: 65.8% (65.9% nationwide)
- Unemployed population in New Jersey: 149,448
1989: 4.1% unemployment
![](https://a673b.bigscoots-temp.com/wp-content/uploads/2022/10/imageForEntry25-5CF.jpg)
- Avg. unemployment rate: 4.1% (5.3% nationwide)
- Labor force participation rate: 66.2% (66.5% nationwide)
- Unemployed population in New Jersey: 162,153
1990: 5.0% unemployment
![](https://a673b.bigscoots-temp.com/wp-content/uploads/2022/10/imageForEntry30-LYP.jpg)
- Avg. unemployment rate: 5.0% (5.6% nationwide)
- Labor force participation rate: 67.2% (66.5% nationwide)
- Unemployed population in New Jersey: 205,742
1991: 6.7% unemployment
![](https://a673b.bigscoots-temp.com/wp-content/uploads/2022/10/imageForEntry24-y1O.jpg)
- Avg. unemployment rate: 6.7% (6.8% nationwide)
- Labor force participation rate: 66.9% (66.2% nationwide)
- Unemployed population in New Jersey: 275,916
1992: 8.4% unemployment
![](https://a673b.bigscoots-temp.com/wp-content/uploads/2022/10/imageForEntry49-oor.jpg)
- Avg. unemployment rate: 8.4% (7.5% nationwide)
- Labor force participation rate: 66.6% (66.4% nationwide)
- Unemployed population in New Jersey: 344,989
1993: 7.6% unemployment
![](https://a673b.bigscoots-temp.com/wp-content/uploads/2022/10/imageForEntry38-aTj.jpg)
- Avg. unemployment rate: 7.6% (6.9% nationwide)
- Labor force participation rate: 65.7% (66.3% nationwide)
- Unemployed population in New Jersey: 312,372
1994: 6.8% unemployment
![](https://a673b.bigscoots-temp.com/wp-content/uploads/2022/10/imageForEntry27-2Kj.jpg)
- Avg. unemployment rate: 6.8% (6.1% nationwide)
- Labor force participation rate: 66.1% (66.6% nationwide)
- Unemployed population in New Jersey: 277,766
1995: 6.4% unemployment
![](https://a673b.bigscoots-temp.com/wp-content/uploads/2022/10/imageForEntry30-638.jpg)
- Avg. unemployment rate: 6.4% (5.6% nationwide)
- Labor force participation rate: 66.4% (66.6% nationwide)
- Unemployed population in New Jersey: 264,064
1996: 6.1% unemployment
![](https://a673b.bigscoots-temp.com/wp-content/uploads/2022/10/imageForEntry20-5Ri.jpg)
- Avg. unemployment rate: 6.1% (5.4% nationwide)
- Labor force participation rate: 67.0% (66.8% nationwide)
- Unemployed population in New Jersey: 256,525
1997: 5.3% unemployment
![](https://a673b.bigscoots-temp.com/wp-content/uploads/2022/10/imageForEntry25-5CF.jpg)
- Avg. unemployment rate: 5.3% (4.9% nationwide)
- Labor force participation rate: 67.4% (67.1% nationwide)
- Unemployed population in New Jersey: 225,730
1998: 4.6% unemployment
![](https://a673b.bigscoots-temp.com/wp-content/uploads/2022/10/imageForEntry30-LYP.jpg)
- Avg. unemployment rate: 4.6% (4.5% nationwide)
- Labor force participation rate: 66.7% (67.1% nationwide)
- Unemployed population in New Jersey: 194,163
1999: 4.5% unemployment
![](https://a673b.bigscoots-temp.com/wp-content/uploads/2022/10/imageForEntry24-y1O.jpg)
- Avg. unemployment rate: 4.5% (4.2% nationwide)
- Labor force participation rate: 66.9% (67.1% nationwide)
- Unemployed population in New Jersey: 188,596
2000: 3.7% unemployment
![](https://a673b.bigscoots-temp.com/wp-content/uploads/2022/10/imageForEntry49-oor.jpg)
- Avg. unemployment rate: 3.7% (4.0% nationwide)
- Labor force participation rate: 66.6% (67.1% nationwide)
- Unemployed population in New Jersey: 156,816
2001: 4.3% unemployment
![](https://a673b.bigscoots-temp.com/wp-content/uploads/2022/10/imageForEntry38-aTj.jpg)
- Avg. unemployment rate: 4.3% (4.7% nationwide)
- Labor force participation rate: 66.2% (66.8% nationwide)
- Unemployed population in New Jersey: 182,271
2002: 5.8% unemployment
![](https://a673b.bigscoots-temp.com/wp-content/uploads/2022/10/imageForEntry27-2Kj.jpg)
- Avg. unemployment rate: 5.8% (5.8% nationwide)
- Labor force participation rate: 66.5% (66.6% nationwide)
- Unemployed population in New Jersey: 250,884
2003: 5.8% unemployment
![](https://a673b.bigscoots-temp.com/wp-content/uploads/2022/10/imageForEntry30-638.jpg)
- Avg. unemployment rate: 5.8% (6.0% nationwide)
- Labor force participation rate: 66.1% (66.2% nationwide)
- Unemployed population in New Jersey: 252,922
2004: 4.8% unemployment
![](https://a673b.bigscoots-temp.com/wp-content/uploads/2022/10/imageForEntry20-5Ri.jpg)
- Avg. unemployment rate: 4.8% (5.5% nationwide)
- Labor force participation rate: 65.9% (66.0% nationwide)
- Unemployed population in New Jersey: 213,984
2005: 4.5% unemployment
![](https://a673b.bigscoots-temp.com/wp-content/uploads/2022/10/imageForEntry25-5CF.jpg)
- Avg. unemployment rate: 4.5% (5.1% nationwide)
- Labor force participation rate: 66.2% (66.0% nationwide)
- Unemployed population in New Jersey: 194,908
2006: 4.7% unemployment
![](https://a673b.bigscoots-temp.com/wp-content/uploads/2022/10/imageForEntry30-LYP.jpg)
- Avg. unemployment rate: 4.7% (4.6% nationwide)
- Labor force participation rate: 66.6% (66.2% nationwide)
- Unemployed population in New Jersey: 204,798
2007: 4.3% unemployment
![](https://a673b.bigscoots-temp.com/wp-content/uploads/2022/10/imageForEntry24-y1O.jpg)
- Avg. unemployment rate: 4.3% (4.6% nationwide)
- Labor force participation rate: 66.3% (66.0% nationwide)
- Unemployed population in New Jersey: 187,110
2008: 5.3% unemployment
![](https://a673b.bigscoots-temp.com/wp-content/uploads/2022/10/imageForEntry49-oor.jpg)
- Avg. unemployment rate: 5.3% (5.8% nationwide)
- Labor force participation rate: 66.9% (66.0% nationwide)
- Unemployed population in New Jersey: 244,481
2009: 9.1% unemployment
![](https://a673b.bigscoots-temp.com/wp-content/uploads/2022/10/imageForEntry38-aTj.jpg)
- Avg. unemployment rate: 9.1% (9.3% nationwide)
- Labor force participation rate: 67.1% (65.4% nationwide)
- Unemployed population in New Jersey: 406,937
2010: 9.5% unemployment
![](https://a673b.bigscoots-temp.com/wp-content/uploads/2022/10/imageForEntry27-2Kj.jpg)
- Avg. unemployment rate: 9.5% (9.6% nationwide)
- Labor force participation rate: 66.5% (64.7% nationwide)
- Unemployed population in New Jersey: 440,796
2011: 9.3% unemployment
![](https://a673b.bigscoots-temp.com/wp-content/uploads/2022/10/imageForEntry30-638.jpg)
- Avg. unemployment rate: 9.3% (8.9% nationwide)
- Labor force participation rate: 66.0% (64.1% nationwide)
- Unemployed population in New Jersey: 427,078
2012: 9.3% unemployment
![](https://a673b.bigscoots-temp.com/wp-content/uploads/2022/10/imageForEntry20-5Ri.jpg)
- Avg. unemployment rate: 9.3% (8.1% nationwide)
- Labor force participation rate: 65.9% (63.7% nationwide)
- Unemployed population in New Jersey: 429,065
2013: 8.2% unemployment
![](https://a673b.bigscoots-temp.com/wp-content/uploads/2022/10/imageForEntry25-5CF.jpg)
- Avg. unemployment rate: 8.2% (7.4% nationwide)
- Labor force participation rate: 64.9% (63.2% nationwide)
- Unemployed population in New Jersey: 380,358
2014: 6.8% unemployment
![](https://a673b.bigscoots-temp.com/wp-content/uploads/2022/10/imageForEntry30-LYP.jpg)
- Avg. unemployment rate: 6.8% (6.2% nationwide)
- Labor force participation rate: 64.2% (62.9% nationwide)
- Unemployed population in New Jersey: 302,576
2015: 5.8% unemployment
![](https://a673b.bigscoots-temp.com/wp-content/uploads/2022/10/imageForEntry24-y1O.jpg)
- Avg. unemployment rate: 5.8% (5.3% nationwide)
- Labor force participation rate: 64.1% (62.7% nationwide)
- Unemployed population in New Jersey: 256,730
2016: 5.0% unemployment
![](https://a673b.bigscoots-temp.com/wp-content/uploads/2022/10/imageForEntry49-oor.jpg)
- Avg. unemployment rate: 5.0% (4.9% nationwide)
- Labor force participation rate: 63.9% (62.8% nationwide)
- Unemployed population in New Jersey: 221,620
2017: 4.6% unemployment
![](https://a673b.bigscoots-temp.com/wp-content/uploads/2022/10/imageForEntry38-aTj.jpg)
- Avg. unemployment rate: 4.6% (4.4% nationwide)
- Labor force participation rate: 63.5% (62.9% nationwide)
- Unemployed population in New Jersey: 208,802
2018: 4.1% unemployment
![](https://a673b.bigscoots-temp.com/wp-content/uploads/2022/10/imageForEntry27-2Kj.jpg)
- Avg. unemployment rate: 4.1% (3.9% nationwide)
- Labor force participation rate: 63.0% (62.9% nationwide)
- Unemployed population in New Jersey: 184,074
2019: 3.6% unemployment
![](https://a673b.bigscoots-temp.com/wp-content/uploads/2022/10/imageForEntry30-638.jpg)
- Avg. unemployment rate: 3.6% (3.7% nationwide)
- Labor force participation rate: 63.7% (63.1% nationwide)
- Unemployed population in New Jersey: 161,970
2020: 9.8% unemployment
![](https://a673b.bigscoots-temp.com/wp-content/uploads/2022/10/imageForEntry20-5Ri.jpg)
- Avg. unemployment rate: 9.8% (8.1% nationwide)
- Labor force participation rate: 62.9% (61.7% nationwide)
- Unemployed population in New Jersey: 437,937
2021: 6.3% unemployment
![](https://a673b.bigscoots-temp.com/wp-content/uploads/2022/10/imageForEntry25-5CF.jpg)
- Avg. unemployment rate: 6.3% (5.3% nationwide)
- Labor force participation rate: 63.0% (61.7% nationwide)
- Unemployed population in New Jersey: 308,891
2022: 3.7% unemployment
![](https://a673b.bigscoots-temp.com/wp-content/uploads/2022/10/imageForEntry30-LYP.jpg)
- Avg. unemployment rate: 3.7% (3.6% nationwide)
- Labor force participation rate: 63.9% (62.2% nationwide)
- Unemployed population in New Jersey: 175,691
![](https://a673b.bigscoots-temp.com/wp-content/uploads/2023/12/New-Jersey-unemployment.png)
Year | New Jersey unemployment rate | U.S. unemployment rate |
---|---|---|
1976 | 10.4 | 7.7 |
1977 | 9.4 | 7.1 |
1978 | 7.3 | 6.1 |
1979 | 6.9 | 5.8 |
1980 | 7.2 | 7.1 |
1981 | 7.4 | 7.6 |
1982 | 8.7 | 9.7 |
1983 | 8.0 | 9.6 |
1984 | 6.2 | 7.5 |
1985 | 5.6 | 7.2 |
1986 | 5.0 | 7.0 |
1987 | 4.1 | 6.2 |
1988 | 3.8 | 5.5 |
1989 | 4.1 | 5.3 |
1990 | 5.0 | 5.6 |
1991 | 6.7 | 6.8 |
1992 | 8.4 | 7.5 |
1993 | 7.6 | 6.9 |
1994 | 6.8 | 6.1 |
1995 | 6.4 | 5.6 |
1996 | 6.1 | 5.4 |
1997 | 5.3 | 4.9 |
1998 | 4.6 | 4.5 |
1999 | 4.5 | 4.2 |
2000 | 3.7 | 4.0 |
2001 | 4.3 | 4.7 |
2002 | 5.8 | 5.8 |
2003 | 5.8 | 6.0 |
2004 | 4.8 | 5.5 |
2005 | 4.5 | 5.1 |
2006 | 4.7 | 4.6 |
2007 | 4.3 | 4.6 |
2008 | 5.3 | 5.8 |
2009 | 9.1 | 9.3 |
2010 | 9.5 | 9.6 |
2011 | 9.3 | 8.9 |
2012 | 9.3 | 8.1 |
2013 | 8.2 | 7.4 |
2014 | 6.8 | 6.2 |
2015 | 5.8 | 5.3 |
2016 | 5.0 | 4.9 |
2017 | 4.6 | 4.4 |
2018 | 4.1 | 3.9 |
2019 | 3.6 | 3.7 |
2020 | 9.8 | 8.1 |
2021 | 6.3 | 5.3 |
2022 | 3.7 | 3.6 |
Take This Retirement Quiz To Get Matched With An Advisor Now (Sponsored)
Are you ready for retirement? Planning for retirement can be overwhelming, that’s why it could be a good idea to speak to a fiduciary financial advisor about your goals today.
Start by taking this retirement quiz right here from SmartAsset that will match you with up to 3 financial advisors that serve your area and beyond in 5 minutes. Smart Asset is now matching over 50,000 people a month.
Click here now to get started.
Thank you for reading! Have some feedback for us?
Contact the 24/7 Wall St. editorial team.