Special Report

How Indiana's Job Market Has Fared Since Trump Was Elected

Coy St. Clair / iStock via Getty Images

In an era of economic uncertainty, the U.S. job market remains resilient. After falling to 3.7% in November 2023, the national unemployment rate has been below 4% for 22 consecutive months, the longest streak in over 50 years.

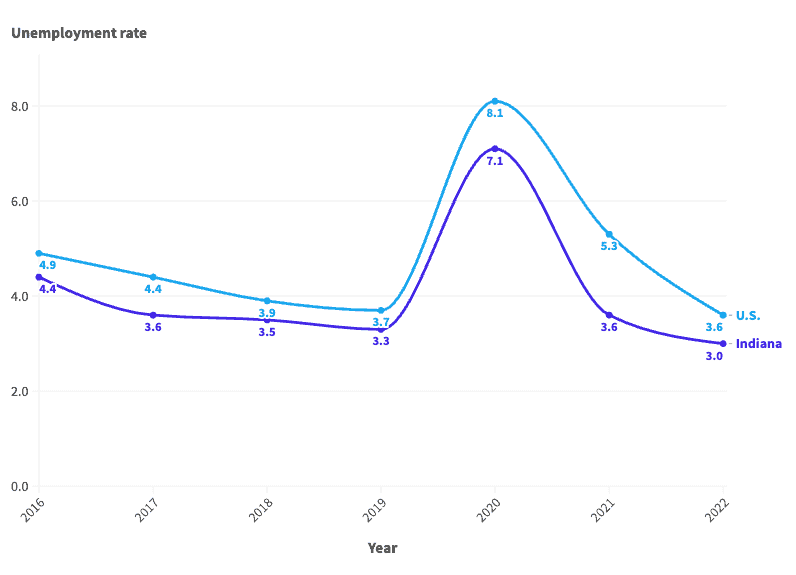
Of course, if history is any guide, much of the economy is subject to boom and bust cycles — and the job market is no exception. In the last seven years — a period that spanned three presidential administrations and included a global pandemic — the average annual unemployment rate in the U.S. has fluctuated between 3.6% and 8.1%, according to the Bureau of Labor Statistics.

These same cyclical patterns are also evident in Indiana, where the job market is supported largely by the manufacturing and retail trade industries. The annual unemployment rate in the state was 3.0% in 2022, a multi-decade low. However, conditions for job seekers have not always been so favorable.

According to BLS data going back to 2016, the year Donald Trump was elected president, the annual jobless rate has been as high as 7.1% in Indiana.

This is how Indiana’s job market has changed since 2016.

2016: 4.4% unemployment

Source: Ultima_Gaina / iStock via Getty Images

  • Avg. unemployment rate: 4.4% (4.9% nationwide)
  • Labor force participation rate: 64.7% (62.8% nationwide)
  • Unemployed population in Indiana: 145,401

2017: 3.6% unemployment

Source: Ron and Patty Thomas / iStock via Getty Images
  • Avg. unemployment rate: 3.6% (4.4% nationwide)
  • Labor force participation rate: 64.2% (62.9% nationwide)
  • Unemployed population in Indiana: 116,644

2018: 3.5% unemployment

Source: Sean Pavone / iStock via Getty Images
  • Avg. unemployment rate: 3.5% (3.9% nationwide)
  • Labor force participation rate: 64.9% (62.9% nationwide)
  • Unemployed population in Indiana: 115,774

2019: 3.3% unemployment

Source: jetcityimage / iStock Editorial via Getty Images
  • Avg. unemployment rate: 3.3% (3.7% nationwide)
  • Labor force participation rate: 64.7% (63.1% nationwide)
  • Unemployed population in Indiana: 112,371

2020: 7.1% unemployment

Source: f11photo / iStock via Getty Images
  • Avg. unemployment rate: 7.1% (8.1% nationwide)
  • Labor force participation rate: 63.1% (61.7% nationwide)
  • Unemployed population in Indiana: 243,638

2021: 3.6% unemployment

Source: Jacob Boomsma / iStock via Getty Images
  • Avg. unemployment rate: 3.6% (5.3% nationwide)
  • Labor force participation rate: 62.9% (61.7% nationwide)
  • Unemployed population in Indiana: 130,582

2022: 3.0% unemployment

Source: Aaron Yoder / iStock via Getty Images
  • Avg. unemployment rate: 3.0% (3.6% nationwide)
  • Labor force participation rate: 63.5% (62.2% nationwide)
  • Unemployed population in Indiana: 101,811

Source: 24/7 Wall St.

Year Indiana unemployment rate (%) U.S. unemployment rate (%) Unemployed population in Indiana
2016 4.4 4.9 145,401
2017 3.6 4.4 116,644
2018 3.5 3.9 115,774
2019 3.3 3.7 112,371
2020 7.1 8.1 243,638
2021 3.6 5.3 130,582
2022 3.0 3.6 101,811

Take This Retirement Quiz To Get Matched With An Advisor Now (Sponsored)

Are you ready for retirement? Planning for retirement can be overwhelming, that’s why it could be a good idea to speak to a fiduciary financial advisor about your goals today.

Start by taking this retirement quiz right here from SmartAsset that will match you with up to 3 financial advisors that serve your area and beyond in 5 minutes. Smart Asset is now matching over 50,000 people a month.

Click here now to get started.

Thank you for reading! Have some feedback for us?
Contact the 24/7 Wall St. editorial team.